. 2024 Dec 2;22(12):e3002940.
doi: 10.1371/journal.pbio.3002940. eCollection 2024 Dec.

Melanocortin 1 receptor mediates melanin production by interacting with the BBSome in primary cilia

Affiliations

Melanocortin 1 receptor mediates melanin production by interacting with the BBSome in primary cilia

Xiaoyu Tian et al. PLoS Biol. .

Abstract

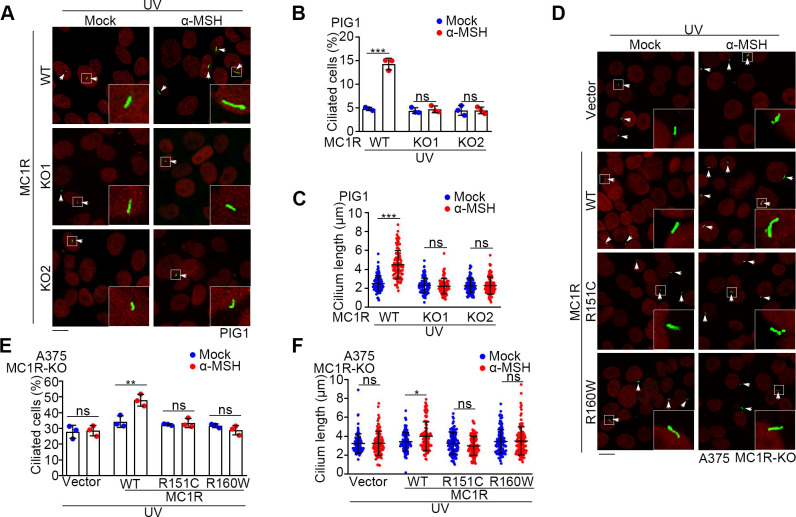
Production of melanin pigments is a protective mechanism of the skin against ultraviolet (UV)-induced damage and carcinogenesis. However, the molecular basis for melanogenesis is still poorly understood. Herein, we demonstrate a critical interplay between the primary cilium and the melanocortin 1 receptor (MC1R) signaling. Our data show that UV and α-melanocyte-stimulating hormone (α-MSH) trigger cilium formation in human melanocytes and melanoma cells. Deficiency of MC1R or the presence of its red hair color (RHC) variations significantly attenuates the UV/α-MSH-induced ciliogenesis. Further investigation reveals that MC1R enters the cilium upon UV/α-MSH stimulation, which is facilitated by the interaction of MC1R with the BBSome and the palmitoylation of MC1R. MC1R interacts with the BBSome through the second and third intercellular loops, which contain the common RHC variant alleles (R151C and R160W). These RHC variants of MC1R exhibit attenuated ciliary localization, and enforced ciliary localization of these variants elevates melanogenesis. Ciliary MC1R triggers a sustained cAMP signaling and selectively stimulates Sox9, which appears to up-regulate melanogenesis-related genes as the transcriptional cofactor for MITF. These findings reveal a previously unrecognized nexus between MC1R and cilia and suggest an important mechanism for RHC variant-related pigmentary defects.


Conflict of interest statement

The authors have declared that no competing interests exist.

Figures

Fig 1
Fig 1. UV and α-MSH induce cilium formation in melanocytes and melanoma cells.
(A) Top 13 enriched terms in the GO analysis of pigmentary genes listed in the International Federation of Pigment Cell Societies. (B–D) Immunofluorescence images (B) and quantification of the percentage of ciliated cells (n = 5 independent experiments) (C) and cilium length (n ≥ 50 cells) (D) of primary human melanocytes that were mock-treated, or treated with UV, 100 nM α-MSH, or both. Cells were treated with α-MSH for 24 h in the presence of serum after UV exposure. Cells were stained with the Arl13b antibody (green) and DAPI (red, pseudocolor). Ciliated cells were marked with white arrows. Scale bar, 10 μm. (E–G) Immunofluorescence images (E) and quantification of the percentage of ciliated cells (n = 3 independent experiments) (F) and cilium length (n ≥ 50 cells) (G) of primary human melanocytes that were treated with vehicle (PBS) or 10 nM ASIP with or without UV/α-MSH (100 nM). Cells were treated with α-MSH for 24 h in the presence of serum after UV exposure. Cells were stained with the Arl13b antibody (green) and DAPI (red, pseudocolor). Ciliated cells were marked with white arrows. Scale bar, 10 μm. (H–J) Immunofluorescence images (H) and quantification of the percentage of ciliated cells (n = 3 independent experiments) (I) and cilium length (n ≥ 50 cells) (J) of PIG1 cells that were mock-treated, or treated with UV, 100 nM α-MSH, or both. Cells were treated with α-MSH for 24 h in the absence of serum after UV exposure, under either vehicle (DMSO) or 100 nM cytochalasin D (Cyto D) treatment conditions. Cells were stained with the Arl13b antibody (green) and DAPI (red, pseudocolor). Ciliated cells were marked with white arrows. Scale bar, 10 μm. (K and L) Quantification of the percentage of ciliated cells (n = 3 independent experiments) (K) and cilium length (n ≥ 50 cells) (L) of SK-MEL-2 cells that were mock-treated, or treated with UV, 100 nM α-MSH, or both. Cells were treated with α-MSH for 24 h in the absence of serum after UV exposure, under either vehicle (DMSO) or Cyto D treatment conditions. Cells were stained with the Arl13b antibody (green) and DAPI (red, pseudocolor). Scale bar, 10 μm. (M and N) Quantification of the percentage of ciliated cells (n = 3 independent experiments) (M) and cilium length (n ≥ 50 cells) (N) of A375 cells that were mock-treated, or treated with UV, 100 nM α-MSH, or both. Cells were treated with α-MSH for 24 h in the absence of serum after UV exposure, under either vehicle (DMSO) or Cyto D treatment conditions. Cells were stained with the Arl13b antibody (green) and DAPI (red, pseudocolor). Scale bar, 10 μm. Data are presented as mean ± SD. Statistical significance was determined by one-way ANOVA (C, D, and I–N) or unpaired two-tailed Student’s t test (F and G); *p < 0.05, **p < 0.01, ***p < 0.001; ns, not significant. See also S1 Fig. The underlying data for this figure can be found in S1 File and S1 Data. α-MSH, α-melanocyte-stimulating hormone; ASIP, agouti-signaling protein; GO, gene ontology; UV, ultraviolet.
Fig 2
Fig 2. MC1R mediates the activity of α-MSH to trigger cilium formation.
(A–C) Immunofluorescence images (A) and quantification of the percentage of ciliated cells (n = 3 independent experiments) (B) and cilium length (n ≥ 50 cells) (C) of PIG1 MC1R-WT and MC1R-KO cells that were mock-treated, or treated with 100 nM α-MSH for 24 h in the absence of serum after UV exposure. Cells were stained with the Arl13b antibody (green) and DAPI (red, pseudocolor). Ciliated cells were marked with white arrows. Scale bar, 10 μm. (D–F) Immunofluorescence images (D) and quantification of the percentage of ciliated cells (n = 3 independent experiments) (E) and cilium length (n ≥ 50 cells) (F) of A375 MC1R-KO rescued with the control vector or the MC1R variants. Cells were mock-treated or with 100 nM α-MSH for 24 h in the absence of serum after UV exposure and stained with the Arl13b antibody (green) and DAPI (red, pseudocolor). Ciliated cells were marked with white arrows. Scale bar, 10 μm. Data are presented as mean ± SD. Statistical significance was determined by unpaired two-tailed Student’s t test; *p < 0.05, **p < 0.01, ***p < 0.001; ns, not significant. See also S2 Fig. The underlying data for this figure can be found in S2 File and S1 Data. α-MSH, α-melanocyte-stimulating hormone; MC1R, melanocortin 1 receptor.
Fig 3
Fig 3. Ciliary localization of MC1R is critical for its role in melanogenesis.
(A) Immunofluorescence images of PIG1 cells transfected with MC1R-mEmerald (green) and mock-treated, or treated with UV, 100 nM α-MSH, or both. Cells were treated with α-MSH for 36 h in the absence of serum after UV exposure. Cells were stained with the Arl13b antibody (red). Scale bar, 5 μm. (B) MC1R ciliary enrichment analysis of panel A as previously reported [16]. Ciliary and cell body intensity of MC1R was measured using ImageJ. Enrichment at the cilium is expressed as: (integrated density at the cilium)/(integrated density in the cell body). Enrichment > 1 indicates higher localization of mEmerald tagged MC1R at the primary cilium than at the cell body. Every replicate was represented as a superplot. (n = 30 ciliated cells from 3 different replicates) (C, D) Immunofluorescence images (C) of A375 MC1R-KO cells transfected with WT, R151C, or R160W MC1R-mEmerald (green) and mock-treated or treated with 100 nM α-MSH for 36 h in the absence of serum after UV exposure. Cells were stained with the Arl13b antibody (red). The percentage of ciliated cells with ciliary MC1R localization was quantified in panel D (n = 3 independent experiments). Scale bar, 5 μm. (E) Immunofluorescence images of MC1R-mEmerald transfected primary human melanocytes treated with UV/α-MSH (100 nM). Cells were treated with α-MSH for 36 h in the presence of serum after UV exposure. Cells were stained with the Arl13b (red) and TYRP1 (magenta) antibodies. Nuclei were stained with DAPI (blue). Representative images for non-ciliated cells, ciliated cells without ciliary MC1R (MC1R cilium), and ciliated cells with ciliary MC1R (MC1R+ cilium) were selected from the same slides. Scale bar, 10 μm. (F) Quantification of the number of TYRP1 puncta (n = 20 cells) as described in E. (G) Tyrosinase activity of primary human melanocytes that were mock treated, treated with 100 nM α-MSH, 100 nM α-MSH/30 μm ciliobrevin A (Cilio A), or 100 nM α-MSH/2 mM CH for 36 h in the absence of serum after UV exposure (n = 3 independent experiments). (H) Quantitative RT-PCR analysis of melanogenesis-related genes in primary human melanocytes treated as described in G (n = 3 independent experiments). TYR, tyrosinase; DCT, dopachrome tautomerase; MITF, melanocyte inducing transcription factor; TYRP1, tyrosinase related protein 1; PMEL, premelanosome protein. (I) Immunoblot analysis of melanogenesis-related proteins in primary human melanocytes treated as described in G. GAPDH served as a control. (J) Tyrosinase activity of A375 MC1R-KO cells rescued with different forms of MC1R (n = 5 independent experiments). Cilio-MC1R was constructed by fusing the ciliary protein Arl13b with WT, R151C, or R160W MC1R. Cells were treated with or without 100 nM α-MSH for 36 h in the absence of serum and UV. Data are presented as mean ± SD. Statistical significance was determined by one-way ANOVA; *p < 0.05, **p < 0.01, ***p < 0.001; ns, not significant. See also S3 Fig. The underlying data for this figure can be found in S1 Data. The uncropped blots are included in S1 Raw Images. α-MSH, α-melanocyte-stimulating hormone; CH, chloral hydrate; MC1R, melanocortin 1 receptor; UV, ultraviolet.
Fig 4
Fig 4. BBS2 interacts with MC1R to facilitate its ciliary localization.
(A) Immunoprecipitation and immunoblotting showing the interaction between MC1R-mEmerald and endogenous BBSome proteins. A375 MC1R-KO cells were transfected with MC1R-mEmerald and treated with UV/α-MSH (100 nM). Cells were treated with α-MSH for 36 h in the absence of serum after UV exposure. (B) Pull-down analysis of the interaction between MC1R and BBSome proteins. (C) Immunoprecipitation and immunoblotting showing the interaction between MC1R-mEmerald and BBSome proteins under the BBS2 knockdown condition. A375 MC1R-KO cells were transfected with or without BBS2 shRNAs and treated with UV/α-MSH (100 nM). Cells were treated with α-MSH for 36 h in the absence of serum after UV exposure. (D) Immunoprecipitation and immunoblotting showing the interaction between MC1R-mEmerald and endogenous BBS2 under the UV radiation condition. A375 MC1R-KO cells were transfected with MC1R-mEmerald and treated with or without 100 nM α-MSH for 36 h in the absence of serum after UV exposure. (E) Pull-down analysis of the interaction between truncated MC1Rs and BBS2. IL, intracellular loop; C, C-terminal. (F) Immunoprecipitation and immunoblotting showing the interaction of MC1R variants with BBS2. HEK293T cells were transfected with the variants of MC1R-3×Flag and BBS2-HA and immunoprecipitated with the Flag antibody. (G, H) Immunofluorescence images (G) of A375 MC1R-KO cells rescued with MC1R-mEmerald (A375 MC1R-mEmerald, green) and transfected with control or BBS2 shRNAs in the presence or absence BBS2-HA. Cells were treated with α-MSH (100 nM) for 36 h in the absence of serum after UV exposure and were stained with the Arl13b antibody (red). The percentage of ciliated cells with ciliary localization of MC1R was quantified in panel H (n = 3 independent experiments). Scale bar, 5 μm. (I) Tyrosinase activity of primary human melanocytes transfected with control or BBS2 siRNAs and treated with or without 100 nM α-MSH for 36 h in the absence of serum after UV exposure (n = 3 independent experiments). (J) Quantitative RT-PCR analysis of melanogenesis-related genes of primary human melanocytes transfected with control or BBS2 siRNAs. Cells were treated with or without 100 nM α-MSH for 36 h in the absence of serum after UV exposure (n = 3 independent experiments). (K) Immunoblot analysis of melanogenesis-related proteins of primary human melanocytes transfected with control or BBS2 siRNAs. Cells were treated with or without 100 nM α-MSH for 36 h in the absence of serum after UV exposure. GAPDH served as a control. Data are presented as mean ± SD. Statistical significance was determined by one-way ANOVA; *p < 0.05, **p < 0.01, ***p < 0.001. See also S4 Fig. The underlying data for this figure can be found in S1 Data. The uncropped gels and blots are included in S1 Raw Images. α-MSH, α-melanocyte-stimulating hormone; BBS, Bardet–Biedl syndrome; MC1R, melanocortin 1 receptor; UV, ultraviolet.
Fig 5
Fig 5. MC1R palmitoylation at C315 promotes its ciliary localization.
(A, B) Immunofluorescence images (A) of A375 MC1R-KO cells rescued with MC1R-mEmerald (green) and treated with vehicle (DMSO), 100 nM α-MSH, 100 nM α-MSH/25 μm 2-bromopalmitate (2-BP), 100 nM α-MSH/1 μm palmostatin B (PalB), or 100 nM α-MSH/100 μm PA for 36 h in the absence of serum after UV exposure. Cells were stained with the Arl13b antibody (red). The percentage of ciliated cells with ciliary localization of MC1R was quantified in panel B (n = 3 independent experiments). Scale bar, 5 μm. (C, D) Immunofluorescence images (C) of A375 MC1R-KO cells rescued with WT and C315S MC1R-mEmerald (green) and treated with UV/α-MSH (100 nM). Cells were treated with α-MSH for 36 h in the absence of serum after UV exposure. Cells were stained with the Arl13b antibody (red). The percentage of ciliated cells with ciliary localization of MC1R was quantified in panel D (n = 3 independent experiments). Scale bar, 5 μm. (E) Immunoblot analysis of MC1R in different fractions of HEK293T cells transfected with WT or C315S MC1R-3×Flag. P, pellet fraction (membrane fraction); S, soluble fraction. (F) Immunofluorescence images (left) and line scan (right) of A375 MC1R-KO cells rescued with WT and C315S MC1R-mEmerald (green) and stained with the ATP1A1 antibody (red). Scale bar, 5 μm. (G) Pearson’s colocalization analysis of MC1R and ATP1A1 for images shown in panel F. n ≥ 50 cells. (H) Binding affinity of WT and C315S MC1R to PI4P measured by the MST assay. Data are presented as mean ± SD. Statistical significance was determined by one-way ANOVA (B) or unpaired two-tailed Student’s t test (D and G); ***p < 0.001. See also S5 Fig. The underlying data for this figure can be found in S1 Data. The uncropped blots are included in S1 Raw Images. MC1R, melanocortin 1 receptor; PA, palmitic acid; UV, ultraviolet.
Fig 6
Fig 6. Cilio-MC1R induces a sustained cAMP signaling during skin pigmentation.
(A, B) Detection of ciliary cAMP levels by cilia-targeted cADDis (green) and the reference ciliary marker 5HT6-mCherry (red) in A375 MC1R-KO cells rescued with MC1R or cilio-MC1R (constructed by fusing the ciliary protein Arl13b with MC1R). Cells were pre-serum-starved for 24 h and cultured in the absence UV. Panel A shows time-lapse images of cADDis (green) and cilia (red) after the addition of 1 μm α-MSH (denoted by arrow). Then, 100 μm forskolin was added at 6 min (denoted by arrow). Scale bar, 2.5 μm. In panel B, the fluorescence intensities were normalized to the time point of −1 min (n = 5 ciliated cells from 5 independent experiments). The normalized fluorescence intensity is expressed as: (the fluorescence intensity of mCherry / the fluorescence intensity of cADDis) / (the fluorescence intensity of mCherry at −1 min / the fluorescence intensity of cADDis at −1 min). (C) Time course of total cellular cAMP levels of A375 MC1R-KO cells rescued with MC1R or cilio-MC1R upon stimulation with 1 μm α-MSH. Cells were pre-serum-starved for 24 h and cultured in the absence UV. (D) Volcano plots of differentially expressed genes in A375 MC1R-KO cells rescued with WT MC1R or cilio-MC1R. Cells were cultured in the absence of serum and UV, and treated with 100 nM α-MSH for 12 h before mRNA extraction. Genes with fold change >2 and adjusted p-value <0.05 were considered as differentially expressed. Melanogenesis-related genes were highlighted and marked on the spot. (E) Quantitative RT-PCR analysis of the indicated genes of A375 MC1R-KO cells transfected with the control vector, MC1R, or cilio-MC1R. Cell were treated with 100 nM α-MSH for 12 h before mRNA extraction (n = 3 independent experiments). Cells were cultured in the absence of serum and UV. (F) Immunoblot analysis of the indicated proteins in A375 MC1R-KO cells rescued with the control vector, MC1R, or cilio-MC1R. Cells were treated with 100 nM α-MSH for 24 h in the absence of serum and UV before lysis. GAPDH served as a control. (G, H) Immunoprecipitation and immunoblotting showing the interaction between Sox-3×Flag and MITF-HA. HEK293T cells were transfected with the indicated plasmids and immunoprecipitated with antibodies against Flag (G) and HA (H). (I) Dual-luciferase reporter assay of the pGL3-basic or DCT promoter transfected with the indicated plasmids. The relative luciferase activity was calculated as the luciferase activity normalized with the control vector (n = 3 independent experiments). (J) Tyrosinase activity of A375 MC1R-KO cells rescued with the control vector, MC1R, or cilio-MC1R. Cells were transfected with control or Sox9 shRNAs and treated with 100 nM α-MSH for 24 h in the absence of serum and UV before detection (n = 3 independent experiments). (K) Immunoblot analysis of the indicated proteins in A375 MC1R-KO cells rescued with the control vector, MC1R, or cilio-MC1R. Cells were transfected with control or Sox9 shRNAs and treated with α-MSH for 24 h in the absence of serum and UV before lysis. GAPDH served as a control. Data are presented as mean ± SD. Statistical significance was determined by unpaired two-tailed Student’s t test (B and C) or one-way ANOVA (E, I, and J); *p < 0.05, **p < 0.01, ***p < 0.001; ns, not significant. See also S6 Fig. The underlying data for this figure can be found in S1 Data. The uncropped blots are included in S1 Raw Images. α-MSH, α-melanocyte-stimulating hormone; MC1R, melanocortin 1 receptor; UV, ultraviolet.

References

    1. Tian X, Cui Z, Liu S, Zhou J, Cui R. Melanosome transport and regulation in development and disease. Pharmacol Ther. 2021;219:107707. doi: 10.1016/j.pharmthera.2020.107707 - DOI - PubMed
    1. D’Alba L, Shawkey MD. Melanosomes: Biogenesis, properties, and evolution of an ancient organelle. Physiol Rev. 2019;99(1):1–19. doi: 10.1152/physrev.00059.2017 - DOI - PubMed
    1. Le Coz M, Benmerah A, Larue L. Quiescent melanocytes form primary cilia. Exp Dermatol. 2014;23(6):426–427. doi: 10.1111/exd.12426 - DOI - PubMed
    1. Lang UE, Love NR, Cheung C, McCalmont TH, Kim J. Use of the ciliation index to distinguish invasive melanoma from associated conventional melanocytic nevi. Am J Dermatopathol. 2020;42(1):11–15. doi: 10.1097/DAD.0000000000001459 - DOI - PubMed
    1. Zingg D, Debbache J, Pena-Hernandez R, Antunes AT, Schaefer SM, Cheng PF, et al.. Ezh2-mediated primary cilium deconstruction drives metastatic melanoma formation. Cancer Cell. 2018;34(1):69–84 e14. doi: 10.1016/j.ccell.2018.06.001 - DOI - PubMed

MeSH terms

LinkOut - more resources