. 2024 Dec 2;20(12):e1011503.
doi: 10.1371/journal.pgen.1011503. eCollection 2024 Dec.

FABIO: TWAS fine-mapping to prioritize causal genes for binary traits

Affiliations

FABIO: TWAS fine-mapping to prioritize causal genes for binary traits

Haihan Zhang et al. PLoS Genet. .

Abstract

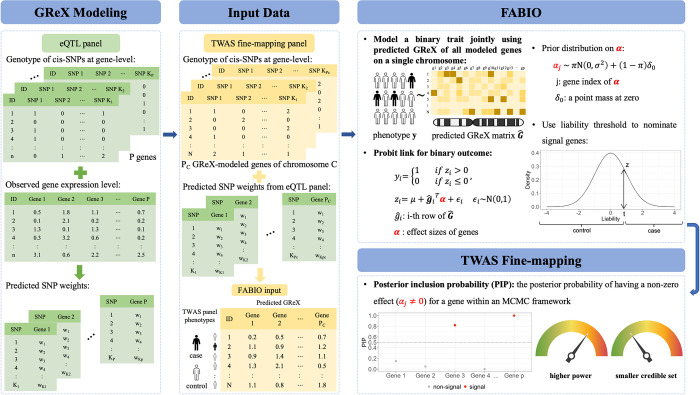
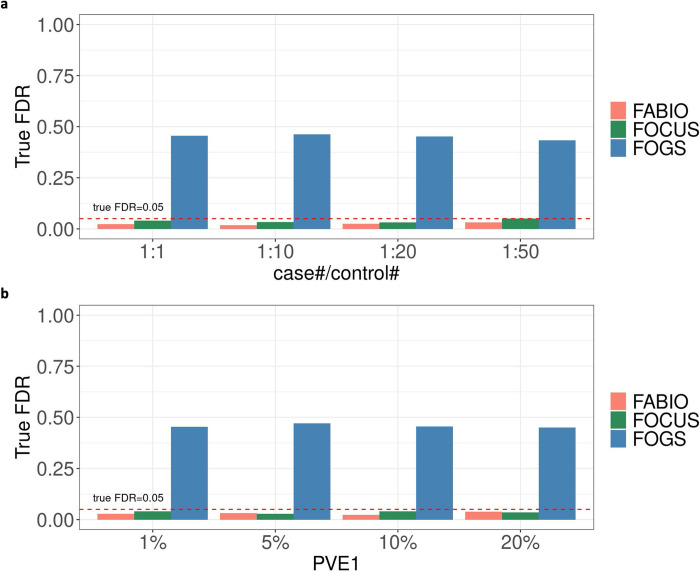
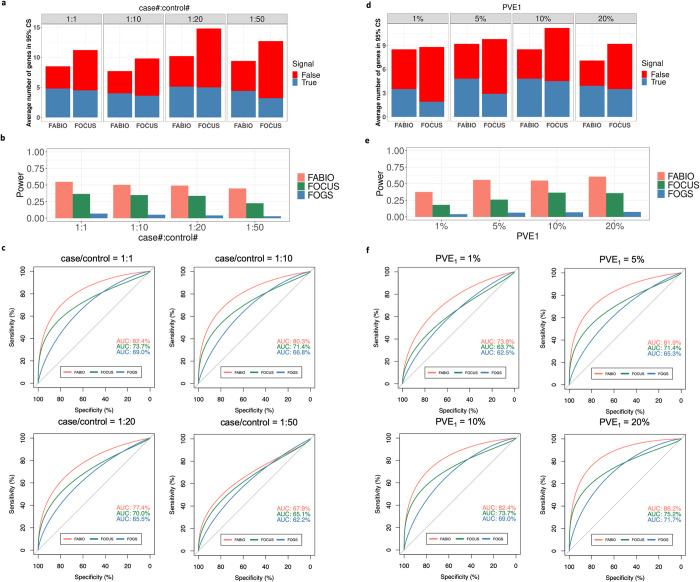
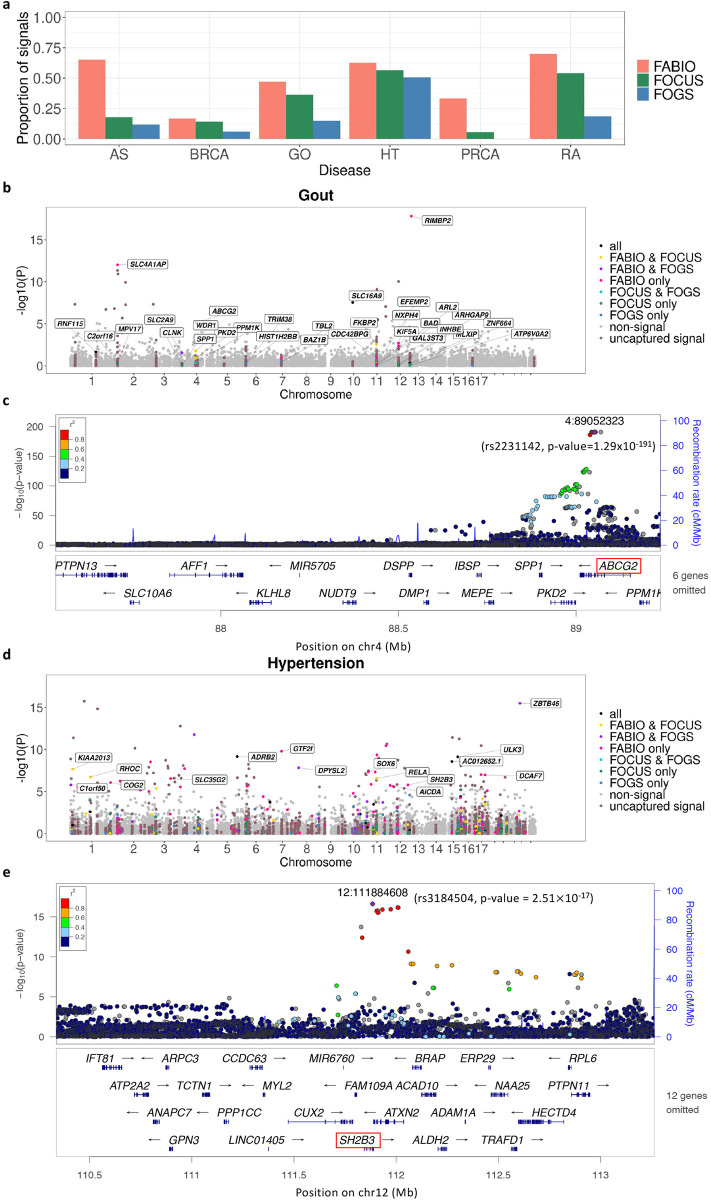
Transcriptome-wide association studies (TWAS) have emerged as a powerful tool for identifying gene-trait associations by integrating gene expression mapping studies with genome-wide association studies (GWAS). While most existing TWAS approaches focus on marginal analyses through examining one gene at a time, recent developments in TWAS fine-mapping methods enable the joint modeling of multiple genes to refine the identification of potentially causal ones. However, these fine-mapping methods have primarily focused on modeling quantitative traits and examining local genomic regions, leading to potentially suboptimal performance. Here, we present FABIO, a TWAS fine-mapping method specifically designed for binary traits that is capable of modeling all genes jointly on an entire chromosome. FABIO employs a probit model to directly link the genetically regulated expression (GReX) of genes to binary outcomes while taking into account the GReX correlation among all genes residing on a chromosome. As a result, FABIO effectively controls false discoveries while offering substantial power gains over existing TWAS fine-mapping approaches. We performed extensive simulations to evaluate the performance of FABIO and applied it for in-depth analyses of six binary disease traits in the UK Biobank. In the real datasets, FABIO significantly reduced the size of the causal gene sets by 27.9%-36.9% over existing approaches across traits. Leveraging its improved power, FABIO successfully prioritized multiple potentially causal genes associated with the diseases, including GATA3 for asthma, ABCG2 for gout, and SH2B3 for hypertension. Overall, FABIO represents an effective tool for TWAS fine-mapping of disease traits.


Conflict of interest statement

I have read the journal’s policy and the authors of this manuscript have the following competing interests: L.C.T has received support from Galderma and Janssen.

Figures

Fig 1
Fig 1. Schematic overview of FABIO for TWAS fine-mapping of binary outcomes.
Same as other existing methods, as a two-step TWAS fine-mapping approach, FABIO requires predicted GReX of the study cohort generated using the standard method like PrediXcan or BSLMM. Shown under the “GReX Modeling” and “Input Data” section, SNP weights are first estimated from the eQTL mapping cohort (sample size = n) with known genotypes and gene expression levels, then the predicted GReX will be generated in the study cohort (sample size = N, usually N > n), using known genotypes and estimated SNP weights. Shown under the “FABIO” section, FABIO explicitly models the binary nature of the outcome trait through a latent variable z with a sparsity inducing prior on each element of the gene effect sizes α. It also simultaneously models all genes on a single chromosome to account for the GReX correlation both within and between LD blocks, through the input of individual-level GReX matrix. We apply MCMC method to estimate the model parameters and obtain test statistic for each gene effect size αi, and use the posterior inclusion probability (PIP) as the evidence for the gene’s association with the binary outcome trait (“TWAS Fine-mapping” section). * Icons used in this figure are from BioRender.com.
Fig 2
Fig 2. True FDR at an estimated FDR threshold of 0.05 under different conditions.
The red dashed line indicates a true FDR of 0.05. (a) Under different case/control ratios. (b) Under different percentages of PVE1.
Fig 3
Fig 3. Performance of different methods in simulations with the change of case/control ratio or PVE1.
(a) Average number of genes in 95% credible set (CS) defined by FABIO or FOCUS and the number of true signal genes in 95% CS under different case/control ratios. (b) Power comparison for different methods based on a true false discovery rate (FDR) of 0.05 under different case/control ratios. (c) ROC curves of different methods with AUCs recorded under different case/control ratios. (d) Average number of genes in 95% credible set (CS) defined by FABIO or FOCUS and the number of true signal genes in 95% CS under different PVE1. (e) Power comparison for different methods based on a true false discovery rate (FDR) of 0.05 under different PVE1. (f) ROC curves of different methods with AUCs recorded under different PVE1.
Fig 4
Fig 4
(a) Proportion of identified signal genes that locate in risk regions for the six diseases. Highlighted genes identified in TWAS fine-mapping analysis are labeled in black boxes in (b) and (d). Each gene is represented as a dot with x-axis indicating its genomic location and y-axis indicating its -log10 of p-value in the marginal TWAS association test. The dot of each gene is then colored based on different categories: (1) only identified by FABIO; (2) only identified by FOCUS; (3) only identified by FOGS; (4) identified by both FABIO and FOCUS; (5) identified by both FABIO and FOGS; (6) identified by both FOCUS and FOGS; (7) identified by all three methods; (8) located in a known risk region but missed by all three methods (uncaptured signal); (9) a gene shown no significance in both TWAS and GWAS analyses (non-signal). (b) TWAS Manhattan plot of gout. (c) LocusZoom plot of the corresponding LD block with the GWAS p-value of the SNP rs2231142 in ABCG2 for gout. (d) TWAS Manhattan plot of hypertension. (e) LocusZoom plot of the corresponding LD block with the GWAS p-value of the SNP rs3184504 in SH2B3 for hypertension.

Similar articles

Cited by

References

    1. Gusev A, Ko A, Shi H, Bhatia G, Chung W, Penninx BW, et al.. Integrative approaches for large-scale transcriptome-wide association studies. Nature genetics. 2016. Mar;48(3):245–52. doi: 10.1038/ng.3506 - DOI - PMC - PubMed
    1. Gamazon ER, Wheeler HE, Shah KP, Mozaffari SV, Aquino-Michaels K, Carroll RJ, et al.. A gene-based association method for mapping traits using reference transcriptome data. Nature genetics. 2015. Sep;47(9):1091–8. doi: 10.1038/ng.3367 - DOI - PMC - PubMed
    1. Zhu Z, Zhang F, Hu H, Bakshi A, Robinson MR, Powell JE, et al.. Integration of summary data from GWAS and eQTL studies predicts complex trait gene targets. Nature genetics. 2016. May;48(5):481–7. doi: 10.1038/ng.3538 - DOI - PubMed
    1. Mancuso N, Freund MK, Johnson R, Shi H, Kichaev G, Gusev A, et al.. Probabilistic fine-mapping of transcriptome-wide association studies. Nature genetics. 2019. Apr;51(4):675–82. doi: 10.1038/s41588-019-0367-1 - DOI - PMC - PubMed
    1. Wainberg M, Sinnott-Armstrong N, Mancuso N, Barbeira AN, Knowles DA, Golan D, et al.. Opportunities and challenges for transcriptome-wide association studies. Nature genetics. 2019. Apr;51(4):592–9. doi: 10.1038/s41588-019-0385-z - DOI - PMC - PubMed

Substances

LinkOut - more resources