. 2024 Dec 11;24(49):15607-15614.
doi: 10.1021/acs.nanolett.4c04004. Epub 2024 Dec 2.

The Role of Glycocalyx Diversity and Thickness for Nanoparticle Internalization in M1-/M2-like Macrophages

Affiliations

The Role of Glycocalyx Diversity and Thickness for Nanoparticle Internalization in M1-/M2-like Macrophages

Yu Liu et al. Nano Lett. .

Abstract

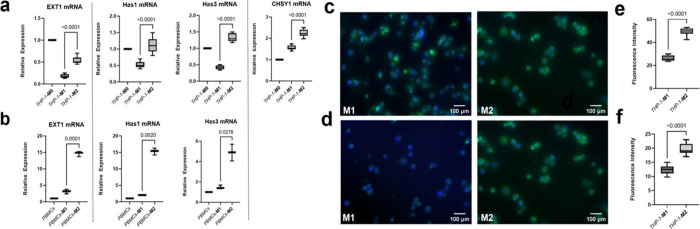
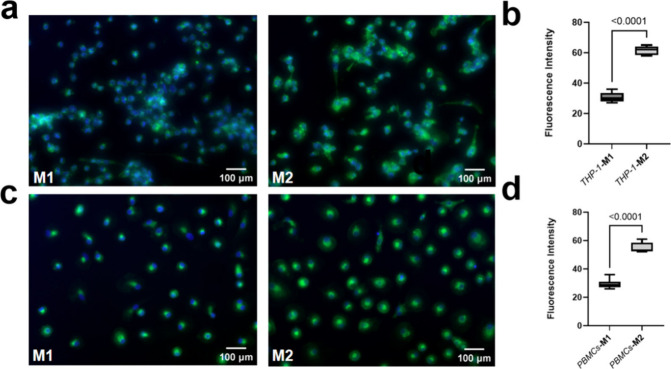
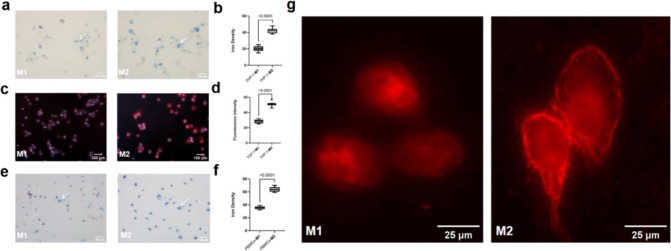
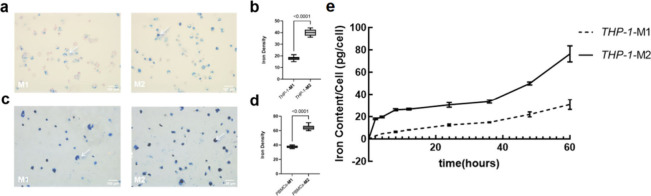
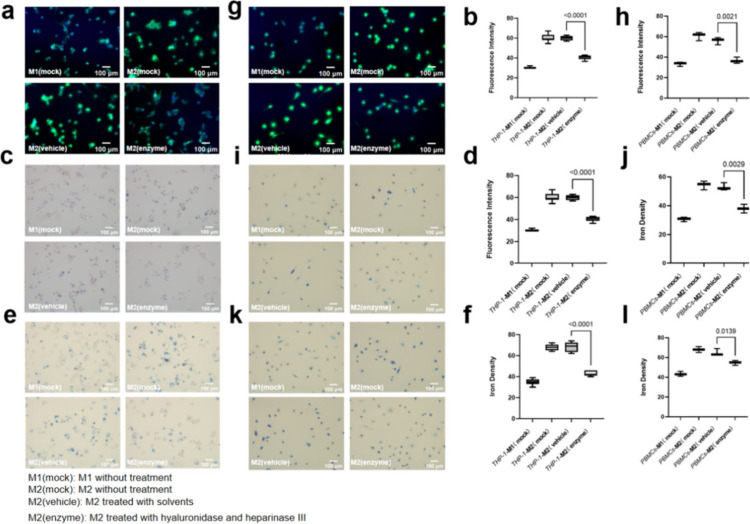
Very small superparamagnetic iron oxide nanoparticles (VSOPs) show diagnostic value in multiple diseases as a promising MRI contrast agent. Macrophages predominantly ingest VSOPs, but the mechanism remains unclear. This study identifies differences in VSOP uptake between pro-inflammatory M1 and anti-inflammatory M2 macrophages and explores the role of the pericellular glycocalyx. Glycosaminoglycans (GAG) synthesis activities and the pericellular glycocalyx for M1/M2-like macrophages were assessed by RT-qPCR, Click-iT reaction, and WGA-FITC staining. The uptake of europium-VSOP and Synomag by the two subtypes was measured using Prussian blue staining, fluorescent microscopy, and magnetic particle spectroscopy. The findings revealed that M2-like macrophages had higher GAG synthesis activity, a thicker glycocalyx, and increased nanoparticle uptake compared to M1-like macrophages. Enzymatic glycocalyx degradation significantly decreased nanoparticle uptake. This study demonstrates a positive correlation between glycocalyx and nanoparticle uptake that could be exploited for imaging and targeted therapy, particularly in cancer, where macrophage subtypes play distinct roles.

Keywords: M1/M2 macrophages; SPION; VSOP; glycocalyx; nanoparticles uptake.


Conflict of interest statement

The authors declare no competing financial interest.

Figures

Figure 1
Figure 1
GAG synthesis activities were increased in M2-like macrophages compared with M1-like macrophages. The Whisker plots show the elevated expression of the GAGs synthesis regulatory genes in M2-like macrophages compared with M1-like macrophages derived from THP-1 cells (a) (n = 9) and PBMCs (b) (n = 3). Data were presented as mean ± SD. Two-tailed Student’s t test was performed for (a) and (b). Compared with M1-like macrophages derived from THP-1 cells, M2-like macrophages showed more potent uptake of metabolic substrates GalNAz (c) and GlcNAz (d). The green fluorescence intensity was quantified with ImageJ and made a comparison (e, f) (for (e) and (f), n = 9). Data were presented as mean ± SD. Two-tailed Student’s t test was performed for (e) and (f).
Figure 2
Figure 2
|The pericellular glycocalyx layer is thicker on M2-like compared with M1-like macrophages. M2-like macrophages reveal thicker pericellular glycocalyx compared with M1-like macrophages derived from THP-1 cells (a) and PBMCs (c). The green fluorescence intensity was quantified with ImageJ and made a comparison (b, d) (for (b), n = 9; for (d), n = 3). Data were presented as mean ± SD. Two-tailed Student’s t test was performed for (b) and (d).
Figure 3
Figure 3
The EU-VSOP ingestion increased in M2-like macrophages compared with M1-like macrophages. M2-like macrophages ingested more EU-VSOP compared with M1-like macrophages derived with THP-1 cells (a) and PBMCs (e) validated by Prussian blue staining. It was confirmed with fluorescent microscopy for the macrophages derived from THP-1 cells (c). The iron density and red fluorescence intensity was quantified with ImageJ (b, d, and f) (for (b) and (d), n = 9; for (f), n = 3). The arrows point to the Prussian blue staining indicating iron content (a, e). The bright circular structure around M2-like macrophages is assumed to be glycocalyx with aggregated EU-VSOP, this structure did not appear on M1-like macrophages (g). Data were presented as mean ± SD. Two-tailed Student’s t test was performed for (b), (d), and (f).
Figure 4
Figure 4
The Synomag internalization increased in M2-like macrophages compared with M1-like macrophages. M2-like macrophages ingested more Synomag compared with M1-like macrophages derived with THP-1 cells (a) and PBMCs (c) validated by Prussian blue staining. The arrows point to the Prussian blue staining indicating iron content (a, c). The iron density was quantified with ImageJ (b, d). Increased and faster uptake was observed in M2-like macrophages compared with M1-like macrophages derived from THP-1 cells through the dynamic uptake determination with MPS (e). (for (b), n = 9; for (d) and (e), n = 3). Data were presented as mean ± SD. Two-tailed Student’s t test was performed for (b), (d), and (e).
Figure 5
Figure 5
Digestion of glycocalyx with hyaluronidase and heparinase III reduced the nanoparticle internalization in M2-like macrophages. M1 and M2 derived from THP-1 cells (a) and PBMCs (g) were treated with hyaluronidase and heparinase III and then were stained with WGA-FITC and Hoechst33254, and the green fluorescence intensity was quantified with ImageJ (b, h). M1 and M2 derived from THP-1 cells and PBMCs were treated with hyaluronidase and heparinase III and then incubated with EU-VSOP for 48 h and the iron content was measured with Prussian blue staining (c, (i), then the iron density was quantified with ImageJ and made a comparison (d, j). M1 and M2 derived from THP-1 cells and PBMCs were treated with hyaluronidase and heparinase III and then incubated with Synomag for 48 h and the iron content was measured with Prussian blue staining (e, k), then the iron density was quantified with ImageJ and made a comparison (f, l). (for b, d and f, n = 9; for h, j and l, n = 3). Data were presented as mean ± SD. Two-tailed Student’s t test was performed for b, d, f, h, j and l.

References

    1. Wei H.; Hu Y.; Wang J.; Gao X.; Qian X.; Tang M. Superparamagnetic Iron Oxide Nanoparticles: Cytotoxicity, Metabolism, and Cellular Behavior in Biomedicine Applications. Int. J. Nanomedicine 2021, 16, 6097–6113. 10.2147/IJN.S321984. - DOI - PMC - PubMed
    1. Zhou Y.; Dai Z. New Strategies in the Design of Nanomedicines to Oppose Uptake by the Mononuclear Phagocyte System and Enhance Cancer Therapeutic Efficacy. Chem. - Asian J. 2018, 13 (22), 3333–3340. 10.1002/asia.201800149. - DOI - PubMed
    1. Cheng M. J.; Mitra R.; Okorafor C. C.; Nersesyan A. A.; Harding I. C.; Bal N. N.; Kumar R.; Jo H.; Sridhar S.; Ebong E. E. Targeted Intravenous Nanoparticle Delivery: Role of Flow and Endothelial Glycocalyx Integrity. Ann. Biomed. Eng. 2020, 48 (7), 1941–1954. 10.1007/s10439-020-02474-4. - DOI - PMC - PubMed
    1. Savic L. J.; Schobert I. T.; Peters D.; Walsh J. J.; Laage-Gaupp F. M.; Hamm C. A.; Tritz N.; Doemel L. A.; Lin M.; Sinusas A.; Schlachter T.; Duncan J. S.; Hyder F.; Coman D.; Chapiro J. Molecular Imaging of Extracellular Tumor pH to Reveal Effects of Locoregional Therapy on Liver Cancer Microenvironment. Clin. Cancer Res. 2020, 26 (2), 428–438. 10.1158/1078-0432.CCR-19-1702. - DOI - PMC - PubMed
    1. Savic L. J.; Doemel L. A.; Schobert I. T.; Montgomery R. R.; Joshi N.; Walsh J. J.; Santana J.; Pekurovsky V.; Zhang X.; Lin M.; Adam L.; Boustani A.; Duncan J.; Leng L.; Bucala R. J.; Goldberg S. N.; Hyder F.; Coman D.; Chapiro J. Molecular MRI of the Immuno-Metabolic Interplay in a Rabbit Liver Tumor Model: A Biomarker for Resistance Mechanisms in Tumor-Targeted Therapy?. Radiology 2020, 296 (3), 575–583. 10.1148/radiol.2020200373. - DOI - PMC - PubMed

Publication types

LinkOut - more resources