. 2024 Dec 2;12(12):e010208.
doi: 10.1136/jitc-2024-010208.

Integrating binding affinity and tonic signaling enables a rational CAR design for augmented T cell function

Affiliations

Integrating binding affinity and tonic signaling enables a rational CAR design for augmented T cell function

Markus Barden et al. J Immunother Cancer. .

Abstract

Background: The success of chimeric antigen receptor (CAR) T cell therapy for hematological malignancies has not yet translated into long-term elimination of solid tumors indicating the need for adequately tuning CAR T cell functionality.

Methods: We leveraged a translational pipeline including biophysical characterization and structural prediction of the CAR binding moiety, evaluation of cellular avidity, synapse formation, T cell motility, and functional capacities under repetitive target challenge and in sustained tumor control.

Results: As an example of clinical relevance, we derived a panel of anti-Her2 CARs covering a 4-log affinity range, all expected to target the same Her2 epitope. The same scFv mutations increased both antigen-specific affinity, cellular avidity, and antigen-independent "tonic" signaling; above a minimum threshold, raise in affinity translated into functional avidity in a non-linear fashion. In this case, replacement by amino acids of higher hydrophobicity within the scFv coincidentally augmented affinity, non-specific binding, spontaneous CAR clustering, and tonic signaling, all together relating to T cell functionality in an integrated fashion.

Conclusions: Data emphasize that tonic signaling is not always due to the positive charge but can be driven by hydrophobic interactions of the scFv. CAR binding affinity above the threshold and tonic signaling are required for sustained T cell functionality in antigen rechallenge and long-term tumor control.

Keywords: Chimeric antigen receptor - CAR; Immunotherapy; T cell.


Conflict of interest statement

Competing interests: No, there are no competing interests.

Figures

Figure 1
Figure 1. Primary functional capacities of C6.5 derived CAR T cells. (A) Affinities of Her2-specific C6.5 scFv mutants as previously determined by surface plasmon resonance (SPR) using BIAcore. (B) scFvs were integrated into a second generation CAR harboring a human IgG1 hinge, CD28 transmembrane and costimulatory, and CD3 signaling domain. CAR expression level on human peripheral blood T cells was assessed by flow cytometry; data represent the geometric mean of the mean fluorescent intensity (MFI) for n=3 donors. CAR graphics: Created in BioRender. Abken, H. (2024) https://BioRender.com/y88w452. 1×10⁵ T cells were co-incubated with 2×10⁴ Her2medium LS174T cells (C, E, G, I, K) or 2×10⁴ Her2high SKOV3 cells (D, F, H, J, L). (C, D) CAR-mediated T cell activation strength was evaluated by the Jurkat-Lucia NFAT reporter cell line engineered with the respective Her2 CAR at similar CAR expression levels. Bioluminescence was recorded as relative light units (RLU) after 20 hours of co-incubation with the respective Her2+ target cells. Data represent means±SD of n=4 (C) or n=3 (D) independent experiments. (E, F) CD8+ CAR+ T cell proliferation was monitored by recording proliferation dye eFluorTM 450 dilution after 5 days of co-culture with target cells. (G, H) CD8+ CAR+ T cell subsets after 72 hours of co-culture were determined by flow cytometry (naïve: CD45RO CD62L+; CM: CD45RO+ CD62L+; EM: CD45RO+ CD62L; E: CD45RO CD62L). (I, J) FASL expression after 72 hours of co-culture of CD8+ CARhigh CD45RO+ CD62L+ CAR+ T cells with target cells. (K, L) Annexin V staining after 72 hours of co-culture of CD8+ CAR+ T cells with target cells. Annexin V MFI for each CAR T cell was normalized to the mean MFI of each individual donor. Data represent means±SD of n≥3 donors. One-way analysis of variance was performed with Tukey‘s multiple comparison correction. ns (not significant); *p<0.05; **p<0.01; ***p<0.001; ****p<0.0001. CM, central memory; E, effector; EM, effector memory.
Figure 2
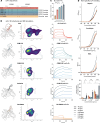
Figure 2. C6.5 derived scFv variants with different affinities differ in their antigen-specific and antigen-independent binding properties. (A) Sequences of the Her2-specific C6.5 scFv mutants previously generated by site-directed mutagenesis. (B) Conformations of VH CDR3 loops of the C6.5 derived scFv panel were evaluated by MD simulation and PCA to analyze conformational states of the loop. (C) scFv binding kinetics were characterized in BLI and are shown as association and dissociation of Her2 protein to/from the immobilized scFv. One representative of a total of three independent experiments is shown. The maximum response is represented as a parameter for affinity. Data represent mean±SD of n=3. (D) ELISA-based quantification of Her2 independent scFv binding to plate-coated irrelevant antigens heparin, cardiolipin, and bovine serum albumin (BSA). One representative of n=3 is shown. Binding to BSA is shown relative to Her2-specific binding. Data represent mean±SD of n=3. One-way analysis of variance was performed with Tukey‘s multiple comparison test. *p<0.05; **p<0.01; ***p<0.001; ****p<0.0001. BLI, biolayer interferometry; MD, molecular dynamic; PCA, principal component analysis.
Figure 3
Figure 3. Non-linear correlation between scFv affinity and CAR T cell avidity. (A) The expression levels of Her2 CARs and of the CD30 CAR of irrelevant specificity on engineered T cells; data represent the geometric mean of the mean fluorescence intensity (MFI), n=3 donors. CAR graphics (A,G): Created in BioRender. Abken, H. (2024) https://BioRender.com/y88w452. (B) CAR T cell binding force on a Her2high SKOV3 cell monolayer as determined by z-Movi avidity analysis. Graphics: Created in BioRender. Abken, H. (2024) https://BioRender.com/b81y849.(C) Force ramp applied after 5 min CAR T cell co-incubation with SKOV3 cells. Detachment curve of CAR T cells displayed as mean values of n=3 technical replicates (3 runs on 3 different chips per experimental group), data for one representative donor are shown. (D) Collated data of n=3 technical replicates of n=3 donors (n=9 runs on n=9 chips total per experimental group); data represent the percentage of T cells bound at plateau force. (E) Soluble Her2 protein at increasing concentration was added to Her2 CAR (C6MH3-B1) and CD30 CAR T cells; data represent the percentage of CAR T cells at the end of force ramp±SD, n=3 technical replicates (n=1 donor). Graphics: Created in BioRender. Barden, M. (2024) https://BioRender.com/q55q213.(F) Percentage of CAR T cells bound after 2, 5, 20, and 40 min; representative data for 1 out of 3 donors are displayed. (G–I) T cells were engineered with the CAR-GFP CAR, incubated on Her2 coated plates, and imaged by TIRF microscopy. (I) Data show the mean fluorescence signal per single cell in the contact region with Her2 after 40 min, n≥30 cells for one donor. Wilcoxon-Mann-Whitney test was performed. (J) Mean CAR T cell motility measured by timelapse-live video (TLLV) microscopy over a time-course of 12.5 hours, n=3 donors. Box plots display IQR and median. One-way ANOVA with post hoc Tukey’s HSD test was performed to identify significant group differences. (A, D, J). ns (not significant); *p<0.05; **p<0.01; ***p<0.001; ****p<0.0001. ANOVA, analysis of variance; HSD, honestly significant difference; TIRF, total internal reflection fluorescence.
Figure 4
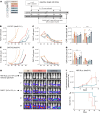
Figure 4. High affinity Her2 CAR T cells provide a prolonged antitumor response in vitro and in vivo. CAR graphics: Created in BioRender. Abken, H. (2024) https://BioRender.com/y88w452. (A) Her2 CAR T cells (1×10⁵) and control CAR T cells of irrelevant specificity (CD19 CAR) were repetitively stimulated with Her2medium LS174T or Her2high SKOV3 cells (2×10⁴) until cancer cell outgrowth (R6 and R5). After each round of co-culture (ie, after 3 or 4 days), 10% of culture volume was removed for flow cytometric quantitation of cell numbers and CAR surface expression. (B) Frequencies of LS174T cells, (C) CAR T cells co-cultured with LS174T cells, (E) SKOV3 cells, (F) CAR T cells co-cultured with SKOV3 cells were determined by flow cytometry using counting beads. Data represent mean values of n=3 healthy T cell donors. (D, G) CAR molecules per cell were estimated by flow cytometry using PE quantitation beads. Data represent mean±SD of n=3 healthy donors. (H) NSG mice were s.c. injected with Her2high N87.ffLuc (3×10⁶) cells. On day 14 mice received one intravenous dose of non-modified T cells (NT) (5×10⁵, n=3, beige line), or C6.5 scFv CAR T cells (5×10⁵, n=5, pink line), or C6-B1D2 scFv CAR T cells (5×10⁵, n=5, grey-blue line). Bioluminescence imaging was performed weekly. (I) Tumor growth was monitored by luminescence intensity recording (photons/s/cm2/sr). Graphs represent mean values±SD. (J) Percent survival of mice is shown as Kaplan-Meyer curve; Log-rank (Mantel-Cox) test was applied for analysis. Two-way ANOVA (D, G) or one-way ANOVA (I) was performed with Tukey‘s (D, G) or Bonferroni‘s (I) multiple comparison correction. *p<0.05; **p<0.01; ***p<0.001; ****p<0.0001. ANOVA, analysis of variance.
Figure 5
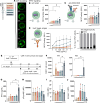
Figure 5. C6-B1D2 scFv CAR clustering and tonic NFAT signaling enhances CAR T cell persistence in the absence of target antigen. (A) CAR clustering was analyzed by confocal imaging of unstimulated CAR-GFP engineered SupT1 cells (n=15). (B–D) CAR mediated T cell activation strength was evaluated by the Jurkat-Lucia NFAT reporter cell line transduced with the respective Her2 CAR and expressed at similar CAR levels. Bioluminescence readout was performed after 20 hours of co-incubation. Data represent means±SD of n=4 (C) or n=3 (D) independent experiments. 1×10⁶ CAR T cells were incubated (B) without stimulation, (C) with anti-CD3 and anti-CD28 antibody stimulation, (D) or with increasing concentrations of plate-coated Her2 protein. Percentages of tonic and antigen-specific signals were calculated based on maximum NFAT value in the entire experiment. (E, F) 1×10⁶ CAR T cells were incubated without antigen. Every 3 days, 20% of the culture volume was taken for flow cytometric recording of T cell counts. (G) IFN-γ was measured by ELISA after 24 hours of co-incubation of CAR T cells with target cells. Data represent means±SD of n=2 donors. (H) CD8+ CAR+ T cell proliferation was evaluated by proliferation dye eFluor 450 dilution after 72 hours co-culture. (I) FASL was recorded after 72 hours co-culture CD8+ CARhigh CD45RO+ CD62L+ CAR+ T cells. (J) Annexin V staining after 72 hours co-culture of CD8+ CAR+ T cells. CAR graphics: Created in BioRender. Abken, H. (2024) https://BioRender.com/y88w452.CAR T cell graphics (B-D): Created in BioRender. Abken, H. (2024) https://BioRender.com/k79o277.. Data represent means±SD of n≥3 donors. One-way ANOVA was performed with Tukey‘s multiple comparison correction (B–E). ns (not significant); *p<0.05. ANOVA, analysis of variance.
Figure 6
Figure 6. Antigen-independent CAR signaling leads to expansion of CD4+ CAR T cells and allows for combinatorial signaling. CAR T cell graphics: Created in BioRender. Abken, H. (2024) https://BioRender.com/p11r349.(A) Anti-IgG crosslinking induced T cell activation strength was evaluated by the Jurkat-Lucia NFAT reporter cell line transduced with the respective Her2 CAR and expressed at similar CAR levels. Bioluminescence readout was performed after 20 hours of co-incubation. Data represent means±SD of n=3 independent experiments. Based on figure 6A data, we selected the anti-IgG antibody concentrations used in the CAR T cell survival determination (figure 6B–F) and for the combined antigen-triggered and antigen-independent activation (figure 6G–I). (B–F) T cells with C6.5 scFv CAR and C6-B1D2 scFv CAR, respectively, (1×10⁶ CAR+ T cells/well) were incubated on a 96-well plate over four rounds (3–4 days each round). CARs were antigen-independently crosslinked by a plate-coated anti-IgG antibody that binds to the extracellular IgG1 spacer. CD4+ CAR T cell counts (C, E) and CD8+ CAR T cell counts (D, F) were recorded by flow cytometry using counting beads. CAR T cell counts after round 4 (R4) are displayed. (G–I) CAR mediated T cell activation strength was evaluated by the Jurkat-Lucia NFAT reporter cell line engineered with the respective Her2 CAR and expressed at similar CAR levels. Bioluminescence was recorded after 20 hours of coincubation. 1×10⁶ CAR T cells were incubated with increasing concentrations of plate-coated Her2 protein with or without anti-IgG antibody. Data represent means±SD of n≥2 independent experiments. Statistical calculation was done by ANOVA with Tukey‘s multiple comparison correction. *p<0.05. ANOVA, analysis of variance.

References

    1. Good CR, Aznar MA, Kuramitsu S, et al. An NK-like CAR T cell transition in CAR T cell dysfunction. Cell. 2021;184:6081–100. doi: 10.1016/j.cell.2021.11.016. - DOI - PMC - PubMed
    1. Mezősi-Csaplár M, Szöőr Á, Vereb G. CD28 and 41BB Costimulatory Domains Alone or in Combination Differentially Influence Cell Surface Dynamics and Organization of Chimeric Antigen Receptors and Early Activation of CAR T Cells. Cancers (Basel) 2023;15:3081. doi: 10.3390/cancers15123081. - DOI - PMC - PubMed
    1. Mao R, Kong W, He Y. The affinity of antigen-binding domain on the antitumor efficacy of CAR T cells: Moderate is better. Front Immunol. 2022;13:1032403. doi: 10.3389/fimmu.2022.1032403. - DOI - PMC - PubMed
    1. Rodriguez-Marquez P, Calleja-Cervantes ME, Serrano G, et al. CAR density influences antitumoral efficacy of BCMA CAR T cells and correlates with clinical outcome. Sci Adv. 2022;8:eabo0514. doi: 10.1126/sciadv.abo0514. - DOI - PMC - PubMed
    1. Greenman R, Pizem Y, Haus-Cohen M, et al. Shaping Functional Avidity of CAR T Cells: Affinity, Avidity, and Antigen Density That Regulate Response. Mol Cancer Ther. 2021;20:872–84. doi: 10.1158/1535-7163.MCT-19-1109. - DOI - PubMed

LinkOut - more resources