Meta-Analysis
. 2024 Dec 2;15(1):10491.
doi: 10.1038/s41467-024-54729-6.

Single nucleotide polymorphisms are associated with strain-specific virulence differences among clinical isolates of Cryptococcus neoformans

Affiliations
Meta-Analysis

Single nucleotide polymorphisms are associated with strain-specific virulence differences among clinical isolates of Cryptococcus neoformans

Katrina M Jackson et al. Nat Commun. .

Erratum in

Abstract

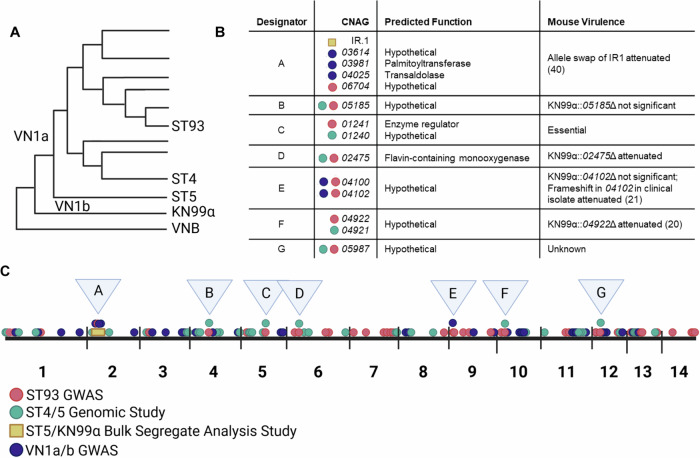
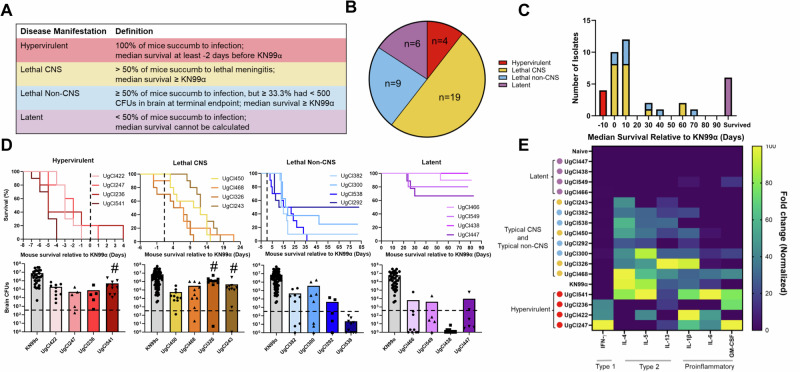
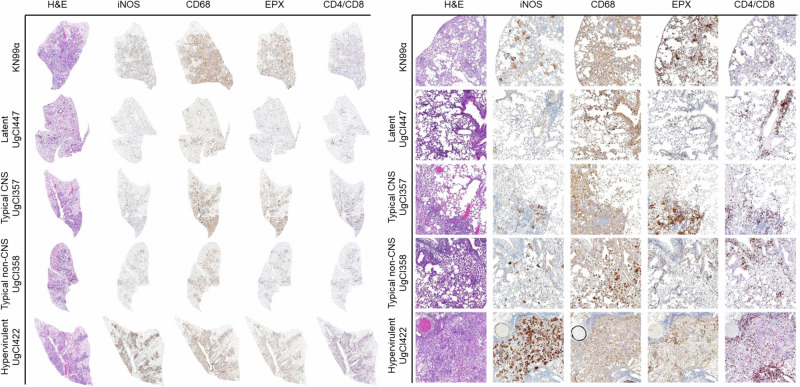
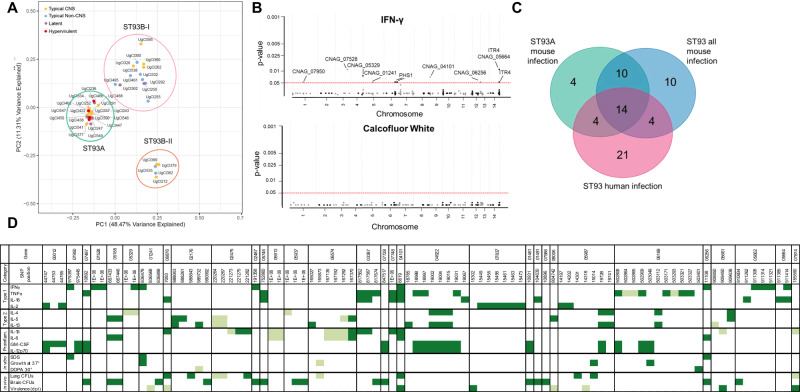
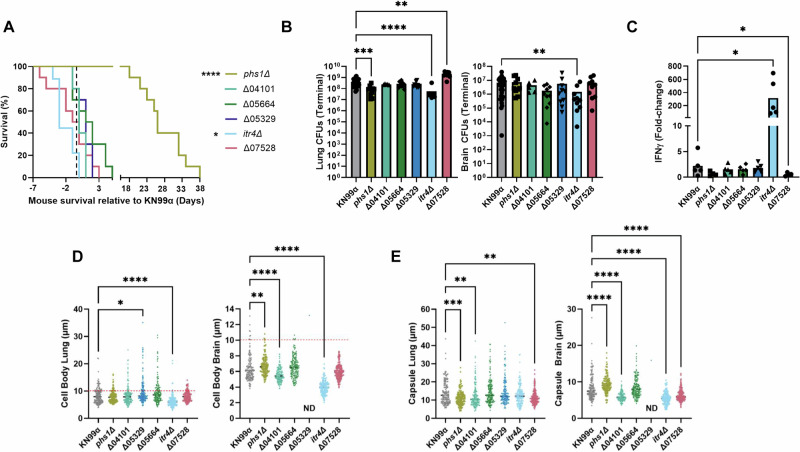
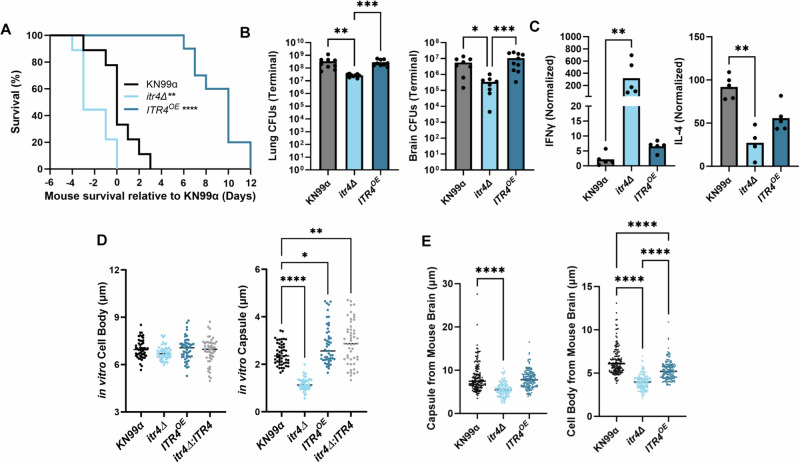
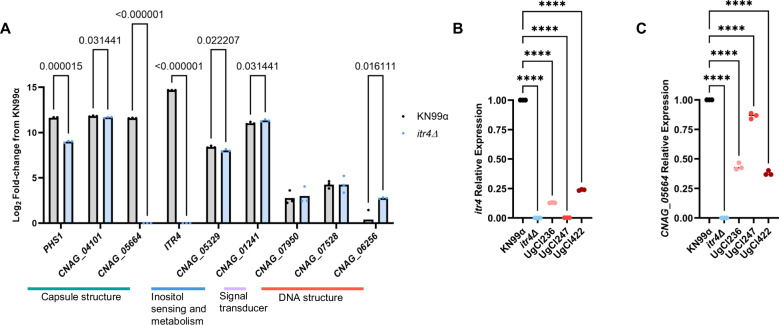
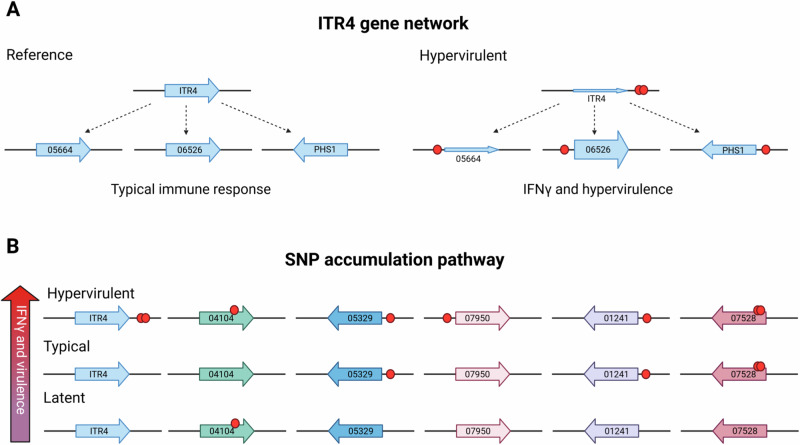
Studies across various pathogens highlight the importance of pathogen genetic differences in disease manifestation. In the human fungal pathogen Cryptococcus neoformans, sequence type (ST) associates with patient outcome. We performed a meta-analysis of four genomic studies and identified overlapping gene regions associated with virulence, suggesting the importance of these gene regions in cryptococcal disease in diverse clinical isolates. We explored the relationship between virulence and strain genetic differences using the cryptococcosis mouse model and a closely related library of ST93 clinical isolates. We identified four in vivo virulence phenotypes: hypervirulence, typical virulence with CNS disease, typical virulence with non-CNS disease, and latent disease. Hypervirulent isolates were clade specific and associated with an interferon gamma (IFNγ) dominated immune response. Using a genome wide association study (GWAS), we identified nine genes with polymorphisms associated with IFNγ production, including the inositol sensor ITR4. The itr4Δ mutant recapitulated the hypervirulence phenotype and ITR4 affects expression of two IFNγ associated genes. Finally, we showed that IFNγ production is associated with SNPs that downregulate ITR4 and with SNP accumulation in other IFNγ associated genes. These data highlight the complex role of pathogen genetics in virulence and identify genes associated with hypervirulence and IFNγ in Cryptococcus neoformans.


Conflict of interest statement

Competing interests: The authors declare no competing interests.

Figures

Fig. 1
Fig. 1. A comparison of four genetic studies reveals overlapping genomic regions associated with virulence.
A literature search was performed to identify C. neoformans genomic studies and the results from each study were compared. A Studies used isolates from ST93, ST4 and ST5,, and VN1a and VN1b. B, C Overlapping genomic regions, designated A-G, contained genes identified in multiple studies. Genes or gene regions identified in at least two studies are highlighted. Figure made with BioRendor.
Fig. 2
Fig. 2. Mice infected with clinical isolates showed four distinct disease manifestations that associated with immune response.
5–10 mice were infected with each clinical isolate and monitored for 100 days. A Disease manifestation was categorized based on survival relative to KN99α controls and CFUs in the brain. B Lethal CNS was the most prevalent disease manifestation, followed by lethal non-CNS, then latent, with the hypervirulent manifestation accounting for 10% of isolates. C Histogram displaying the median survival of the 38 clinical isolates relative to KN99α. Color codes as in (B). D Top panel: four representative isolates are shown for each disease manifestation. The survival curves were normalized to an infection-matched KN99α control with the black dotted line indicating KN99α median survival (n = 5–10 mice). Bottom panel: Mouse CFUs in brains at terminal endpoint, or at 100 days post infection for latent isolates. Significance was determined using Kruskal–Wallis nonparametric test with Dunn’s multiple comparison correction (n = 5–10 mice; exact p-values from left to right; Hypervirulent: 0.0045, 0.0050, 0.0020, Typical CNS: <0.0001, 0.0024, Typical Non-CNS: 0.0006, 0.0067, 0.0039, <0.0001, Latent: <0.0001, 0.0207, <0.0001, 0.0182). # indicates isolates that are not significantly different from the KN99α control. E Normalized and scaled cytokine fold-change data. The fold-change from an uninfected control mouse was determined for each cytokine. The heatmap was populated with cytokines that had a significant increase compared to the naïve control. Significance was determined using a Kruskal–Wallis nonparametric test without Dunn’s multiple comparison correction. Sample clustering was performed using an average clustering linkage method and Euclidean distance measurement. The clustered heatmap was normalized by column and the highest value for each cytokine was assigned a value of 100 and the lowest amount 0. Yellow indicates the greatest fold-change from naïve control for that cytokine and blue indicates the lowest fold-change. Four representative samples from each disease manifestation are shown. Latent isolates (purple) clustered with the uninfected control and showed a mostly undetectable immune response. Lethal CNS (yellow) and lethal non-CNS (blue) isolates showed a type-2 immune response, with increases in IL-4, IL-5, and IL-13, and clustered with KN99α. Hypervirulent isolates (red) showed an increase in the type-1 cytokine IFNγ and/or the proinflammatory cytokines, IL-1β, IL-6, and GM-CSF. Source data are provided as a Source Data file.
Fig. 3
Fig. 3. Histopathological analysis of clinical isolate pulmonary disease manifestations.
Three mice were infected with each of the clinical isolates and sacrificed at 17 days post infection. Lungs were inflated, excised, and fixed in 10% neutral-buffered formalin, and stored in 70% ethanol. Lungs were sectioned and stained with hematoxylin and eosin (H&E) or immunohistochemically with antibodies targeting iNOS, CD68, eosinophil protein X (EPX), or CD4/CD8 dual stain. Slides were scanned and a representative image was taken at 20x magnification (right) or of an entire lung lobe (left).
Fig. 4
Fig. 4. Population structure and SNPs associate with disease manifestation.
A The first two principal components based on the 652 variants predicted to influence gene regulation or protein structure. Three clusters were supported using K-means clustering. Cluster names are based on Gerstein et al. . Disease manifestation is indicated with a colored dot. Hypervirulent isolates (red) were significantly associated with ST93A (P = 0.0183), lethal CNS isolates (yellow) with ST93A (P = 0.0214), non-CNS isolates (blue) with ST93B-I (P = 0.0131), and latent isolates (purple) had a non-significant trend towards ST93A (P = 0.1353). Significance was determined using a two-sided Chi-squared test comparing expected versus observed values. B GWAS results for a trait (IFNγ) with multiple significant associations (Top Panel) and a trait with no statistically significant associatons (Calcofluor white, Bottom Panel). The ordinal categorical variables were analyzed with a proportional odds logistic mixed model and the quantitative variables were analyzed using a mixed linear model. Significant variants were identified by likelihood ratio test P values < 0.05 after a Bonferroni correction. Each dot represents a SNP, arranged by chromosome; significant SNPs are lableled with the gene name. C Venn diagram comparing the number of genes with significantly identified SNPs in the human GWAS, the ST93 all mouse GWAS, and the ST93A mouse GWAS. 14 genes overlapped across all three GWAS studies. D Significant SNPs from the ST93A GWAS are arranged by chromosome order and colored for significant variants. A lighter color indicates differences from the H99 genome associated with a decrease in the trait whereas a darker color indicates variants associated with an increase in that phenotype.
Fig. 5
Fig. 5. Genes with SNPs associated with ITR4 have virulence, IFNγ, and capsule phenotypes.
A Survival curves of mice infected with each of the KN99α deletion mutants. Significance was determined using a two-sided Gehan-Breslow-Wilcoxon test (n = 5–10 mice; itr4Δ P = 0.0472; phs1Δ P < 0.0001). B Fungal CFUs in samples of lungs and brain at terminal endpoints. Significance was determined using a Kruskal–Wallis nonparametric test with Dunn’s multiple comparison correction (n = 5–10 mice; Lungs: itr4Δ P < 0.0001; phs1Δ P = 0.0006; CNAG_07528Δ P = 0.0012; Brain: itr4Δ P = 0.0074). C Fold-change of IFNγ levels in lungs relative to an uninfected control. Significance was determined using a Kruskal–Wallis nonparametric test (n = 5 mice; itr4Δ P = 0.0387; CNAG_07528Δ P = 0.0417). D Five mice were sacrificed at terminal endpoint and lungs and brains were removed. Cryptococcal cells were collected from each organ, stained with India ink, and imaged. Cell body was measured for at least 150 cells collected from brain or lung of three mice. Cells above dashed line are titan cells. Only one very large (30 µm) cell was collected from the brains of four mice infected with Δ05329. Significance was determined using a Kruskal–Wallis nonparametric test. (n = 150; Lung: CNAG_05329Δ 0.0418; itr4Δ P < 0.0001; Brain: phs1Δ P = 0.0036; CNAG_04101Δ < 0.0001; itr4Δ P < 0.0001). E Capsule size in exclusion of cell body was measured for at least 150 cells collected from brain or lung of three mice. Significance was determined using a Kruskal–Wallis nonparametric test (n = 150; Lung: phs1Δ P = 0.0005; CNAG_04101Δ P = 0.0025; CNAG_07528Δ P = 0.0056; Brain: phs1Δ P < 0.0001; CNAG_04101Δ < 0.0001; CNAG_07528Δ P < 0.0001; itr4Δ P < 0.0001). Source data are provided as a Source Data file. (*P < 0.05; **P < 0.01; ***P < 0.001; ****P < 0.0001).
Fig. 6
Fig. 6. ITR4OE is attenuated with lower IFNγ than itr4Δ.
A Mice were infected with 5 × 104 cells of itr4Δ, ITR4OE, and KN99α. Significance was determined using a two-sided Gehan-Breslow-Wilcoxon test (n = 10 mice; itr4Δ P = 0.0472; ITR4OE P < 0.0001). B Lungs and brain were collected at terminal endpoints. Significance was determined using a Kruskal–Wallis nonparametric test with Dunn’s multiple comparison correction (n = 10 mice; Lung: from left to right: P = 0.0012, P = 0.001; Brain, from left to right: P = 0.0233; P = 0.006). C Mice were sacrificed on day 17–20 post infection and lungs removed. The lung supernatant was collected, and cytokine levels determined. Fold-change was calculated relative to an uninfected control. Significance was determined using a Kruskal–Wallis nonparametric test (n = 5 mice; IFNγ: itr4Δ P = 0.0016; IL-4: itr4Δ P = 0.0065). D KN99α, itr4Δ, ITR4OE, and itr4Δ:ITR4 were grown for three days in media supplemented with DME, stained with India ink, and imaged (n = 50; Capsule, from left to right: P < 0.0001; 0.0189; 0.0017). E Mice were sacrificed at terminal endpoint and lungs and brains were removed. Cryptococcal cells were collected from each organ, stained with India ink, and imaged. Capsule and cell body size from at least 50 cells per mouse from 5 mice were measured from the brain. Significance was determined using ordinary one-way ANOVA (n = 150; Capsule, from left to right: P < 0.0001; Cell body, from left to right: P < 0.0001; P < 0.0001; P < 0.0001). Source data are provided as a Source Data file. (**P < 0.01; ****P < 0.0001).
Fig. 7
Fig. 7. ITR4 is downregulated in clinical isolates with SNPs in ITR4.
A Cells were grown in media supplemented with dextrose and inositol and RNA-seq was performed to compare transcription differences between KN99α and itr4Δ. Significance was determined using multiple unpaired T-tests with two stage linear step-up (n = 3 biological replicates; from left to right: p = 0.000015; p = 0.031441; p < 0.000001; p < 0.000001; p = 0.022207; p = 0.031441; p = 0.016111). B qPCR showing the relative expression of ITR4 in KN99α, itr4Δ and three hypervirulent clinical isolates that have SNPs in ITR4. Significance was determined using a one-way ANOVA (n = 3 biological replicates; p values, from left to right: P < 0.0001, P < 0.0001, P < 0.0001, P < 0.0001). C qPCR showing the relative expression of CNAG_05664 in KN99α, itr4Δ and three hypervirulent clinical isolates that have SNPs in ITR4 (n = 3 biological replicates; from left to right: P < 0.0001, P < 0.0001, P < 0.0001, P < 0.0001). Significance was determined using a one-way ANOVA. Source data are provided as a Source Data file. (****P < 0.0001).
Fig. 8
Fig. 8. Model showing hypothesized SNP relationship to IFNγ and hypervirulence.
A Genes predicted to be in a network with ITR4. The size of the gene arrows represents the hypothesized transcription amount of each gene based on RNA-seq data. B Genes hypothesized to be in the SNP accumulation pathway, with the increase in number of SNPs correlating with an increase in IFNγ and virulence. Red circle represents the SNP location. Figure created with BioRendor.

References

    1. Jackson K. M., Ding M., Nielsen K. Importance of clinical isolates in Cryptococcus neoformans research. J. Fungi9, 364 (2023). - PMC - PubMed
    1. Maziarz, E. K. & Perfect, J. R. Cryptococcosis. Infect. Dis. Clin. N. Am.30, 179–206 (2016). - PMC - PubMed
    1. Rajasingham, R. et al. The global burden of HIV-associated cryptococcal infection in adults in 2020: a modelling analysis. Lancet Infect. Dis.22, 1748–1755 (2022). - PMC - PubMed
    1. Rajasingham, R. et al. Global burden of disease of HIV-associated cryptococcal meningitis: an updated analysis. Lancet Infect. Dis.17, 873–881 (2017). - PMC - PubMed
    1. Ashton, P. M. et al. Three phylogenetic groups have driven the recent population expansion of Cryptococcus neoformans. Nat. Commun.10, 2035 (2019). - PMC - PubMed

Publication types

LinkOut - more resources