Clinical Trial
. 2024 Dec 2;15(1):10475.
doi: 10.1038/s41467-024-54419-3.

PET-CT outcomes from a randomised controlled trial of rosuvastatin as an adjunct to standard tuberculosis treatment

Affiliations
Clinical Trial

PET-CT outcomes from a randomised controlled trial of rosuvastatin as an adjunct to standard tuberculosis treatment

Gail B Cross et al. Nat Commun. .

Abstract

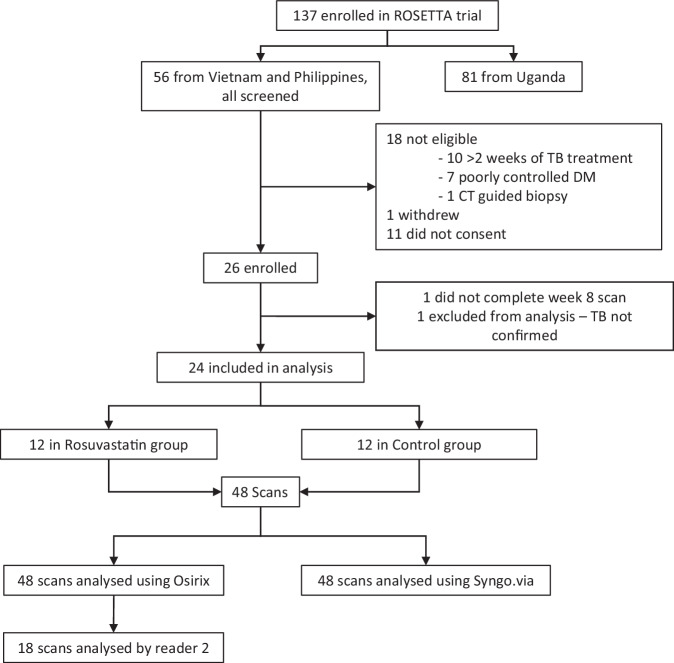
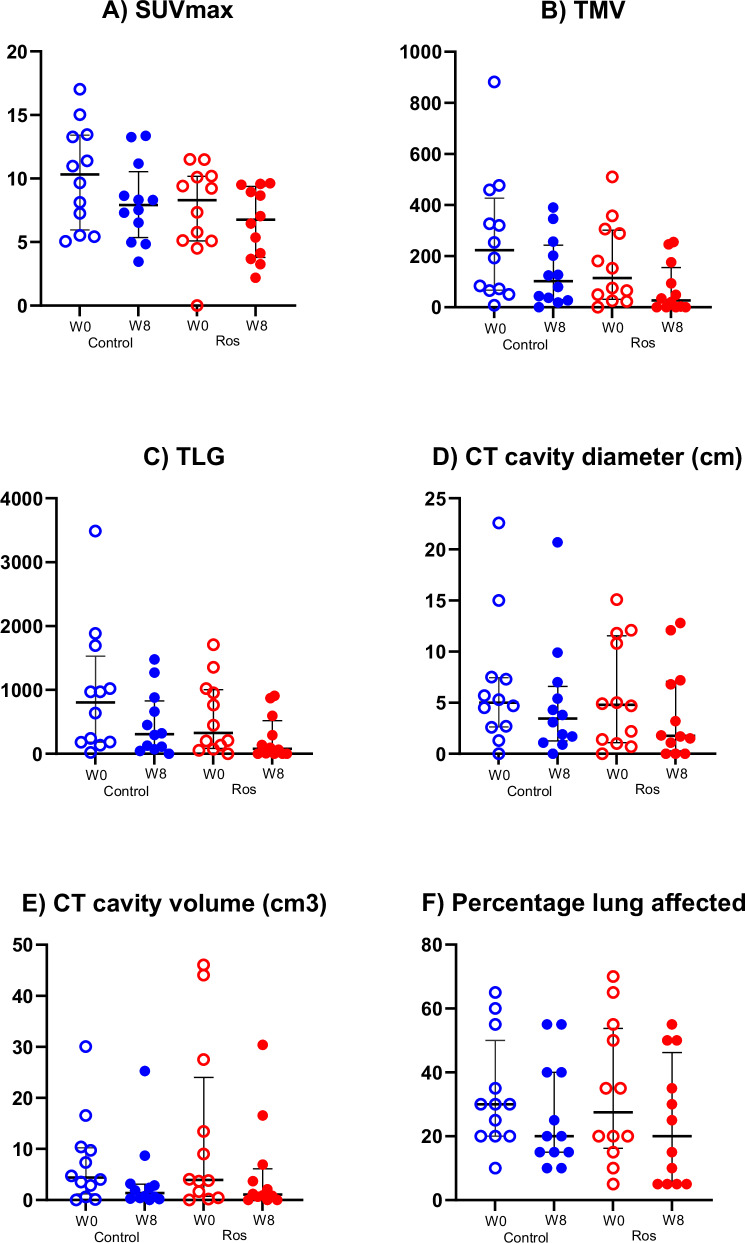
Adjunctive rosuvastatin for rifampicin-susceptible pulmonary tuberculosis (rs-PTB) shows no effect on microbiological or radiological outcomes in a phase IIb randomised, controlled trial (NCT04504851). We explore the impact of adjunctive rosuvastatin on 18F-fluorodeoxyglucose (FDG) positron emission tomography-computed tomography (PET-CT) imaging in a sub-study of 24 participants. Changes in standardised uptake value (SUVmax, SUVmean), Total Metabolic Volume, (TMV), Total Lesion Glycolysis (TLG), cavity diameter and volume, between week 0 and week 8 post-randomisation, are evaluated. Here we show no evidence of difference in the reduction in TLG [median 65.8% for the rosuvastatin group (Q1, Q3 38.6, 94.5) vs 64.3% for standard tuberculosis treatment group (Q1, Q3 -20.0, 81.7), P = 0.32], reduction in cavity volume on CT [median 3.2 cm3 (IQR 11.1, 0.5) for rosuvastatin, 2.2 cm3 (IQR 4.6, 0.7) for control (p = 0.72)], or any other PET-CT parameter measured. We show that the first 8-weeks of standard tuberculosis treatment results in a reduction in the volumetric indices (TLG and TMV), but had little change in SUVmax or SUVmean. Change in TLG and TMV holds promise as biomarkers of tuberculosis treatment response: future PET-CT studies should evaluate their role in predicting relapse-free cure, and the overall role of 18F-FDG-PET-CT as a tool for early-phase tuberculosis clinical trials.


Conflict of interest statement

Competing interests: The authors declare the following competing interests: Dr. Jim O’Doherty is employed by Siemens Medical Solutions. However, Siemens Medical Solutions had no role in the conception, design, execution, data analysis, manuscript preparation, or the decision to submit this study for publication. The views expressed in this study are solely those of the authors and do not necessarily reflect those of Siemens Medical Solutions. All other authors declare no financial or non-financial competing interests.

Figures

Fig. 1
Fig. 1. Participant flow diagram.
The PET-CT sub-study recruited 26 participants with microbiological evidence of pulmonary tuberculosis from the main ROSETTA trial cohort of 137 participants by convenience sampling. Data from two scans, performed at week 0 and 8 of treatment, from 24 participants were analysed. Scans were analysed by a single reader using 2 software programmes, with a selection of scans read by a second reader using the OsiriX MD software. Source data are provided as a Source Data file.
Fig. 2
Fig. 2. PET-CT parameters measured.
A Coronal section of thoracic cavity on a baseline PET-CT scan. Red outlined area is the region of interest (ROI) where all pixels have standardised uptake value (SUV) of 2.0 or greater. Maximum standardised uptake value (SUVmax) is defined as the hottest pixel within the ROI. SUVmean is defined as the average SUV of all pixels within the ROI. Dark blue outlined area represents a cavity within consolidated lung tissue. Cavity diameter (cm) was the widest measurement of the cavity on CT imaging. B 3-D of a volume of interest (VOI, cm3) of a single lesion where the SUV of voxels is 2.0 or greater. Total Metabolic Volume (TMV, cm3) is defined as the summation of all VOIs within a single scan. Total lesion glycolysis (TLG) is the product of metabolic volume in cm3 and SUVmean and is expressed without units.
Fig. 3
Fig. 3. Impact of adjunctive rosuvastatin versus standard TB treatment alone over 8 weeks of treatment in N = 24 participants.
Blue dots represent Control group, Red dots represent Rosuvastatin group. Open dots represent Week 0 timepoint, coloured in dots represent Week 8 timepoint. A SUVmax [Week 0 median = 10.3 (IQR 6.4, 13.4), Week 8 median = 7.9 (IQR 5.8, 9.9) for Control, Week 0 median = 8.3 (IQR 5.1, 10.2), Week 8 median = 6.8 (IQR 3.9, 9.2) for Rosuvastatin], B TMV (cm3) [Week 0 median = 223.5 (68.8, 393.6), Week 8 median = 102.1 (IQR 32.1, 229.4) for control, Week 0 median =114.2 (IQR 37.4, 297.5), Week 8 median 27.3 (IQR 0.8, 135.0) for Rosuvastatin], C TLG [Week 0 median = 804.7 (IQR 183.1, 1358.7), Week 8 median = 308.5 (IQR 92.4, 771.4) for control, Week 0 median = 328.2 (IQR 1031, 987.4), Week 8 median = 79.8 (IQR 2.0, 443.3) for rosuvastatin], D Cavity diameter on CT (cm) [Week 0 median = 5.0 (IQR 2.7, 7.4), Week 8 median = 3.4 (IQR 1.4, 6.2) for Control, Week 0 median = 4.8 (IQR 1.2, 11.3), Week 8 median = 1.8 (IQR 0.6, 7.0) for Rosuvastatin], E Cavity volume on CT (cm3) [Week 0 median = 4.4 (IQR 1.7, 10.1), Week 8 median = 1.3 (IQR 0.3, 3.0) for Control, Week 0 median = 3.9 (IQR 1.0, 20.5), Week 8 median = 1.0 (IQR 0.3, 5.3) for Rosuvastatin], F Percentage of lung affected (%) [Week 0 median = 30 (IQR 20, 45), Week 8 median = 20 (IQR 15, 40) for Control, Week 0 median = 27.5 (IQR 17.5, 52.5), Week 8 median = 20 (IQR 5, 52.4) for Rosuvastatin]. Source data are provided as a Source Data file.
Fig. 4
Fig. 4. Comparison of PET-CT analysis by two independent readers (18 scans), N = 9.
Correlation (Left column) and Bland-Altman (Right column). Dashed lines in Bland-Altman plots represent Limits of Agreement (LoA). A two-sided test was applied to all tests of statistical significance. TLG (A) Spearman’s r > 0.99, P < 0.0001, and (B) Bias = 10.7, 95% LoA: −49.9, 71.21; SUVmax (C) Spearman’s r = 0.98, P < 0.0001, and (D) Bias = −0.12, 95% LoA: −1.17, 0.93; TMV in cm3 (E) Spearman’s r = 0.99, P < 0.0001), and (F) Bias = 5.80, 95% LoA: −26.4, 38.0; Number of PET-CT avid lesions (G) Spearman’s r = 0.72, P = 0.0008, and (H) Bias = −1.67, 95% LoA: −10.61, 7.3. Single outlier of disagreement in Bland-Altman plots of TMV (3D) and TLG (3 F) corresponds to the highest readings of TMV and TLG by both readers (means of 850.8 cm3 and 3436.1 respectively). Source data are provided as a Source Data file.

References

    1. Wallis, R. S. et al. Adjunctive host-directed therapies for pulmonary tuberculosis: a prospective, open-label, phase 2, randomised controlled trial. Lancet Respir. Med.9, 897–908 (2021). - PMC - PubMed
    1. Parihar, S. P. et al. Statin therapy reduces the mycobacterium tuberculosis burden in human macrophages and in mice by enhancing autophagy and phagosome maturation. J. Infect. Dis.209, 754–763 (2014). - PubMed
    1. Dutta, N. K. et al. Statin adjunctive therapy shortens the duration of TB treatment in mice. J. Antimicrob. Chemother.71, 1570–1577 (2016). - PMC - PubMed
    1. Dutta, N. K. et al. Adjunctive host-directed therapy with statins improves tuberculosis-related outcomes in mice. J. Infect. Dis.221, 1079–1087 (2020). - PMC - PubMed
    1. Lai, C. C. et al. Statin treatment is associated with a decreased risk of active tuberculosis: an analysis of a nationally representative cohort. Thorax71, 646–651 (2016). - PubMed

Publication types

Associated data

LinkOut - more resources