. 2024 Dec 2;15(1):10470.
doi: 10.1038/s41467-024-54350-7.

Genetically-stable engineered optogenetic gene switches modulate spatial cell morphogenesis in two- and three-dimensional tissue cultures

Affiliations

Genetically-stable engineered optogenetic gene switches modulate spatial cell morphogenesis in two- and three-dimensional tissue cultures

Hannes M Beyer et al. Nat Commun. .

Abstract

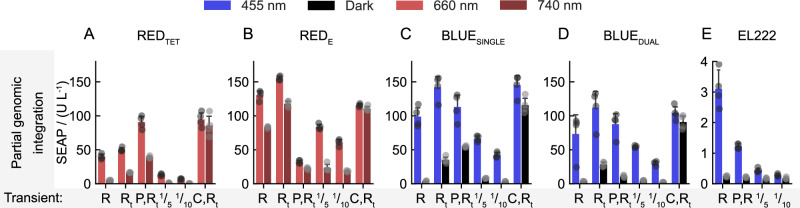
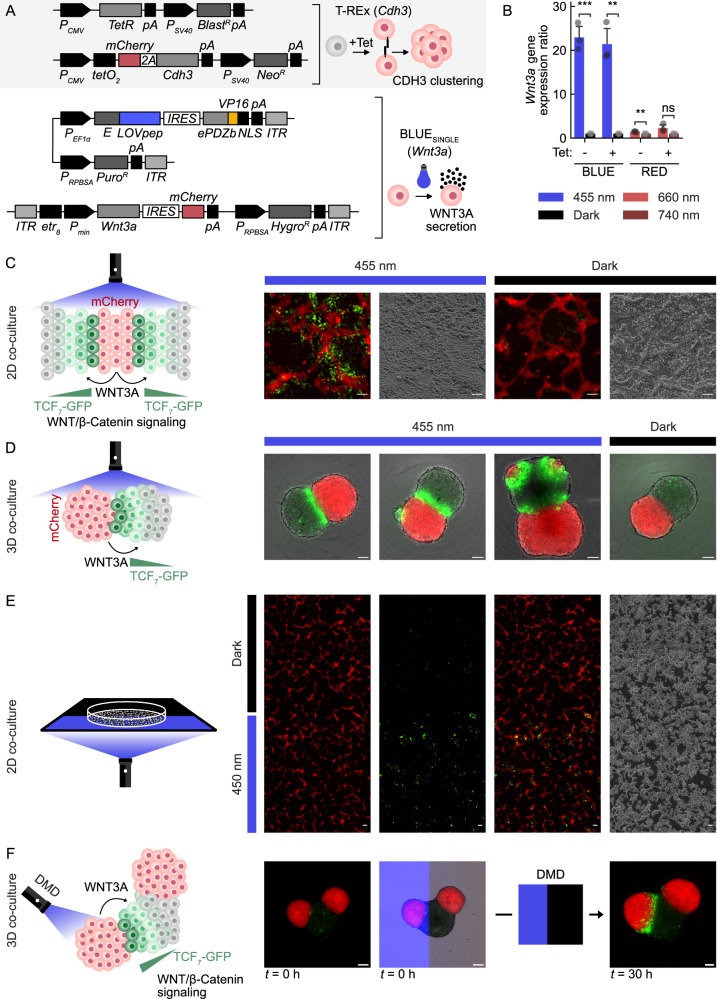
Recent advances in tissue engineering have been remarkable, yet the precise control of cellular behavior in 2D and 3D cultures remains challenging. One approach to address this limitation is to genomically engineer optogenetic control of cellular processes into tissues using gene switches that can operate with only a few genomic copies. Here, we implement blue and red light-responsive gene switches to engineer genomically stable two- and three-dimensional mammalian tissue models. Notably, we achieve precise control of cell death and morphogen-directed patterning in 2D and 3D tissues by optogenetically regulating cell necroptosis and synthetic WNT3A signaling at high spatiotemporal resolution. This is accomplished using custom-built patterned LED systems, including digital mirrors and photomasks, as well as laser techniques. These advancements demonstrate the capability of precise spatiotemporal modulation in tissue engineering and open up new avenues for developing programmable 3D tissue and organ models, with significant implications for biomedical research and therapeutic applications.


Conflict of interest statement

Competing interests: The authors declare no competing interests.

Figures

Fig. 1
Fig. 1. Design of optogenetic switches for genomic cell engineering.
AC Modes of function for the optogenetic gene switches. Light exposure activates the expression of a gene of interest (GOI) via recruitment of the transactivation domain VP16 to a minimal CMV promoter (Pmin). A RED gene switches utilize the PhyBN/PIF6APB interaction and either E or TetR as the DNA-binding domain specific for the etr8 or TCE DNA elements, respectively. Red light (R) activates PhyBN and initiates binding to PIF6APB, and thus recruitment of the reconstituted TF to the target sequence of the respective DNA-binding domain to the synthetic promoter, whereas far-red light causes dissociation. B BLUE gene switch implemented either on one (SINGLE) or two (DUAL) independent vectors. Blue light causes the binding of LOVpep to ePDZb via relaxation of helix Jα exposing the otherwise caged ePDZb-interacting peptide. C The EL222 single-component gene switch exhibits natural photo-regulated DNA binding capacity to the C120 operator sequence in response to blue light. Fusion of EL222 to VP16 results in a functional optogenetic TF for eukaryotic cells. D General architecture of transposition-competent vectors encoding photoswitches. E Architecture of attenuated (Ra, δ spacing, no ITRs), transposition-incompetent (R, no ITRs), and transposition-competent (Rt) reporter constructs utilizing SEAP as the GOI (see Table S1, Supplementary Information, for details). TCE contains seven tetO repeats. F Functional tests of tTA (TetR-VP16) and eTA (E-VP16)-activatable SEAP reporter constructs as in (E) using transient transfection together with the respective activators (Act) into CHO-K1 cells. p-values: tetO7-R, 1.622e−4; tetO7-Rt, 1.319e−4; etr8-R, 8.976e−5; etr8-Rt, 2.577e−3. G Transient transfection test of transposition-competent vectors for the REDTET and REDE system as in (D) for E and TetR-specific systems in CHO-K1 cells. The attenuated TetR-specific reporter construct contained 13 tetO operator repeats. p-values: tetO13-Ra, 2.332e-7; tetO7-R, 2.331e-7; tetO7-R, 6.052e-8; etr8-Ra, 1.203e-5; etr8-R, 7.520e-6; etr8-Rt, 1.922e-5. H Transient test of BLUESINGLE and BLUEDUAL transposition-competent vectors in CHO-K1 cells as in (D). p-values: Single-Ra, 1.514e-6; Single-R, 6.492e-8; Single-Rt, 4.344e-6; Dual-Ra, 1.027e-3; Dual-R, 6.120e-7; Dual-Rt, 3.229e-5. I Transient test of the transposition-competent vector encoding the EL222 photoswitch in CHO-K1 cells. p-value: 8.224e-7. FI Used reporter constructs as in (E). Data represent mean values with one standard deviation of four biological replicates compared with two-sided independent Student’s t-tests. **, 1e-3 <p ≤ 1e-2; ***, 1e-4 <p ≤ 1e-3; ****, p ≤ 1e-4. Source data are provided with this paper.
Fig. 2
Fig. 2. Partial genomic integration of optogenetic gene switches.
AE Cultures represent a mixed, polyclonal population of cells, selected with antibiotics, with individual genomic insertion events of the photoswitch constructs as in Fig. S1, Supplementary Information. Additionally, the cultures were transiently transfected with the reporter constructs R or Rt (see Fig. 1E), the photoswitch-encoding vector P which was used for the generation of the culture, a 1/10 or 1/5 reduced amount of Rt, or C, the constitutive activators tTA or eTA in combination with Rt. Cultures were illuminated for 24 h with 455 nm light at an intensity of 10 µmol m−2 s−1, or with 660 or 740 nm light at 20 µmol m−2 s−1, prior to determining the secreted SEAP levels. CHO-K1-derived cultures are shown, see Fig. S2, Supplementary Information, for the full dataset with all cell lines. Data represent mean values with one standard deviation of four biological replicates (three replicates for the 455 nm light sample of BLUESINGLE with 1/10 dilution). Source data are provided with this paper.
Fig. 3
Fig. 3. Complete genomic transposition of optogenetic gene systems.
A CHO-K1-derived bulk cultures after complete genomic transposition of the BLUESINGLE (dark blue) or BLUEDUAL (light blue) vectors and matching Rt SEAP reporter constructs (see Fig. 1E). Gray shaded bars highlight fully genomically-stable conditions without any additional plasmid transfection. The cultures were illuminated for 24 h with 10 µmol m−2 s−1 light of 455 nm or kept in darkness. Cultures were left untreated or additionally transfected with the indicated components as in Fig. 2 prior to optogenetic tests. The used vector architectures are shown to the right. p-values (BLUESINGLE): -, 1.479e-6; Rt, 8.396e-5; P, 4.997e-6; (P,Rt), 3.000e-4; 1/10 Rt, 1.620e-5; C, 2.645e-1. p-values (BLUEDUAL): -, 9.682e-6; Rt, 2.547e-4; P, 4.498e-4; (P,Rt), 8.867e-5; 1/10 Rt, 2.614e-3; C, 4.377e-1. B Profile of randomly selected clones derived from the BLUESINGLE vector culture. Data points represent SEAP values determined from a single sample for each clone measured with two different dilutions of culture medium (technical replicates), the bar indicates the average. C Experiment as in (B) using randomly selected clones derived from the BLUEDUAL vector culture. D Kinetic response profile of the indicated clones in (B) using 455 nm light at an intensity of 10 µmol m−2 s−1 over 32 h. Mean values of four biological culture replicates are shown with error bands representing one standard deviation. E Dose response curve using clone #14 with blue light intensities in the range of 0 – 14 µmol m−2 s−1. Data obtained from four biological replicates were fitted into a Hill binding isotherm (blue line) yielding an I50 intensity value of 6.45 µmol m−2 s−1. Data points marked with “E” at the highest intensity were obtained from samples supplemented with 2 µg/mL erythromycin. Unaveraged single data points are plotted, the error band represents the 95% confidence interval of the fit. F Comparison of selected clones of (B) and (D). p-values: #2, 8.419e-4; #7, 7.405e-6; #14, 6.692e-6; #21, 8.748e-4; #8, 3.166e-4; #9, 6.138e-4; #16, 5.813e-4; #18, 2.548e-5. A, F Data represent mean values with one standard deviation of four biological replicates compared with two-sided independent Student’s t-tests. ns, 5e-2 <p ≤ 1; **, 1e-3 <p ≤ 1e-2; ***, 1e-4 <p ≤ 1e-3; ****, p ≤ 1e-4. B, C Mean values of two technical replicates are shown. AF Source data are provided with this paper.
Fig. 4
Fig. 4. Optogenetic induction of necroptosis in 2D and 3D mammalian tissue cultures.
A Genetic constructs enabling blue light-induced expression of MLKLN for the subsequent induction of necroptosis based on BLUESINGLE and the vector design in Fig. 1D, E. See Fig. S4, Supplementary Information, for the REDE system. Inverted brightfield images are shown. B Induction of necroptosis after 24 h of overall LED blue light illumination with an intensity of 10 µmol m−2 s−1using a CHO-K1-derived clone (clone #10) in a 2D cell culture. The addition of 2 µg/mL erythromycin confers protection from necroptosis. The experiment was performed seven times with similar results. C Dose-response curve of optogenetic necroptosis induction using clone #10. The living cell number in a microscopic area of 1.76 mm2 was determined after 24 h of blue light illumination using the indicated intensities. Data obtained from three biological culture replicates were fitted into a Hill binding isotherm (blue line) yielding an I50 intensity value of 3.03 µmol m−2 s−1. Unaveraged single data points are plotted, the error band represents the 95% confidence interval of the fit. Data points labeled with “E” at the highest intensity derive from samples supplemented with 2 µg/mL erythromycin, overlaid with a box plot showing the 25th, 50th, and 75th percentiles where the whiskers extend to points that lie within a 1.5 interquartile range. Source data are provided with this paper. D Induction of necroptosis after 24 h of blue light illumination in 3D spheroid cultures using the cells as in B with a blue light intensity of 20 µmol m−2 s−1. Brightfield and confocal EGFP and SYTOX microscopic images of the same sample are shown. The experiment was performed three times with similar results. B, D Scale bar, 100 µm; representative images are shown.
Fig. 5
Fig. 5. Spatiotemporal control of 2D and 3D tissues.
A Spatial induction of necroptosis using a 3D-printed photomask mounted in the LPA device using a light intensity of 40 µmol m−2 s−1 (blue LED light). The bottom sample shows the erythromycin control at identical conditions (see Fig. S5, Supplementary Information). Scale bar, 1 mm. The experiment was performed three times with similar results. B Spatial, dynamic, and quantitative control of optogenetic necroptosis induction using the digital mirror device for patterning using a 4x magnification objective in a time series. 8-bit grey shades correspond to 60, 120, 180, and 255. An overlay of EGFP, mCherry, and SYTOX Blue signals is shown. See Fig. S6 and Movie S1–2, Supplementary Information, for controls and movies. Scale bar, 100 µm. C Brightfield and blue light pattern projection (top) and SYTOX Blue signal (bottom) of the experiment in (B) at 33 h. D Spatial induction of necroptosis in a 3D culture of CHO-K1NecrOpto cells using 488 nm laser excitation over a period of 20 h shown as intensity projection of a Z-stack. The tissue sample in the bottom row was supplemented with 2 µg/mL erythromycin. See Fig. S8, Supplementary Information, for individual z-layers. Scale bar, 100 µm. Each experiment was performed once, see Fig. S7, Supplementary Information, for a repeat with higher imaging frequency. E Schematic representation of spheroid blue light illumination and imaging using a custom light sheet microscope. F Spatiotemporal regulation attempts of necroptosis in 3D tissues using light sheet microscopy. 3D spheroid cultures derived from CHO-K1NecrOpto cells were illuminated with a plane (white arrows) of 488 nm laser light for optogenetic activation at the indicated intensities. After 5 h, z-stacks were acquired visualizing constitutive EGFP fluorescence and cell death by staining with SYTOX Red. The experiments were performed four times independently. Scale bar, 50 µm.
Fig. 6
Fig. 6. Optogenetic spatial modulation of polarized WNT3A organizing centers in 2D and 3D cultures.
A Engineering of HEK-293 cells for light-controlled expression of Wnt3a combined with chemically-inducible Cdh3 expression (HEKCdh3-OptoWnt cells). The engineered cell lines harbor four genomic constructs mediating the tetracycline-controlled expression of the mouse endothelial cadherin Cdh3 for clustering and mCherry (top), and optogenetically-regulated expression and secretion of mouse Wnt3a using either a blue-light or red-light optogenetic gene-switch. B Quantitative RT-PCR analysis of optogenetic Wnt3a expression in HEKCdh3-OptoWnt cells. HEKCdh3 cells with tetracycline-inducible Cdh3 expression were further engineered for blue or red light-inducible expression of Wnt3a using the BLUESINGLE or REDE system, respectively. Cells were illuminated with the corresponding wavelengths for 24 h prior to RNA extraction and qPCR analysis. Data represent mean values with one standard deviation of three technical replicates compared with two-sided independent Student’s t-tests. ns, 5e-2 <p ≤ 1; **, 1e-3 <p ≤ 1e-2; ***, 1e-4 <p ≤ 1e-3. p-values: BLUE-Tet, 2.407e-4; BLUE+Tet, 1.287e-3; RED-Tet, 2.163e-3; RED+Tet, 6.885e-2. Source data are provided in this paper. C Optogenetic WNT3A-signaling across cell populations. HEKCdh3-OptoWnt cells were induced with tetracycline for endothelial cadherin-mediated self-clustering and mCherry expression and mixed with TOP-GFP sensor cells for WNT3A perception and detection via EGFP expression. Cell cultures were illuminated for 24 h with 10 µmol m−2 s−1 blue light (overall illumination) using LEDs, or kept in darkness. Representative images of four experiments are shown. Scale bar, 100 µm. D Three-dimensional optogenetic WNT3A organizing centers formed from HEKCdh3-OptoWnt cells inducing WNT3A-signaling in proximal TOP-GFP spheroids. Assembloids were formed from 3000 or 6000 tetracycline-induced HEKCdh3-OptoWnt cells and the same number of TOP-GFP cells were illuminated with 20 µmol m−2 s−1 blue light (overall illumination) using LEDs for 30 h, or kept in darkness. Representative images of one out of three similar experiments with 18 illuminated and four dark-incubated samples are shown. Scale bar, 100 µm. E Spatial induction of WNT3A signaling in a two-dimensional HEKCdh3-OptoWnt and TOP-GFP co-culture using a photomask. Experiment as in (C) but the cells were illuminated from below through a 3D-printed photomask covering half of the sample area. A representative area of the acquired stitched wide-field region of a single experiment is shown. Scale bar, 100 µm. F Selective patterned activation of a distinct 3D optogenetic WNT3A organizing center and signaling perception by a TOP-GFP spheroid assembled with multiple organizers. Experiment as in (D) but using 2× 4000 HEKCdh3-OptoWnt and 8000 TOP-GFP cells and digital mirror-controlled 450 nm blue light illumination at the microscope. A 4X objective was used for the initial image and pattern projection of a single selected sample which successfully formed a tripartite assembloid. The final image was acquired using a 10X objective. Scale bar, 100 µm. A, B Tet, tetracycline.

References

    1. Khademhosseini, A. & Langer, R. A decade of progress in tissue engineering. Nat. Protoc.11, 1775–1781 (2016). - PubMed
    1. Weake, V. M. & Workman, J. L. Inducible gene expression: diverse regulatory mechanisms. Nat. Rev. Genet.11, 426–437 (2010). - PubMed
    1. Kallunki, T., Barisic, M., Jäättelä, M. & Liu, B. How to choose the right inducible gene expression system for mammalian studies? Cells8, E796 (2019). - PMC - PubMed
    1. Weber, W. & Fussenegger, M. Emerging biomedical applications of synthetic biology. Nat. Rev. Genet.13, 21–35 (2012). - PMC - PubMed
    1. Ijäs, T. & Koskinen, R. Exploring biological possibility through synthetic biology. Eur. J. Philos. Sci.11, 39 (2021).

Publication types

LinkOut - more resources