. 2024 Dec 2;15(1):10485.
doi: 10.1038/s41467-024-54555-w.

Mechanisms of life cycle simplification in African trypanosomes

Affiliations

Mechanisms of life cycle simplification in African trypanosomes

Guy R Oldrieve et al. Nat Commun. .

Abstract

African trypanosomes are important parasites in sub-Saharan Africa that undergo a quorum-sensing dependent development to morphologically 'stumpy forms' in mammalian hosts to favour transmission by tsetse flies. However, some trypanosome clades have simplified their lifecycle by escaping dependence on tsetse allowing an expanded geographic range, with direct transmission between hosts achieved via blood-feeding biting flies and vampire bats (Trypanosoma brucei evansi, causing 'surra') or through sexual transmission (Trypanosoma brucei equiperdum, causing 'dourine'). Concomitantly, stumpy formation is reduced and the isolates are described as monomorphic, with infections spread widely in Africa, Asia, South America and parts of Europe. Here, using genomic analysis of distinct field isolates, we identify molecular changes that accompany the loss of the stumpy formation in monomorphic clades. Using CRISPR-mediated allelic replacement, mutations in two exemplar genes (Tb927.2.4020; Tb927.5.2580) are confirmed to reduce stumpy formation whereas another (Tb927.11.3400) is implicated in altered motility. Using laboratory selection we identify downregulation of RNA regulators as important in the initial development of monomorphism. This identifies a trajectory of events that simplify the life cycle in emergent and established monomorphic trypanosomes, with impact on disease spread, vector control strategies, geographical range and virulence.


Conflict of interest statement

Competing interests: The authors declare no competing interests.

Figures

Fig. 1
Fig. 1. Monomorphic T. brucei are polyphyletic and form at least four independent clades, each displaying clade specific features at the genome scale.
a A centrally rooted phylogenetic tree was created with 368,730 SNPs. Bootstrap confidence below 100 are reported by circles; white: 75–100, grey: 50–75 and black: 25–50. The tree scale, highlighted by the bold line at the tree root, represents 0.05 substitutions per site. Monomorphic isolates form at least four distinct clades, T. b. equiperdum type OVI, T. b. equiperdum type BoTat, T. b. evansi type A and T. b. evansi type B. IVM-t1, an isolate originating from the genital mucosa of a horse, groups with T. b. evansi type B. Pleomorphic clades are not highlighted. A full list of the isolates used in this tree is found in Supplementary Data 1. b The density of clade-specific mutations, location of copy number variation (CNV) highlighted in red (increase in copy number) or blue (decrease in copy number), density of genes with a positive dN/dS ratio (dN/dS) and locations of runs of homozygosity (ROH) highlighted in black. Each statistic is calculated across the 11 megabase chromosomes for each monomorphic clade. CNV (outer circles) and ROH (inner circles) are split into tracks for each clade ordered out to in; T. b. evansi type A (green), T. b. evansi type B (red), T. b. evansi type IVM-t1 (purple), T. b. equiperdum type OVI (yellow) and T. b. equiperdum type BoTat (orange).
Fig. 2
Fig. 2. Monomorphic T. brucei clades display mutations in discrete genes which hinder pleomorphic phenotypes.
a, c, e Growth and (b, d) percentage of the population replicating and PAD1 + % from pleomorphic T. b. brucei EATRO 1125 AnTat1.1 J1339 subjected to replacement of endogenous gene targets (a, b) Tb927.2.4020 APPBP1, (c, d) Tb927.5.2580—hypothetical protein and (e, f) Tb927.11.3400—Flagellum attachment zone protein 41 (FAZ41). The replacement cell lines were grown in HMI-9, or HMI-9 supplemented with an in vitro mimic of the QS signal, oligopeptide broth BHI (15%). Significance at each timepoint and for each comparison was tested using a repeated measures ANOVA, including an adjusted post-hoc Bonferroni test and significance indicated (T. b. brucei vs monomorph, formula image; T. b. brucei vs add-back, formula image
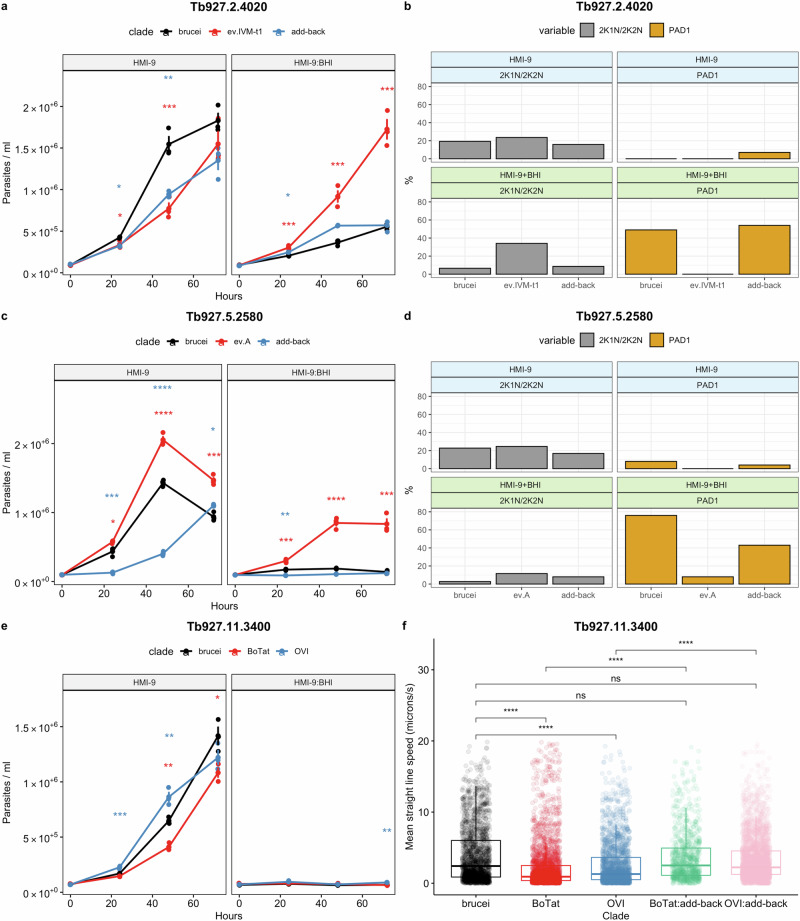
). * (p < 0.05); ** (p < 0.01; *** (p < 0.001); **** (p < 0.0001). For the growth and IFA analysis, four flasks were grown, three biological replicates for growth analysis and one to screen PAD1 and K/N counts at 48 h. f The motility of the FAZ41 replacement cell lines was also quantified for cells expressing the T. b. brucei (n = 1758), T. b. equiperdum type BoTat (n = 2618), T. b. equiperdum type OVI (n = 2003), T. b. equiperdum type BoTat:add-back (n = 867) and T. b. equiperdum type OVI:add-back (n = 3192) each compared between three biological replicates using a Wilcoxon two-sample test and the significance is indicated (* (p < 0.05); ** (p < 0.01; *** (p < 0.001); **** (p < 0.0001)). Source data are provided as a Source Data file.
Fig. 3
Fig. 3. Pleomorphic T. b. brucei expressing the monomorphic T. b. evansi type A Tb927.5.2580 sequence delays developmental progression.
a In vivo growth of pleomorphic T. b. brucei expressing the monomorphic T. b. evansi type A Tb927.5.2580 sequence or the pleomorphic T. b. brucei sequence, (b) cell cycle stage and (c) percentage of PAD1+ cells as assessed by immunofluorescence. Each cell line was used to infect four mice, represented by the dots at each time point. Error bars represent mean standard error. Significance at each timepoint and for each comparison was tested using a repeated measures ANOVA, including an adjusted post-hoc Bonferroni test and significance indicated (brucei vs monomorph, formula image; brucei vs add-back, formula image). * (p < 0.05); ** (p < 0.01; *** (p < 0.001); **** (p < 0.0001). d Representative DAPI, PAD1 and merged images of each cell line at 6 DPI. Scale bar = 30 µm. Source data are provided as a Source Data file.
Fig. 4
Fig. 4. Selected monomorphs display reduced developmental progression, which is reversible by inducible expression of key gene regulators.
a Five independent clones, derived by passage in increasing concentrations of BHI, display reduced developmental competence. The clones were grown in either HMI-9 or HMI-9 supplemented with 15% BHI; lines after passage 3 (pleomorph) or passage 30 are shown (monomorph). b PCA plot highlights the majority of variance in RNAseq libraries from the selection is explained by the selection from pleomorph to monomorph. c 23 differentially expressed genes are shared between each of the five clonal selections for monomorphism. d Heatmap of the 23 differentially expressed genes. The scale represents the row Z score, indicating the amount each gene deviates by in a specific sample compared to the genes mean expression across all samples. e Growth of monomorphic clone A7 induced with doxycycline (Plus) or not (Minus) to express transgenic RBP10 and ZC3H20. Each cell line was grown in triplicate biological replicates, represented by the dots at each time point. A triangle represents the mean for each time point. Error bars represent mean standard error. Significance at each timepoint and for each comparison was tested using a repeated measures ANOVA, including an adjusted post-hoc Bonferroni test and significance indicated (* (p < 0.05); ** (p < 0.01; *** (p < 0.001); **** (p < 0.0001). Source data are provided as a Source Data file.
Fig. 5
Fig. 5. A model for lifecycle simplification in Trypanosoma brucei.
This proposes that (1) in tsetse dense areas, developmental competence is maintained, supporting the genetic diversity of the parasite population through sexual recombination in the tsetse vector. (2) If tsetse numbers fall, or infected hosts move from a tsetse endemic area, transmission flexibility can be favoured by downregulating developmental regulators, forming proto-monomorphs, promoting enhanced parasitaemia and so mechanical transmission. (3) With prolonged mechanical transmission, mutations accrue which would eventually lock the proto-monomorphs into an obligate asexual/ monomorphic lifecycle. Created in BioRender (https://BioRender.com/t96e131).

References

    1. Lukes, J., Skalicky, T., Tyc, J., Votypka, J. & Yurchenko, V. Evolution of parasitism in kinetoplastid flagellates. Mol. Biochem Parasitol.195, 115–122 (2014). - PubMed
    1. Bruce, D., Hamerton, A. E., Bateman, H. R. & Mackie, F. P. Trypanosome diseases of domestic animals in Uganda II.—Trypanosoma brucei (Plimmer and Bradford). Proc. R. Soc. Lond. B Biol. Sci.83, 1–14 (1910).
    1. Vickerman, K. Developmental cycles and biology of pathogenic trypanosomes. Br. Med Bull.41, 105–114 (1985). - PubMed
    1. Rojas, F. et al. Oligopeptide Signaling through TbGPR89 Drives Trypanosome Quorum Sensing. Cell176, 306–317.e316 (2019). - PMC - PubMed
    1. Tettey, M. D., Rojas, F. & Matthews, K. R. Extracellular release of two peptidases dominates generation of the trypanosome quorum-sensing signal. Nat. Commun.13, 1–14 (2022). - PMC - PubMed

Publication types

Substances