. 2024 Dec 2;14(1):29913.
doi: 10.1038/s41598-024-80677-8.

A novel small molecule Enpp1 inhibitor improves tumor control following radiation therapy by targeting stromal Enpp1 expression

Affiliations

A novel small molecule Enpp1 inhibitor improves tumor control following radiation therapy by targeting stromal Enpp1 expression

Jason R Baird et al. Sci Rep. .

Abstract

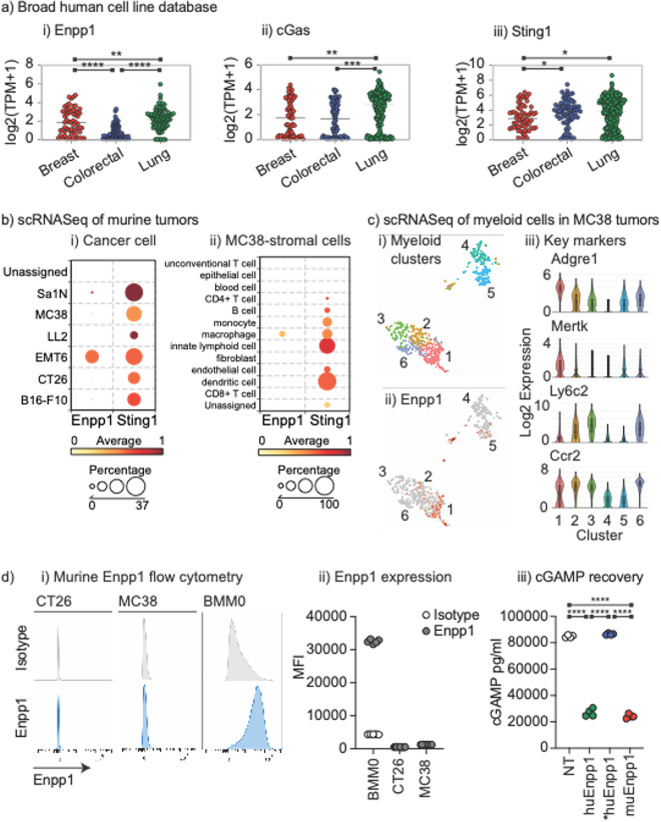
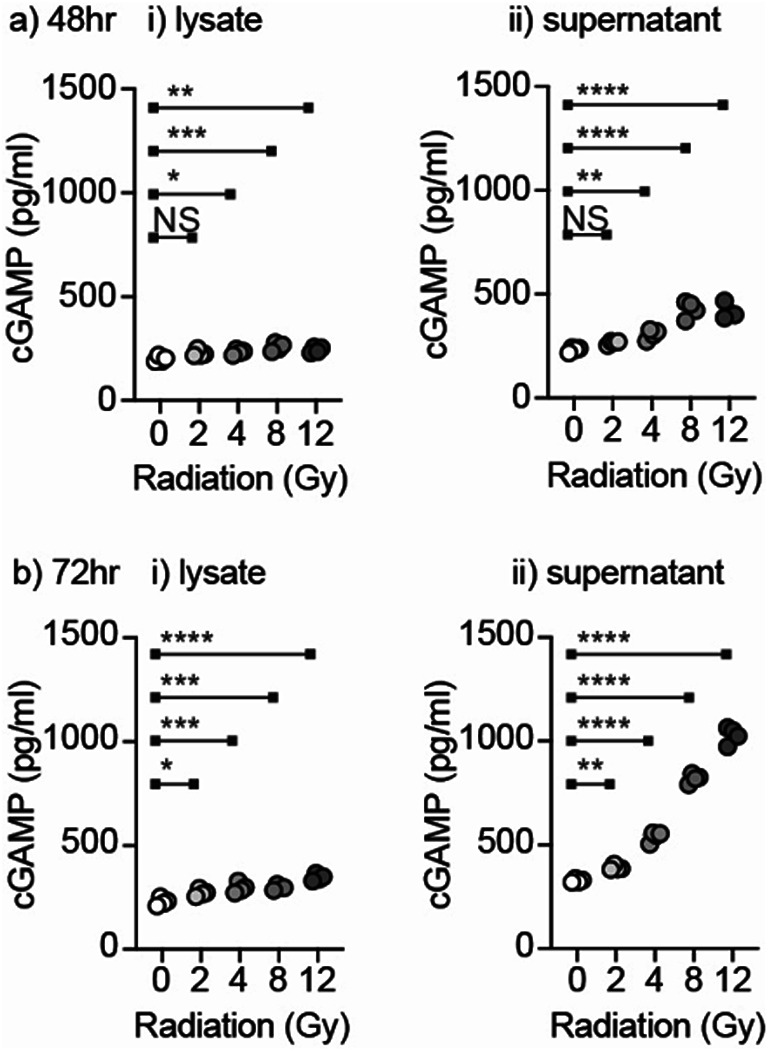
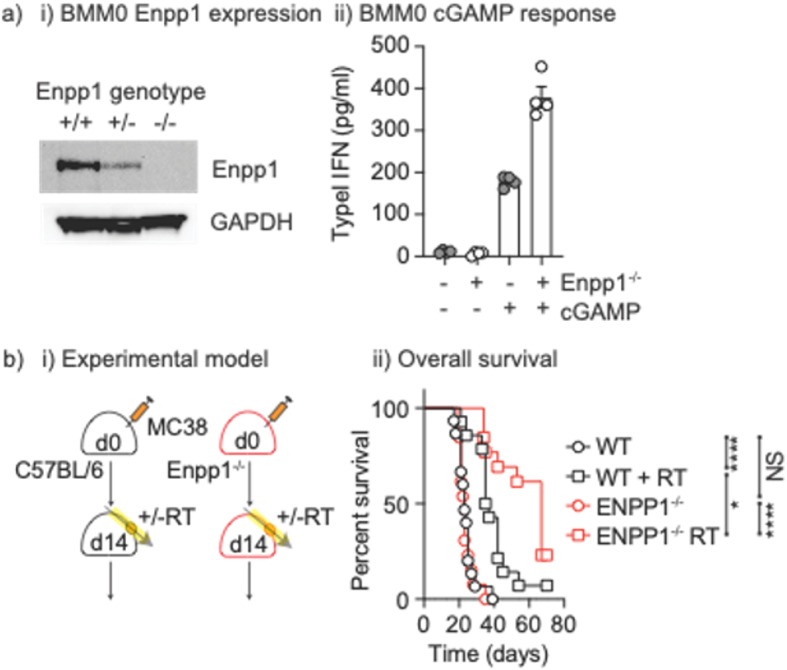
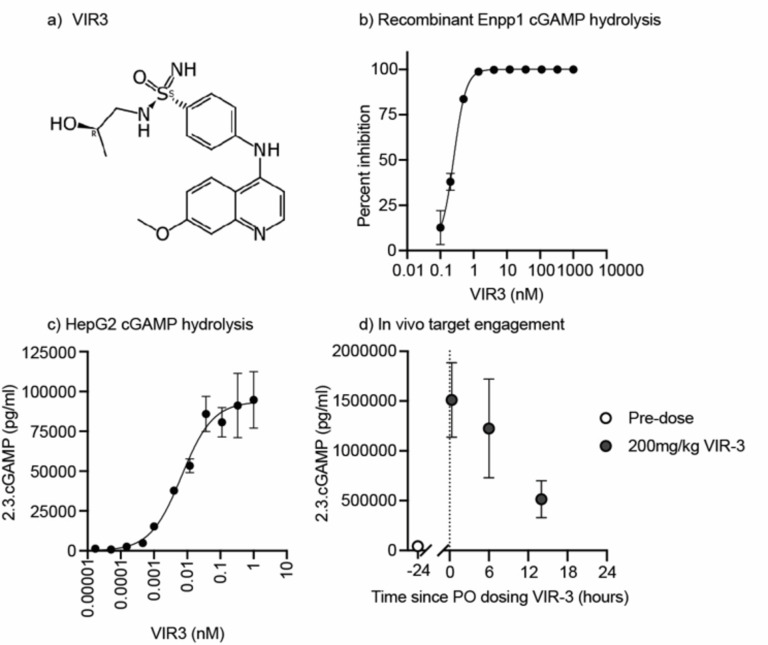
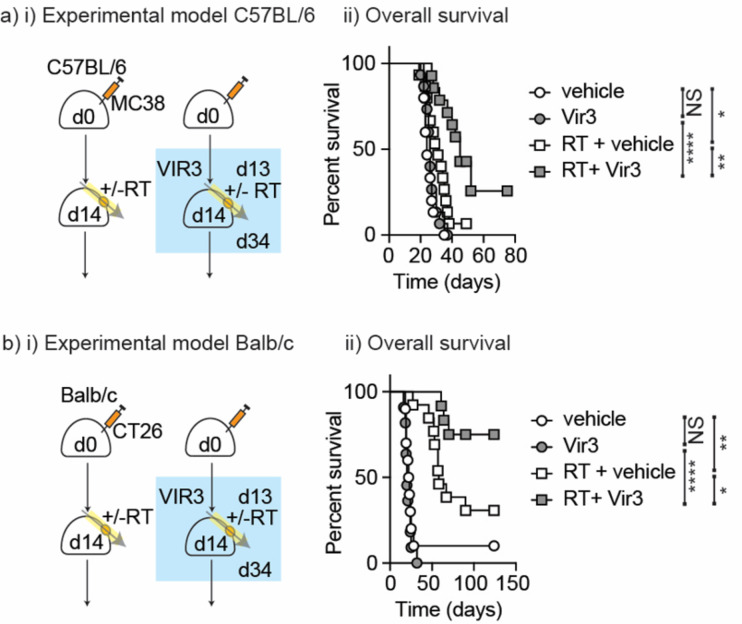
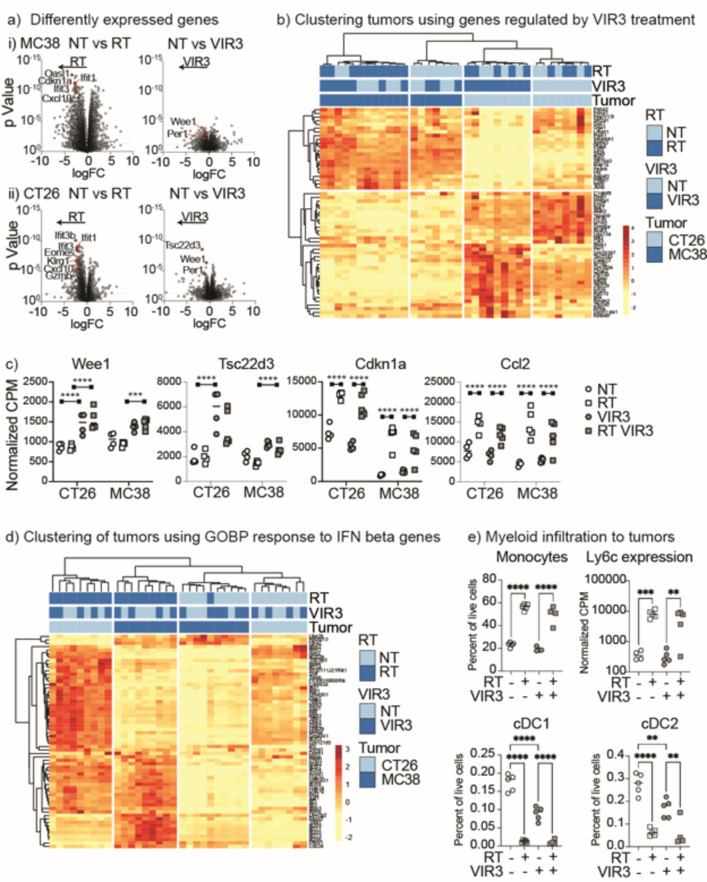
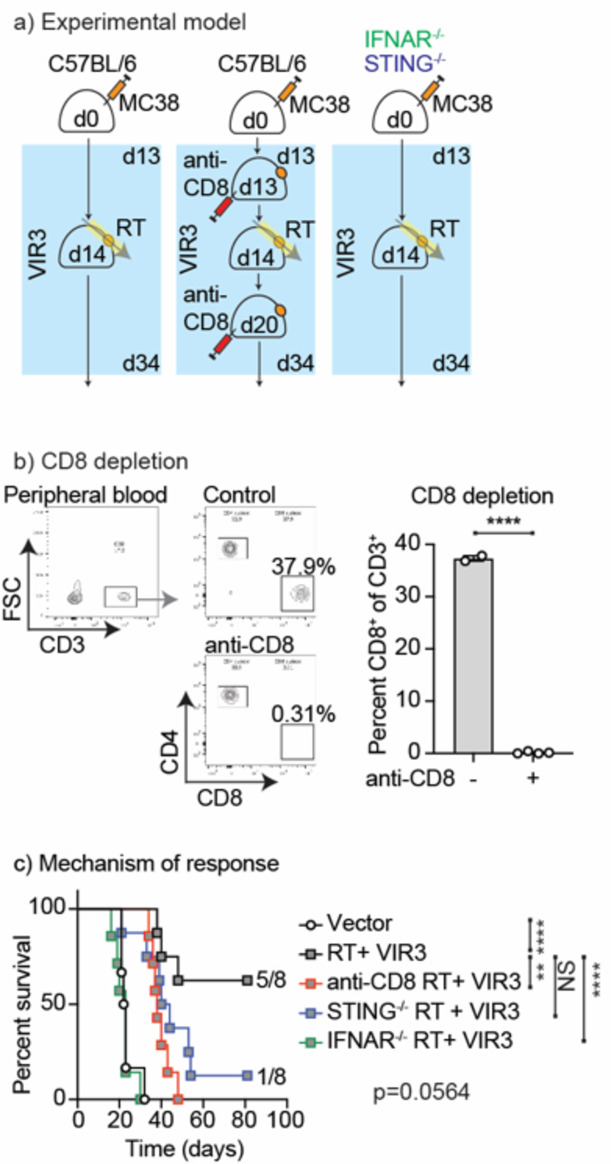
The uniqueness in each person's cancer cells and variation in immune infiltrates means that each tumor represents a unique problem, but therapeutic targets can be found among their shared features. Radiation therapy alters the interaction between the cancer cells and the stroma through release of innate adjuvants. The extranuclear DNA that can result from radiation damage of cells can result in production of the second messenger cyclic guanosine monophosphate-adenosine monophosphate (cGAMP) by cyclic GMP-AMP synthase (cGAS). In turn, cGAMP can activate the innate sensor stimulator of interferon genes (STING), resulting in innate immune activation. Ectonucleotide pyrophosphatase/phosphodiesterase 1 (Enpp1) is a phosphodiesterase that can be expressed by cancer cells that can degrade cGAMP, thus can decrease or block STING activation following radiation therapy, impairing the innate immunity that is critical to support adaptive immune control of tumors. We observed that many human and murine cancer cells lack Enpp1 expression, but that Enpp1 is expressed in cells of the tumor stroma where it limits tumor control by radiation therapy. We demonstrate in preclinical models the efficacy of a novel Enpp1 inhibitor and show that this inhibitor improves tumor control by radiation even where the cancer cells lack Enpp1. This mechanism requires STING and type I interferon (IFN) receptor expression by non-cancer cells and is dependent on CD8 T cells as a final effector mechanism of tumor control. This suggests that Enpp1 inhibition may be an effective partner for radiation therapy regardless of whether cancer cells express Enpp1. This broadens the potential patient base for whom Enpp1 inhibitors can be applied to improve innate immune responses following radiation therapy.


Conflict of interest statement

Declarations. Competing interests: The work was funded in part by a sponsored research agreement with VIR Biotechnology Inc. In addition, the research was funded in part by NCI R01CA182311, NCI R01CA244142, R01CA208644, R21CA277250, and by the Providence Foundation. MJG receives research funding from Bristol Myers Squibb. MRC receives consulting fees from Roche. Authors listed as employees of VIR Biotechnology Inc. and may own stock or other interests in VIR Biotechnology. Authors have no additional conflicts to declare.

Figures

Fig. 1
Fig. 1
Colorectal cancer cells exhibit low or absent Enpp1 expression and require Enpp1 transfection to degrade cGAMP. (a) RNA expression of (i) Enpp1, (ii) cGas, and (iii) Sting1 in a panel of breast, colorectal, and lung adenocarcinoma cell lines present in DepMap portal. Each symbol represents one cell line, with expression as Log2 transcripts per million. (b) Analysis of scRNASeq of a panel of murine tumors highlighting Enpp1 and Sting1 expression in (i) Cancer cells and (ii) stromal cells in MC38 tumors. Scale shows degree of expression by color and the circle size shows the percentage of each cell type that expresses the gene. (c) Analysis of scRNASeq of CD45 + cells in MC38 tumors gated on myeloid cells. (i) TSNE plot showing 6 clustered myeloid populations from MC38 tumors. (ii) Enpp1 expression (red) in clustered populations. Iii) identification of clusters based on key gene expression. (d) (i) Flow cytometry for Enpp1 versus isotype control in murine CT26 and MC38 colorectal carcinoma cell lines, and bone marrow-derived macrophages (BMM0). (ii) Summary of MFI of (i) across replicates. (iii) Recovery of spiked cGAMP from MC38 cells (NT), MC38 cells stably transfected with human Enpp1 (huEnpp1), human Enpp1 T256A mutant (*huEnpp1), or murine Enpp1 (muEnpp1). Key: * p < 0.05; ** p < 0.01; *** p < 0.001; **** p < 0.0001.
Fig. 2
Fig. 2
Radiation results in dose dependent release of cGAMP. MC38 cells were treated with a range of radiation doses and harvested after (a) 48 h or (b) 72 h to assess cGAMP in (i) the cell lysate or (ii) the cell supernatant. Key: NS = not significant * p < 0.05; ** p < 0.01; *** p < 0.001; **** p < 0.0001.
Fig. 3
Fig. 3
Enpp1 knockout results in increased responses to cGAMP and improved responses to radiation treatment. (a) (i) Bone marrow macrophages (BMM0) were generated from wt, Enpp1+/- or Enpp1-/- mice and cell lysates were western blotted for Enpp1 and GAPDH protein expression. Original blots are presented in Supplementary Figure 6. (ii) wt or Enpp1-/- BMM0 were left untreated or treated with cGAMP and type I IFN secretion was determined by bead assay. (b) (i) MC38 cells were injected into wt or Enpp1-/- mice and tumors were allowed to develop for 10-14 days. Mice were randomized to receive no further treatment or 12Gy focal RT to the tumor. (ii) Mice were followed for survival. Key: NS = not significant * p<0.05; ** p<0.01; *** p<0.001; **** p<0.0001.
Fig. 4
Fig. 4
Development of VIR3 Enpp1 Inhibitor(a) Structure of VIR3. (b) Representative data from biochemical assay monitoring recombinant ENPP1 cGAMP hydrolysis activity and inhibition by VIR3. (c) Representative data from cellular assay monitoring cGAMP hydrolysis on HepG2 cells in the presence of VIR3. (d) In vivo target engagement was measured by administering 5ug of 2’3’-cGAMP IV to mice and then collecting blood samples 3 minutes later into a tube containing ENPP1 inhibitors. The level of cGAMP remaining the plasma at the time of collection was measured by ELISA both before VIR3 oral administration (open circles) or after (closed circles) (n = 3-5 mice per group, data is plotted as mean +/-SEM).
Fig. 5
Fig. 5
Treatment with VIR3 Enpp1 inhibitor improves tumor control by RT. (a) (i) MC38 cells were injected into wt mice and tumors were allowed to develop for 14 days. Mice were randomized to receive 21 daily doses of VIR3 or vehicle by oral gavage starting on d13, and further randomized to no further treatment or 12 Gy focal RT to the tumor on d14. (ii) Mice were followed for survival. (b) (i) Treatment as per a) but tumors were CT26 tumors injected into BALB/c mice (ii) Mice were followed for survival. Key: NS = not significant * p < 0.05; ** p < 0.01; *** p < 0.001; **** p < 0.0001.
Fig. 6
Fig. 6
Impact of RT and VIR3 treatment on tumor gene expression. MC38 tumors were established in C57BL/6 mice and CT26 tumors were established in BALB/c mice. Mice were randomized to receive daily doses of VIR3 or vehicle by oral gavage starting on d13, and further randomized to no further treatment or 12 Gy focal RT to the tumor on d14. 4 days following radiation (d18) tumors were harvested and total gene expression in the tumors was analyzed by RNASeq, with 4 tumors for each treatment condition and tumor (32 total). (a) Volcano plots of differential gene expression shown as log fold change by pValue by treatment group. For (i) MC38 or (ii) CT26 tumors the graphs show differential gene expression due to RT alone, or VIR3 treatment alone. A selection of relevant genes are highlighted in red. (b) Expression of genes significantly regulated with FDR correction by VIR3 treatment in untreated (NT vs. VIR3) or irradiated tumors (RT vs. RT + VIR3) were used for cluster analysis. Blue colors indicate samples in each treatment group and the color scale yellow to red shows the degree of expression of each gene with unit variance scaling applied to each gene. (c) Expression of selected genes in each sample, by normalized CPM. Each symbol represents one tumor. (d) Expression of genes represented in the GOBP response to IFN beta genesets across samples. Blue colors indicate samples in each treatment group and the color scale yellow to red shows the degree of expression of each gene with unit variance scaling applied to each gene. (e) Flow cytometry of tumors treated as in a-d) to assess myeloid infiltration. Graphs show each cell type as a percent of all live cells in the tumor. Each symbol represents one tumor. Gene expression of Ly6c2 is also shown as a comparator, by normalized CPM. Each symbol represents one tumor. Key: * p < 0.05; ** p < 0.01; *** p < 0.001; **** p < 0.0001.
Fig. 7
Fig. 7
Mechanisms of tumor control by RT and VIR3. (a) MC38 tumors were established in wt, IFNAR1−/−, or STING−/− mice. Mice were randomized to receive daily doses of VIR3 or vehicle by oral gavage starting on d13 and 12 Gy focal RT to the tumor on d14. A group of mice receiving combined RT + VIR3 were also treated with 3 weekly doses of anti-CD8 depleting antibodies starting on d13. (b) The impact of anti-CD8 on the depletion of CD8 T cells in the peripheral blood was assessed. Graphs show representative flow cytometry of peripheral blood gating on CD3 + cells and subgating for CD4 and CD8 T cells. The graph shows quantification of CD8 T cells between treatment and control groups. (c) Overall survival of mice treated as in (a). Key: NS = not significant * p < 0.05; ** p < 0.01; *** p < 0.001; **** p < 0.0001.

References

    1. Kim, A. & Cohen, M. S. The discovery of vemurafenib for the treatment of BRAF-mutated metastatic melanoma. Expert Opin. Drug Discov. 11, 907–916. 10.1080/17460441.2016.1201057 (2016). - PMC - PubMed
    1. Yang, H. et al. RG7204 (PLX4032), a selective BRAFV600E inhibitor, displays potent antitumor activity in preclinical melanoma models. Cancer Res.70, 5518–5527. 10.1158/0008-5472.Can-10-0646 (2010). - PubMed
    1. Garcia, J. et al. Bevacizumab (Avastin(R)) in cancer treatment: a review of 15 years of clinical experience and future outlook. Cancer Treat. Rev.86, 102017. 10.1016/j.ctrv.2020.102017 (2020). - PubMed
    1. Pages, F. et al. International validation of the consensus immunoscore for the classification of colon cancer: a prognostic and accuracy study. Lancet391, 2128–2139. 10.1016/S0140-6736(18)30789-X (2018). - PubMed
    1. Galon, J. et al. Type, density, and location of immune cells within human colorectal tumors predict clinical outcome. Science313, 1960–1964. 10.1126/science.1129139 (2006). - PubMed

Substances