. 2024 Dec 2;15(1):10468.
doi: 10.1038/s41467-024-54874-y.

Regulatory T cells crosstalk with tumor cells and endothelium through lymphotoxin signaling

Affiliations

Regulatory T cells crosstalk with tumor cells and endothelium through lymphotoxin signaling

Wenji Piao et al. Nat Commun. .

Abstract

Regulatory T cells (Tregs) with multifaceted functions suppress anti-tumor immunity by signaling surrounding cells. Here we report Tregs use the surface lymphotoxin (LT)α1β2 to preferentially stimulate LT beta receptor (LTβR) nonclassical NFκB signaling on both tumor cells and lymphatic endothelial cells (LECs) to accelerate tumor growth and metastasis. Selectively targeting LTβR nonclassical NFκB pathway inhibits tumor growth and migration in vitro. Leveraging in vivo Treg LTα1β2 interactions with LTβR on tumor cells and LECs, transfer of wild type but not LTα-/- Tregs promotes B16F10 melanoma growth and tumor cell-derived chemokines in LTβR-/- mice; and increases SOX18 and FLRT2 in lymphatic vessels of LTβR-/- melanoma. Blocking the nonclassical pathway suppresses tumor growth and lymphatic metastasis by reducing chemokine production, restricting Treg recruitment to tumors, and retaining intratumoral IFNγ+ CD8 T cells. Our data reveals that Treg LTα1β2 promotes LTβR nonclassical NFκB signaling in tumor cells and LECs providing a rational strategy to prevent Treg promoted tumor growth and metastasis.


Conflict of interest statement

Competing interests: J.S.B., W.P., and X.Y. are inventors on a patent related to LTβR antagonists entitled “Inhibitors of LTβR-NFκB signaling pathways for treating inflammation and cancer” (Patent number: 11590202). The remaining authors declare no competing interests.

Figures

Fig. 1
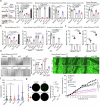
Fig. 1. High LTβR expression in tumors is associated with poor survival in cancer patients.
a Kaplan–Meier survival analysis of LTβR expression (derived from Human Protein Atlas and TCGA data) in various cancer cohorts. “Low” versus “high” data segregated based on one standard deviation below or above the mean expression of LTβR, Mantel–Cox log-rank test. b The violin and box plots depict the differential expression of selected genes across skin cutaneous melanoma (n = 472 samples) reveals that increased LTβR gene expression is comparable with various oncogenes. The inset box bounds the interquartile range divided by the median, with the whiskers extending to a maximum of 1.5 times the interquartile range beyond the box. c Principal component analysis (PCA) from TCGA melanoma cohort for LTβR “high” versus “low” LTβR subsets (n = 59, 60, respectively). df Volcano plot analysis evaluating differentially expressed genes (DEGs) from LTβR “high” versus “low” LTβR cohort of TCGA skin cutaneous melanoma patients (n = 35, 43, respectively) (d), n = 3285; breast cancer patients (n = 96, 130, respectively) (e), n = 2134; and lung cancer patients (n = 68, 39, respectively) (f), n = 3285, adjusted p value <0.05 and >2-fold change in gene expression. g Gene ontology (GO) enrichment analysis in 272 GO terms for TCGA skin cutaneous melanoma. The p value reflects the association between a set of genes in the TGCA dataset and a biological function is significant (adjusted p value <0.01). The top ten statistically significant pathways are shown. P values are calculated using a two-tailed t-test and adjusted using Benjamini and Hochberg’s approach. Source data are provided as a Source Data file.
Fig. 2
Fig. 2. Tumor LTβR signals by classical NFΚB and nonclassical NFΚB pathways.
a Flow cytometry of LTβR expression on mouse (B16F10) and human (A375) melanoma cells. Median fluorescence intensity (MFI) shown. b, c Immunoblots for classical IKKα/β (p-IKKα/β) (***P = 0.0005) and NFκB-p65 phosphorylation (p-p65) (*P = 0.0109, **P = 0.0021) (b), and nonclassical p100 processing to p52 (*P = 0.0459) (c) in B16F10 pretreated with 20 μM ciLT, nciLT, or control scrambled peptide (CP) for 1 h at 37 oC; and then stimulated with or without agonist anti-LTβR 3C8 mAb (2 μg/mL) for indicated times (b) or 6 h (c). Representative blots shown, quantification of phospho-p65 or p52 and IKKα/β are normalized to p65 and IKKα/β respectively. d Immune precipitation of B16F10 LTβR with anti-LTβR mAb (5G11). Cells stimulated with or without agonist anti-LTβR mAb for 10 min. Representative blots are shown. Quantification of the bound TRAF2 (**P = 0.0004, ***p = 0.0001) or TRAF3 (**P = 0.0004, ***p = 0.0001) is normalized to the loaded LTβR expression. WCL whole cell lysate. e, f Human melanoma A375 cells pretreated with 20 μM human ciLT (hciLT), nciLT, or CP for 1 h at 37 oC; and then stimulated with or without 100 ng/mL human recombinant LTαβ for indicated times (e) or 6 h (f). Immunoblots for p-IKKα/β, p-p65 (nciLT: **P = 0.0019; ***P = 0.0001; ciLT: *P = 0.0407, ***P = 0.0002), and p52 (*P = 0.0242). Each panel is representative of three independent experiments. bf Mean ± SEM. P values are calculated by two-way ANOVA, Sidak’s multiple comparisons test. ****P < 0.0001. Uncropped gels and Source data are provided as a Source Data file.
Fig. 3
Fig. 3. Most tumors use nonclassical NFΚB signaling for lymphatic migration.
a Transwell assay of mouse cancer cell lines. Mouse melanoma B16F10 (n = 4), mouse breast cancer 410 (n = 3), mouse sarcoma KPI30 (n = 4), mouse ovarian cancer ID8 (n = 4), and mouse mammary adenocarcinoma 66.1 (n = 4) cells pretreated with 20 μM each of nciLT, ciLT, nciLT combined with ciLT, or CP for 1 h at 37 oC; or treated with 2 μg/mL agonist anti-mouse LTβR Ab (3C8) for 1 h at 37 oC, washed and loaded for TEM across mouse LECs toward 200 μM S1P for 16 h. b Transwell assay of human cancer cell lines. Human melanoma A375 (n = 4), human breast cancer MDA-MB-231 (n = 3), human lung cancer A549 (n = 4) cells pretreated with 20 μM each of nciLT, hciLT, nciLT combined with hciLT, or CP for 1 h at 37 oC; or treated with 100 ng/mL human LTβR ligand huLTαβ for 1 h at 37 oC, washed and loaded for TEM across human LECs toward 200 μM S1P for 16 h. c Transwell TEM assay of mouse or human sarcoma cells toward medium or 200 μM S1P crossing the 8 μm Boyden chamber coated with or without mouse or human LECs, respectively. d Representative images (n = 4) of cell migration into the area of the defect after scratching confluent B16F10 monolayers treated with indicated blocking peptides. Migration into the area of cell defect was measured after 16 h. Magnification 10x; scale bar 450 μm. e Representative images (n = 4) of mouse breast cancer 4T1-eGFP migration into the area of cell defect at 0 and 16 h after treatment with indicated peptides. Area recovery was measured with time-lapse microscopy. Each peptide-treated group was compared to the nontreated using a paired two-tailed t-test, *p = 0.0181, ****p < 0.0001. Magnification 10x; scale bar 220 μm. f Time-lapse microscopy of WT B16F10-GFP pretreated with peptides as in (ac). Samples run in triplicates. g TEM of WT or LTβR−/− B16F10 across transwell coated with or without mouse LECs toward 200 μM S1P for 16 h. One representative of three images was taken. 20x magnification. Representative of 2 (eg) or 3 (ad) independent experiments. Mean ± SEM. ****p < 0.0001 by one-way ANOVA. Source data are provided as a Source Data file.
Fig. 4
Fig. 4. Tumors use LTβR nonclassical NFΚB signaling for tumor growth.
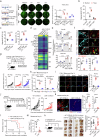
a In vitro cell growth of WT or LTβR−/−B16F10 pretreated with 20 μM of CP, nciLT, or ciLT for 1 h. Cell numbers counted after 24, 48 (***p = 0.0004), 72 h (****p < 0.0001), 96 h (****p < 0.0001). P values are calculated by two-way ANOVA and Dunnett’s multiple comparisons test. b Cell viability analysis of B16F10 treated with indicated peptide with or without anti-LTβR mAb (3C8) for 1 h and then assessed by MTT assay. c Flow cytometry apoptotic cell analysis of Annexin V+ B16F10 pretreated with indicated peptides for 1 h, and then stimulated with or without anti-LTβR mAb for 5 or 16 h. ****P < 0.0001 by two-way ANOVA. dh C57BL/6 mice intradermally transferred with WT or CRISPR/Cas9 LTβRKO (LTβR−/−) B16F10. Scheme of experimental setup and tumor growth (n = 7). Two-way ANOVA, Sidak’s multiple comparisons test. **P = 0.0014; *P = 0.0122. (d) Six representative tumors and their weights are shown (e). ****P = 0.0007 by unpaired two-tailed t-test. At day 20, Draining LNs (DLNs) were analyzed for Melan-A expression of metastatic B16F10 cells in dLNs by immunohistochemistry (f). Representative images (n = 8). Magnification 20x; scale bar 42 μm. **P = 0.0037 by unpaired two-tailed t-test. At day 13, transferred B16F10-GFP tumors analyzed for CXCL1 (n = 4, ***p = 0.0002), CXCL10 (n = 4, ****P < 0.0001), and PDPN (n = 6, (****P < 0.0001) expression in GFP+B16F10 cells (g), and also analyzed for CD4 (*P = 0.0294), CD8, Foxp3+ CD4 Tregs (**P = 0.0025), B220+B cells (**P = 0.0013), CD11b+Ly6G+MDSCs (****P < 0.0001) in TILs (n = 6), and CD4, CD8, B cells (***p = 0.0001) and CD25+Foxp3 + CD4 Tregs in dLNs (n = 6) (h). P values are calculated by unpaired two-tailed t-test. The gating strategy is shown (g, h). i Volcano plot of differential gene expression comparing LTβR-/- to WT B16F10 (P values are justified by two-way ANOVA) by bulk RNA-Seq analysis (n = 2). Genes upregulated (n = 323, green) or downregulated (n = 859, red) at log2 fold change ≥2 or ≤−2 and P value <0.05 adjusted by the Benjamin and Hochberg method. 3 (ac) or 2 (dh) independent experiments. ah Mean ± SEM. Source data are provided as a Source Data file.
Fig. 5
Fig. 5. Treg LTα1β2 stimulates tumor LTβR nonclassical NFΚB pathway to promote tumor growth and TEM.
ad Bulk RNA-Seq analysis of B16F10 (2 independent samples per group). Genes are downregulated by nciLT (a) or ciLT (c) and regulated by NIK (a) or IKKβ (c)-deficiency. WT or CRISPR/Cas9 NIK KO B16F10 pretreated with nciLT for 1 h followed by 6 h anti-LTβR (3C8) stimulation (a, b). WT or CRISPR/Cas9 IKKβ KO B16F10 treated with ciLT for 1 h prior to 1 h LTβR stimulation (c, d). Selected genes confirmed by RT-PCR for nonclassical (b) and classical (d) regulation. Relative gene expressions are normalized to HPRT gene expression. Samples are triplicated in three independent experiments. Mean ± SEM. ***p = 0.0001, ****p < 0.0001 by one-way ANOVA. eg Immunoblots for p100/p52 in human A357 (left panel of e, g) and mouse B16F10 (right panel of e, f) melanoma cells cocultured with various dose of human or mouse Tregs, Teffs, or LTα-deficient (LTα−/−) Tregs as indicated for 5 h. A375 pretreated with 20 μM CP, nciLT, or hciLT for 1 h prior to coculturing with human T cells (g). Representative blots are shown from three independent experiments. Quantification of the protein expression of P52 normalized to p65. Uncropped gels are provided in the Source Data file. Mean ± SEM. ***p = 0.0002, ****p < 0.0001 by one-way ANOVA. h B16F10 pretreated with 20 μM CP, nciLT, or ciLT for 1 h, washed, and cocultured with Tregs for 6 h, washed and grown for 48 h. One representative of three images taken from each group is shown. **p = 0.0036, ***p = 0.0005 by one-way ANOVA. im Migration of B16F10 cocultured with Tregs or Teffs with various ratio (i), Compared to B16F10 only, ***p = 0.0006 (1:2), ***p = 0.0002 (2:2), ****p < 0.0001. Migration of B16F10 cocultured with WT (****p < 0.0001) or LTα-/-Tregs (j, k) as indicated for 6 h, washed, and migrated across transwell coated with LECs (****p < 0.0001) or without LEC toward 200 μM S1P for 16 h (j). B16F10 pretreated with indicated peptides before coculturing with WT or LTα−/− Tregs and TEM as in (h, k). ***p = 0.0003. TEM of breast cancer 4T1 cells (l) or B cell lymphoma M12.4 cells (m) cocultured with WT or LTα −/− Tregs with various ratios. n, o 0.5 × 106 WT or LTα-deficient (LTα−/−) Tregs intravenously transferred to LTβRKO (LTβR−/−) C57BL/6 mice which were subcutaneously inoculated with 0.5 × 106 WT B16F10. Scheme of experimental setup and tumor growth (n). p value of tumor growth (n = 5 mice) determined by two-way ANOVA Tukey’s multiple comparisons test. *p = 0.0394, ***p = 0.0008, ****p < 0.0001. At day 14, tumors (n = 5) analyzed for CXCL1 (****p < 0.0001), CXCL10 (***p = 0.0002), and CCL5 (***p = 0.0004) expression. Data representative of 3 (b, d, em) and 2 (n, o) independent experiments. b, d, ei: Mean ± SEM. ****p < 0.0001 by one-way ANOVA. Source data are provided as a Source Data file.
Fig. 6
Fig. 6. Tregs communicate with LEC through LTα1β2/LTβR signaling to activate nonclassical NFΚB pathway and promote tumor growth and TEM.
a Peptide-pretreated LEC cocultured with Tregs or Teffs (LEC: T cell = 1: 2) for 16 h, followed by removal of T cells, and then LEC cocultured with B16F10-GFPs (LEC: B16F10 = 1:1) for 48 h. Representative images of B16F10-GFPs in triplicated wells analyzed by EVOS microscopy. b, c Transwell assay, B16F10-GFPs migrated across WT or LTβR−/− LECs pretreated with or without Tregs as in (a, b). B16F10 or 4T1 cells migrated across LECs pretreated with WT or LTα−/−Tregs for 16 h (c). d Heatmap of gene array analysis of mouse primary dermal LECs treated with nciLT and ciLT. LECs were treated with 20 μM nciLT or ciLT for 30 min prior to LTβR stimulation with anti-LTβR Ab (3C8) for 4 h. Three independent samples per group. e Regulated genes selected for real-time PCRs. Mouse LECs pretreated with 20 μM indicated peptides for 30 min, washed and treated with or without anti-LTβR Ab (3C8) for 6 h. Triplicated samples were measured in three independent experiments. *p = 0.03, ****p < 0.0001 by one-way ANOVA. f Immunohistochemistry of intercellular VE-cadherin in lymphatic vessels (LV) or cultured LECs pretreated with WT or LTα−/−Tregs for 16 h. One representative of four images of each group. Magnification 60x; scale bar:14 μm (LV) and 7 μm (LEC). gi Intravenous transfer of WT or LTα−/−Tregs (5 × 105) to WT C57BL/6 mice subcutaneously inoculated with LTβRKO B16F10 (5 × 105). Scheme of experimental setup and tumor growth (g). p value of tumor growth (n = 6) determined by two-way ANOVA Tukey’s multiple comparisons test. **p = 0.0017, ****p < 0.0001. At day 14, tumors (n = 4) were analyzed for CXCL1 and CXCL10 expression in LECs by flow cytometry analysis (h); One representative of 6 images of FLRT2 expression in tumor LECs by Immunohistochemistry (i). Magnification 20x; scale bar:42 μm. jm Intradermal transfer of B16F10 cells (5 × 105) to WT or LTβR−/− C57BL6 mice. p value of tumor growth (n = 8) calculated by two-way ANOVA, Sidak’s multiple comparisons test, *p = 0.0362, ****p < 0.0001 (j). One representative of eight images of tumor (day 20) blood (CD31+Lyve-1) and lymphatic (Lyve-1+) vessels by immunohistochemistry (magnification 20x; scale bar 40 μm) (k), mouse survival (10 mice each group) (l) p value is calculated by log-rank (Mantel–Cox) test, *p = 0.025. and intratumoral Foxp3+CD25+Tregs (***p = 0.0002) in 6 tumors (day 13) from WT or LTβR−/− C57BL6 mice by flow cytometry (m). n Lung colonization assessed at 3 weeks after tail vein injection of 3 × 105 B16F10 cells with or without primary mouse LECs (1 × 105) to WT or LTβR-/- C57BL6 mice (n = 8 per group, five representative lung images per group shown). **p = 0.0023, ***p = 0.0009. Representative of 3 (ac, e, f) and 2 (gn) independent experiments shown. an Mean ± SEM. ****p < 0.0001 by one-way ANOVA (ac, e, f, h, i, n) or unpaired two-tailed t-test (k, m). Source data are provided as a Source Data file.
Fig. 7
Fig. 7. Blockade of LTβR-nonclassical NFΚB inhibits tumor growth, immune suppressive cell recruitment, and tumor angio- and lymphangiogenesis.
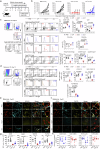
a, b Intradermally transferred B16F10 melanoma in C57BL6 mice treated with an intratumoral or peritumoral injection of 10 nmol per tumor of nciLT, ciLT, or CP for 5 days. Scheme of tumor treatment (a). Tumor growth (b), ten mice in each cohort except for the nciLT-treated group (n = 12). p values are calculated by comparing each peptide-treated group to the PBS group at days 7, 10, 13, 16, and 20 using an unpaired two-tail t-test. **** p < 0.0001, ** p = 0.0045 (nciLT and ciLT day 10); p = 0.008 (ciLT day 16), *p = 0.0405. c, d At day 13, tumors (n = 4) analyzed for CD4, CD8, Foxp3+ CD4 Tregs and T cell IFNγ (c), Ly6G+CD11b+ MDSCs, CXCL1, and CXCL10 expression in CD45 CD31PDPN cells or Lyve-1+ PDPN+ LECs (d) by flow cytometry. Some samples were measured two more times in separate staining procedures to reach the accuracy (CD4, CD8, CXCL10, and MDSC). Gating strategy shown (c, d). e, f At day 20, tumors were assessed for angiogenesis (CD31+/Lyve-1) and lymphangiogenesis (CD31+/Lyve-1+) by immunohistochemistry and analyzed for SOX18 (e) and FLRT2 (f). Representative of eight images of each group. Magnification 20x, scale bar:42 μm. g, h Expression on CD31+/Lyve-1+ lymphatic vessels and CD31+/Lyve-1 blood vessels of tumors (n = 5). MFIs (g) and quantification of co-localization between SOX18 or FLRT2 and lymphatic or blood vessels (h). Representative of 2 (ah) independent experiments shown. ch: Mean ± SEM. *p = 0.0116, **p = 0.0019, ***p = 0.0005, ****p < 0.0001 by one-way ANOVA. Source data are provided as a Source Data file.
Fig. 8
Fig. 8. Blockade of LTβR-nonclassical NFΚB signaling reduces CD4 Tregs in dLNs and suppresses melanoma lymphatic metastases.
a, b Same as in Fig. 7, B16F10 melanoma-bearing C57BL/6 mice treated with a peritumoral injection of 10 nmol/tumor of nciLT, ciLT, or CP for 5 days. At day 13, dLNs (n = 4) analyzed for CD4, CD8, CD25+, or CD25 Foxp3+ CD4 Tregs by flow cytometry (a). The gating strategy is shown. Draining LNs (n = 5 per group) at day 20 assessed for tumor metastasis (Melan-A), Tregs (Foxp3), and lymphangiogenesis (Lyve-1) by immunohistochemistry (b). Representative image with scale bar: 500 μm. a, b. Representative of two independent experiments. Mean ± SEM. **p = 0.0015, ****p < 0.0001 by one-way ANOVA. Source data are provided as a Source Data file.

References

    1. Lukashev, M. et al. Targeting the lymphotoxin-beta receptor with agonist antibodies as a potential cancer therapy. Cancer Res.66, 9617–9624 (2006). - PubMed
    1. Gommerman, J. L. & Browning, J. L. Lymphotoxin/light, lymphoid microenvironments and autoimmune disease. Nat. Rev. Immunol.3, 642–655 (2003). - PubMed
    1. Piao, W. et al. Regulation of T cell afferent lymphatic migration by targeting LTbetaR-mediated non-classical NFkappaB signaling. Nat. Commun.9, 3020 (2018). - PMC - PubMed
    1. Wolf, M. J., Seleznik, G. M., Zeller, N. & Heikenwalder, M. The unexpected role of lymphotoxin beta receptor signaling in carcinogenesis: from lymphoid tissue formation to liver and prostate cancer development. Oncogene29, 5006–5018 (2010). - PubMed
    1. Keats, J. J. et al. Promiscuous mutations activate the noncanonical NF-kappaB pathway in multiple myeloma. Cancer Cell12, 131–144 (2007). - PMC - PubMed

Publication types

MeSH terms

Associated data