. 2024 Dec 2;14(1):29872.
doi: 10.1038/s41598-024-80391-5.

Proteomic analysis of plasma and duodenal tissue in celiac disease patients reveals potential noninvasive diagnostic biomarkers

Affiliations

Proteomic analysis of plasma and duodenal tissue in celiac disease patients reveals potential noninvasive diagnostic biomarkers

Na Li et al. Sci Rep. .

Abstract

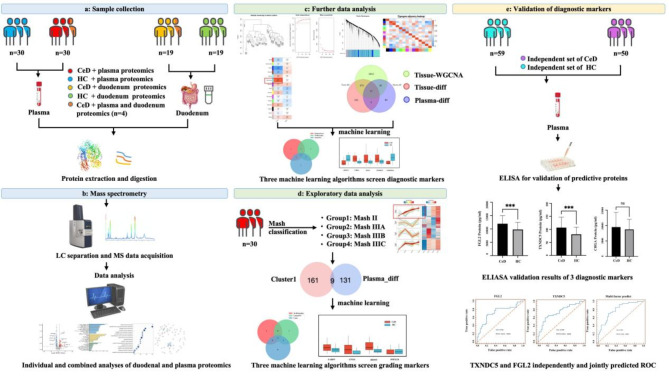
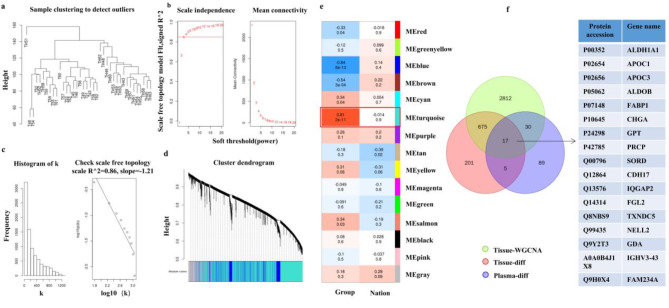
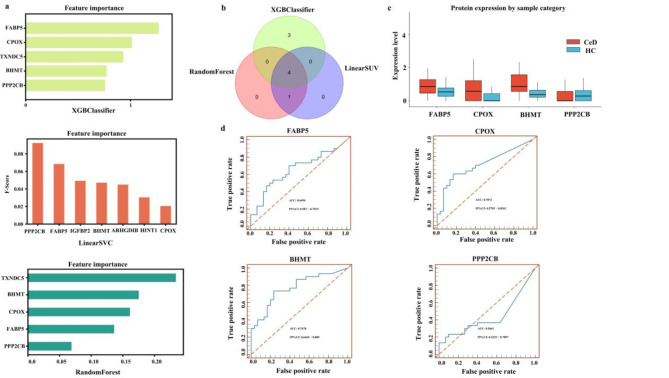
The pathogenesis of celiac disease (CeD) remains incompletely understood. Traditional diagnostic techniques for CeD include serological testing and endoscopic examination; however, they have limitations. Therefore, there is a need to identify novel noninvasive biomarkers for CeD diagnosis. We analyzed duodenal and plasma samples from CeD patients by four-dimensional data-dependent acquisition (4D-DIA) proteomics. Differentially expressed proteins (DEPs) were identified for functional analysis and to propose blood biomarkers associated with CeD diagnosis. In duodenal and plasma samples, respectively, 897 and 140 DEPs were identified. Combining weighted gene co-expression network analysis(WGCNA) with the DEPs, five key proteins were identified across three machine learning methods. FGL2 and TXNDC5 were significantly elevated in the CeD group, while CHGA expression showed an increasing trend, but without statistical significance. The receiver operating characteristic curve results indicated an area under the curve (AUC) of 0.7711 for FGL2 and 0.6978 for TXNDC5, with a combined AUC of 0.8944. Exploratory analysis using Mfuzz and three machine learning methods identified four plasma proteins potentially associated with CeD pathological grading (Marsh classification): FABP, CPOX, BHMT, and PPP2CB. We conclude that FGL2 and TXNDC5 deserve exploration as potential sensitive, noninvasive diagnostic biomarkers for CeD.

Keywords: 4D-DIA proteomics; Biomarker; Celiac disease; Machine learning; Marsh classification; WGCNA.


Conflict of interest statement

Declarations. Ethical approval: The project received approval from the Ethics Committee of the Xinjiang Uyghur Autonomous Region People’s Hospital (KY20220311067 and KY2023013103). Each participant was given a written informed consent form, stating that the specimens collected would be used for pathological examination and related medical research. Conflict of interest: The authors declare no conflicts of interest.

Figures

Fig. 1
Fig. 1
Study workflow. a: Study population and sample collection in the discovery phase. b: Liquid chromatography separation, mass spectrometry data acquisition, and bioinformatics analysis. c: Potential plasma diagnostic markers were identified through weighted gene co-expression network analysis and machine learning methods. d: The Mfuzz method and machine learning were used to explore the plasma protein candidate biomarkers for small intestinal villus atrophy in CeD. e: Study population and plasma samples collected for enzyme-linked immunosorbent assay in the validation phase. Software used for image creation: WPS Office (Version 6.10.1; www.wps.com).
Fig. 2
Fig. 2
Proteomic analysis of duodenal samples from patients with celiac disease. a: Volcano plot of DEPs. b. Heat map of DEPs. c. Histogram of the GO analysis. d. KEGG enrichment analysis of the DEPs. Proteomic analysis of plasma samples from patients with CeD. e: Volcano plot of DEPs. f. Heat map of DEPs. g. Histogram of the GO analysis. h. KEGG enrichment analysis of the DEPs.
Fig. 3
Fig. 3
Identification of diagnostic hub proteins. a. Sample-level clustering by WGCNA b. Power curve. c. Topology distribution diagram. d. Module-level clustering tree and module overview. e. Heat map of the correlation between modules and phenotypes. f. Venn diagram.
Fig. 4
Fig. 4
Machine learning selects feature molecules and validates them in independent populations. a. The significance contribution scores of the eight features identified by XGBClassifier, LinearSVC, and RandomForest. b. Venn diagram for the three machine learning methods. c. The difference in the distribution of the five selected features between the different sample categories. d. Histogram of the ELISA results for the FGL2, TXNDC5, and CHGA proteins. e. ROC curve for FGL2, TXNDC5, and CHGA proteins.
Fig. 5
Fig. 5
Expression pattern clustering. a. Expression pattern cluster analysis summary graph. b. Venn diagram of cluster 1 and plasma differentially expressed proteins.
Fig. 6
Fig. 6
Three machine learning methods to screen characteristic molecules. a. The significance contribution scores of the features identified by XGBClassifier, LinearSVC, and RandomForest. b. Machine learning Venn diagram of the three algorithms. (c) Difference in the distribution of the four characteristics between different sample categories. (d) ROC curve of the FABP5, CPOX, BHMT and PPP2CB proteins.

Similar articles

References

    1. Catassi, C. et al. Coeliac disease. Lancet399 (10344), 2413–2426 (2022). - PubMed
    1. Iversen, R. & Sollid, L. M. The Immunobiology and Pathogenesis of Celiac Disease. Annu. Rev. Pathol.18, 47–70 (2023). - PubMed
    1. Singh, P. et al. Who to screen and how to screen for celiac disease. World J. Gastroenterol.28 (32), 4493–4507 (2022). - PMC - PubMed
    1. Mehta, S. et al. Impact of delay in the diagnosis on the severity of celiac disease. J. Gastroenterol. Hepatol.39 (2), 256–263 (2024). - PubMed
    1. Laurikka, P. et al. Review article: systemic consequences of coeliac disease. Aliment. Pharmacol. Ther.56 (Suppl 1), S64–S72 (2022). - PMC - PubMed