. 2024 Dec 2;11(1):1313.
doi: 10.1038/s41597-024-04047-9.

Borrelia PeptideAtlas: A proteome resource of common Borrelia burgdorferi isolates for Lyme research

Affiliations

Borrelia PeptideAtlas: A proteome resource of common Borrelia burgdorferi isolates for Lyme research

Panga J Reddy et al. Sci Data. .

Abstract

Lyme disease is caused by an infection with the spirochete Borrelia burgdorferi, and is the most common vector-borne disease in North America. B. burgdorferi isolates harbor extensive genomic and proteomic variability and further comparison of isolates is key to understanding the infectivity of the spirochetes and biological impacts of identified sequence variants. Here, we applied both transcriptome analysis and mass spectrometry-based proteomics to assemble peptide datasets of B. burgdorferi laboratory isolates B31, MM1, and the infective isolate B31-5A4, to provide a publicly available Borrelia PeptideAtlas. Included are total proteome, secretome, and membrane proteome identifications of the individual isolates. Proteomic data collected from 35 different experiment datasets, totaling 386 mass spectrometry runs, have identified 81,967 distinct peptides, which map to 1,113 proteins. The Borrelia PeptideAtlas covers 86% of the total B31 proteome of 1,291 protein sequences. The Borrelia PeptideAtlas is an extensible comprehensive peptide repository with proteomic information from B. burgdorferi isolates useful for Lyme disease research.


Conflict of interest statement

Competing interests: The authors declare no competing interests.

Figures
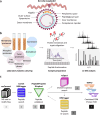
Fig. 1
Fig. 1
Overview of experimental workflow for the development of the Borrelia PeptideAtlas. (a) Cartoon depiction of the Borrelia burgdorferi structure. (b) Experiment workflow. B. burgdorferi was cultured in different environmental conditions, including log phase, stationary phase, and stress conditions for total proteome analysis. Different enrichment assays were applied for the analysis of the secretome, the membrane proteome, phosphoproteome, and acetylation. Samples were prepared directly for LC-MS analysis, or alternatively fractionated prior to LC-MS. (c) Trans-Proteomic Pipeline (TPP) workflow used for the Borrelia PeptideAtlas assembly. Further details in Methods.
Fig. 2
Fig. 2
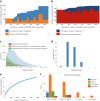
Borrelia PeptideAtlas experiment contribution. (a) Number of peptides which contributed to each experiment, and the cumulative number of distinct peptides for the build as of that experiment. (b) Cumulative number of canonical proteins contributed by each experiment. Height of red bar is the number of proteins identified in experiment; height of blue bar is the cumulative number of proteins; width of the bar (x-axis) shows the number of spectra identified (PSMs), above the threshold, for each experiment. (c) Frequency distributions of peptide length by number of amino acids. The figure shows frequency of distinct peptides (in blue), distinct tryptic peptides with no missed cleavages (in orange), and theoretical, i.e., not observed, tryptic peptides with no missed cleavage (in green). (d) Frequency distributions of peptide charge. (e) Relative protein sequence coverage for canonical proteins based on sequence coverage, i.e., the % of amino acids of the primary sequence which were identified. (f) Histogram showing the frequency distribution of PSMs of phosphorylated sites (false positive-alanine, serine, threonine, and tyrosine), identified for B31 UniProt core proteome, according to PTMProphet probability (P). P ranges from 0.8 to 0.99. no-choice: shows PSMs with only one possible phosphorylation site available, hence P = 1. Blue, yellow, green, and red bars indicate alanine, serine, threonine, or tyrosine phosphorylated sites, respectively.
Fig. 3
Fig. 3
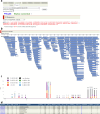
Borrelia PeptideAtlas view of outer OspA phosphorylated sites. OspA UniProt entry P0CL66. Example of the protein PTM summary on the Borrelia PeptideAtlas. (a) View of the protein search tab and corresponding primary protein sequence coverage, in red. (b) View of the primary protein sequence display with observed peptides. (c) Distribution of phosphorylated sites in OspA protein sequence with PTMProphet probabilities, ranging from less than 0.01 to 1. (d) Information on observed peptides including empirical suitability score (ESS) empirical observability score (EOS). Accession: peptide accession; start: start position in the protein; pre AA: preceding (towards the N terminus) amino acid; sequence: amino acid sequence of detected peptide, including any mass modifications; fol AA: following (towards the C terminus) amino acid; ESS: empirical suitability score, derived from peptide probability, EOS, and the number of times observed. This is then adjusted sequence characteristics such as missed cleavage [MC] or enzyme termini [ET], or multiple genome locations [MGL]; NET: highest number of enzymatic termini for this protein; NMC: lowest number of missed cleavage for this protein; Best Prob: highest iProphet probability for this observed sequence; Best Adj Prob: highest iProphet-adjusted probability for this observed sequence; N Obs: total number of observations in all modified forms and charge states; EOS: empirical Observability Score, a measure of how many samples a particular peptide is seen in relative to other peptides from the same protein; SSRT: Sequence Specific Retention time provides a hydrophobicity measure for each peptide using the algorithm of Krohkin et al. Version 3.0; N Prot Map: number of proteins in the reference database to which this peptide maps; N Gen Loc: number of discrete genome locations which encode this amino acid sequence; Subpep of: number of observed peptides of which this peptide is a subsequence.
Fig. 4
Fig. 4
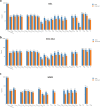
Genome coverage for isolates. Histograms showing the distribution of chromosomal and plasmid coverage for the reference database of isolates B31, B31-5A4, and MM1. Blue bars indicate total number of genes expected for the chromosome or corresponding plasmid. Orange bars indicate number of genes, which correspond to proteins, observed in the chromosome or corresponding plasmid. na: not assigned.
Fig. 5
Fig. 5
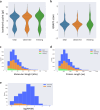
Protein physicochemical properties and RNA abundance. Total: number of total proteins in the B31 UniProt reference database (core proteome). Observed: number of observed proteins in the B31 core proteome. Missing: number of proteins not observed in the B31 core proteome. (a,b) Frequency distributions for protein isoelectric point (pI) and GRAVY score, shown as violin plot. Protein GRAVY index score indicates average hydrophobicity and hydrophilicity. GRAVY score below 0 indicates hydrophilic protein, while scores above 0, hydrophobic. (c,d) Frequency distribution for protein molecular weight (kDa) and protein length (number of amino acids), shown as stacked histograms. (e) Frequency distribution of mRNA log10 RPKM for observed and not observed (missing) proteins in blue and orange, respectively, shown as a histogram.
Fig. 6
Fig. 6
TM2 domain family primary protein sequence coverage in B31, B31-5A4, and MM1 databases. UniProt entry Q9S022_BORBU, gene BB_U09. (a) In the Peptide Mapping section, peptide highlighted with teal denotes a uniquely mapping and tryptic peptide within this set of sequences. Peptide highlighted with mauve denotes a uniquely mapping and non-tryptic peptide within this set of sequences. Peptide highlighted with red denotes a multi-mapping and tryptic peptide within this set of sequences. Peptide highlighted with orange denotes a multi-mapping and non-tryptic peptide within this set of sequences. In the Sequence Coverage section, all relevant proteins are aligned with MAFFT and all detected peptides are displayed in colors. In the consensus (bottom) row, a * indicates identity across all sequences. Other symbols denote varying degrees of similarity. Sequence highlighted with blue: PEPTIDE denotes peptides observed in specified build. (b) Lorikeet MS/MS spectrum view of the peptide AIDEIYCHSCGK, unique to MM1 database.

Update of

Similar articles

References

    1. Schwartz, A. M., Kugeler, K. J., Nelson, C. A., Marx, G. E. & Hinckley, A. F. Use of Commercial Claims Data for Evaluating Trends in Lyme Disease Diagnoses, United States, 2010-2018. Emerging infectious diseases27, 499–507, 10.3201/eid2702.202728 (2021). - PMC - PubMed
    1. Kugeler, K. J., Schwartz, A. M., Delorey, M. J., Mead, P. S. & Hinckley, A. F. Estimating the Frequency of Lyme Disease Diagnoses, United States, 2010-2018. Emerging infectious diseases27, 616–619, 10.3201/eid2702.202731 (2021). - PMC - PubMed
    1. Steere, A. C. et al. Erythema chronicum migrans and Lyme arthritis. The enlarging clinical spectrum. Annals of internal medicine86, 685–698 (1977). - PubMed
    1. Steere, A. C. et al. The spirochetal etiology of Lyme disease. N Engl J Med308, 733–740, 10.1056/NEJM198303313081301 (1983). - PubMed
    1. Schoen, R. T. Challenges in the Diagnosis and Treatment of Lyme Disease. Curr Rheumatol Rep22, 3, 10.1007/s11926-019-0857-2 (2020). - PubMed

LinkOut - more resources