. 2024 Dec 2;14(1):29923.
doi: 10.1038/s41598-024-78626-6.

Integrating graph and reinforcement learning for vaccination strategies in complex networks

Affiliations

Integrating graph and reinforcement learning for vaccination strategies in complex networks

Zhihao Dong et al. Sci Rep. .

Abstract

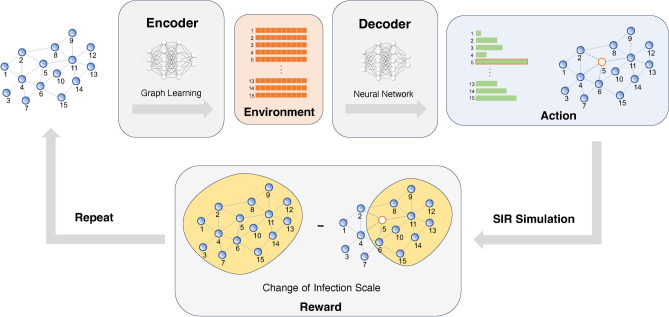
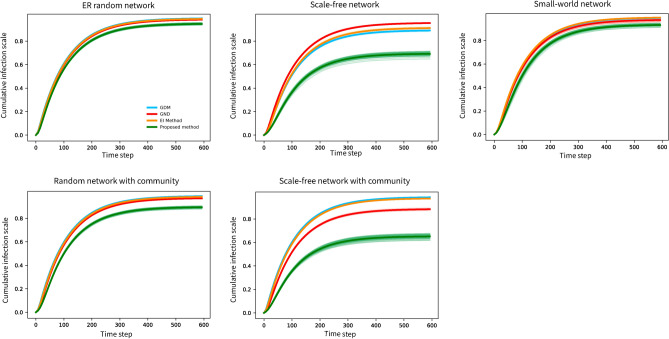
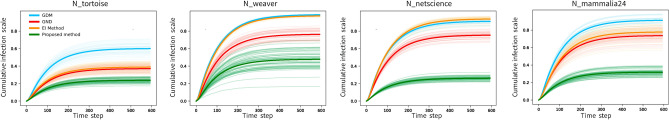
Pandemics like COVID-19 have a huge impact on human society and the global economy. Vaccines are effective in the fight against these pandemics but often in limited supplies, particularly in the early stages. Thus, it is imperative to distribute such crucial public goods efficiently. Identifying and vaccinating key spreaders (i.e., influential nodes) is an effective approach to break down the virus transmission network, thereby inhibiting the spread of the virus. Previous methods for identifying influential nodes in networks lack consistency in terms of effectiveness and precision. Their applicability also depends on the unique characteristics of each network. Furthermore, most of them rank nodes by their individual influence in the network without considering mutual effects among them. However, in many practical settings like vaccine distribution, the challenge is how to select a group of influential nodes. This task is more complex due to the interactions and collective influence of these nodes together. This paper introduces a new framework integrating Graph Neural Network (GNN) and Deep Reinforcement Learning (DRL) for vaccination distribution. This approach combines network structural learning with strategic decision-making. It aims to efficiently disrupt the network structure and stop disease spread through targeting and removing influential nodes. This method is particularly effective in complex environments, where traditional strategies might not be efficient or scalable. Its effectiveness is tested across various network types including both synthetic and real-world datasets, demonstrting a potential for real-world applications in fields like epidemiology and cybersecurity. This interdisciplinary approach shows the capabilities of deep learning in understanding and manipulating complex network systems.


Conflict of interest statement

Competing interests: The authors declare no competing interests.

Figures

Fig. 1
Fig. 1
Illustration of the proposed framework.
Fig. 2
Fig. 2
The degradation of network structures resulting from the removal of 20% nodes by different models on synthetic datasets with various properties. Each dimension has been scaled to fall within a range of 0 to 1 to enhance visualization. To ensure consistency in the result display, we use the inverse of component number and epidemic threshold as the measurement. This means a lower reciprocal value signals a stronger ability of the network to prevent the spread of pathogens. The proposed method proves to be the most effective in dismantling the network structure, leaving the smallest area remaining in each dataset.
Fig. 3
Fig. 3
The degradation of network structures resulting from the removal of 20% nodes by different models on real-world datasets. Consistent with the findings in synthetic networks, the proposed method demonstrates superior effectiveness in breaking down the network structure, resulting in the smallest area remaining across each dataset.
Fig. 4
Fig. 4
The infection scale on five synthetic networks with 20% of nodes removed by various models, where formula image = 0.1, formula image = 0.01 and formula image = 0.1. Each network consists of 500 nodes. The proposed approach outperforms the baseline methods across all datasets. This is primarily because it more effectively reduces the network’s conductivity and leads to smaller peaks in infection scale compared to the baselines. For instance, in the ER random network, immunizing 20% of the nodes identified by the proposed method results in a decrease of the infection scale peak from 86.8% to 75.6%, compared to using the GDM method. These results represent the average of 100 independent runs.
Fig. 5
Fig. 5
The infection scale on four real-world networks with 20% of nodes removed by various models, where formula image = 0.1, formula image = 0.01 and formula image = 0.1. The presented approach surpasses the baseline methods in every dataset tested. For example, in the weaver network, targeting 20% of the nodes as identified by this new method leads to a reduction in the peak of infection scale from 83.2% to 35.8%, a notable improvement over the GDM method. These results represent the average of 100 independent runs.
Fig. 6
Fig. 6
The cumulative infection scale on five synthetic networks with 20% of nodes removed by various models, where formula image = 0.1, formula image = 0.01 and formula image = 0.1. Each network consists of 500 nodes. The proposed approach outperforms the baseline methods across all datasets. For instance, in the scale-free network, immunizing 20% of the nodes identified by the proposed method results in a decrease of the final infection scale from 95.3% to 69.1%, compared to using the GND method. These results represent the average of 100 independent runs.
Fig. 7
Fig. 7
The cumulative infection scale on four real-world networks with 20% of nodes removed by various models, where formula image = 0.1, formula image = 0.01 and formula image = 0.1. The presented approach surpasses the baseline methods in every dataset tested. For example, in the weaver network, targeting 20% of the nodes as identified by this new method leads to a reduction in the final infection scale from 98.8% to 47.9%, compared to using the GDM method. These results represent the average of 100 independent runs.

Similar articles

References

    1. Who coronavirus (covid-19) dashboard. (Accessed July 14, 2023). https://covid19.who.int/.
    1. Kang, Q. et al. Machine learning-aided causal inference framework for environmental data analysis: a covid-19 case study. Environmental Science & Technology55, 13400–13410 (2021). - PubMed
    1. Padma, T. Covid vaccines to reach poorest countries in 2023 - despite recent pledges. Nature595, 342–343 (2021). - PubMed
    1. Dong, Z., Chen, Y., Tricco, T. S., Li, C. & Hu, T. Practical strategy of acquaintance immunization without contact tracing. In Proceedings of the 13th IEEE International Conference on Social Computing and Networking (SocialCom), 845–851 (2020).
    1. Dong, Z., Chen, Y., Tricco, T. S., Li, C. & Hu, T. Hunting for vital nodes in complex networks using local information. Scientific Reports11, 9190 (2021). - PMC - PubMed

Substances

LinkOut - more resources