. 2024 Dec 2;7(1):1601.
doi: 10.1038/s42003-024-07308-w.

Left atrial single-cell transcriptomics reveals amphiregulin as a surrogate marker for atrial fibrillation

Affiliations

Left atrial single-cell transcriptomics reveals amphiregulin as a surrogate marker for atrial fibrillation

Yuya Suzuki et al. Commun Biol. .

Erratum in

  • Author Correction: Left atrial single-cell transcriptomics reveals amphiregulin as a surrogate marker for atrial fibrillation.
    Suzuki Y, Emoto T, Sato S, Yoshida T, Shoda M, Endoh H, Nagao M, Hamana T, Inoue T, Hayashi T, Nitta E, Konishi H, Kiuchi K, Takami M, Imamura K, Taniguchi M, Inoue M, Nakamura T, Sonoda Y, Takahara H, Nakasone K, Yamamoto K, Tani K, Iwai H, Nakanishi Y, Yonehara S, Murakami A, Toh R, Ohkawa T, Furuyashiki T, Nitta R, Yamashita T, Hirata KI, Fukuzawa K. Suzuki Y, et al. Commun Biol. 2025 May 26;8(1):803. doi: 10.1038/s42003-025-08195-5. Commun Biol. 2025. PMID: 40419725 Free PMC article. No abstract available.

Abstract

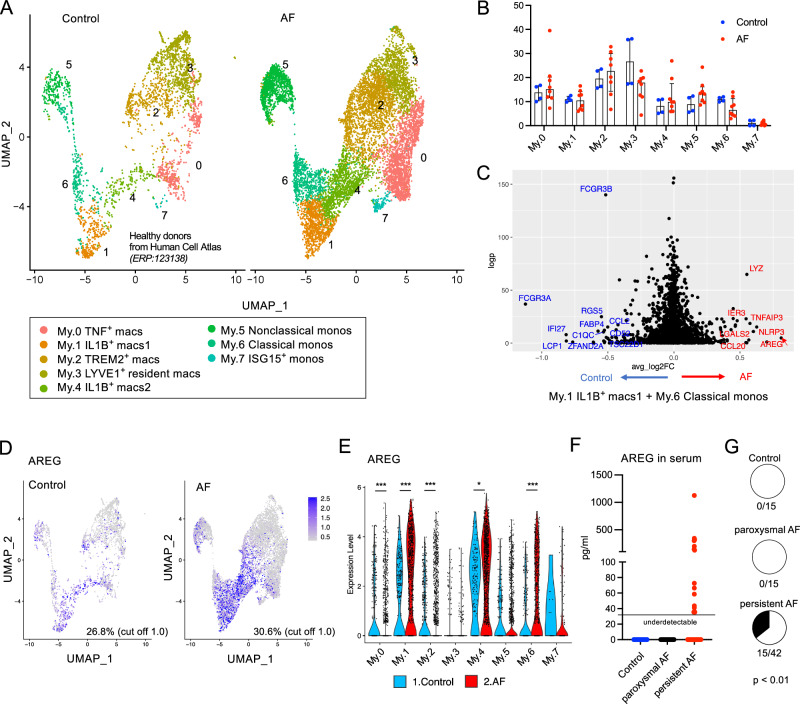
Atrial fibrillation (AF) is strongly associated with strokes, heart failure, and increased mortality. This study aims to identify the monocyte-macrophage heterogeneity and interactions of these cells with non-immune cells, and to identify functional biomarkers in patients with AF. Therefore, we assess the single cell landscape of left atria (LA), using a combination of single cell and nucleus RNA-seq. Myeloid cells in LA tissue are categorized into five macrophage clusters, three monocyte clusters, and others. Cell-Chat analysis revealed that monocytes and IL1B+ macrophages send epidermal growth factor (EGF) signals to fibroblasts. Amphiregulin (AREG) is the most upregulated gene in monocytes and IL1B+ macrophages in the AF group, compared with healthy controls from other groups. Serum AREG levels are higher in patients with persistent AF. These data suggested that EGF signaling pathway could be a therapeutic target for AF and serum AREG levels provide an effective biomarker for predicting persistent AF.


Conflict of interest statement

Competing interests: The authors declare no competing interests.

Figures

Fig. 1
Fig. 1. Cell landscape in left atrial (LA) tissues in atrial fibrillation (AF) and controls.
A Representative LA sample obtained via LA appendectomy (a) and histology of LA tissue of patients with AF (hematoxylin and eosin staining) (b). B Scheme the study. SnRNA-seq (n = 5) and scRNA-seq (n = 8) data were obtained from LA tissue of patients with AF. Comparison of scRNA-seq data revealed the AF marker in serum. C Uniform manifold approximation and projection (UMAP) of all cells in LA tissue of patients with AF (n = 5). CE are for LA tissue of patients with AF, analyzed by snRNA-seq. D Proportions of each cell type in LA tissue of patients with AF. E Dot plot displaying signature cell gene expression markers (SCGEMs) for each cell cluster. F UMAP of immune cells from 4 control LA tissue samples obtained from 2 sites of 2 donors (openly published datasets of healthy donors) and LA tissue of patients with AF (n = 8). FH are for LA tissue of patients with healthy controls and AF, analyzed by scRNA-seq. G Proportions of each immune cell type in LA tissue of patients with AF and healthy controls: (a) Myeloid cells, (b) T and NK cells, and (c) B cells. H Dot plot displaying SCGEMs for each immune cell cluster in LA tissue of patients with healthy controls and AF.
Fig. 2
Fig. 2. Left atrial (LA) myeloid cell immune landscape in atrial fibrillation (AF), analyzed by scRNA-seq.
A Uniform manifold approximation and projection (UMAP) of all myeloid cells (left), and re-clustered UMAP focusing on macrophages and monocytes (right) in LA tissues of patients with AF (n = 8). macs, macrophages; monos, monocytes; DCs, dendritic cells. B Dot plot displaying signature cell gene expression markers (SCGEMs) for each myeloid cell cluster. C Violin plot displaying SCGEMs for each macrophage cluster. D Gene Ontology (GO) terms showing the enriched biological process (BP) and molecular function (MF) of each macrophage sub-cluster. E sc-Metabolism analysis revealing the enriched metabolic and glycolysis or gluconeogenesis pathways of each macrophage sub-cluster, following UMAP analysis of macrophages and monocytes (in LA of patients with AF). F Velocity field projected onto the UMAP plots of macrophages and monocytes in LA and of blood samples (patients with AF). G CD68 staining of LA tissue of patients with AF. H Transmission electron microscopy (TEM) images of LA samples (patients with AF) (ad): macrophages absorbing dysfunctional mitochondria; macrophage-like cells in the interstitial tissue of the muscular layer (e) and submucosa (f). CM, cardiomyocyte; MP, macrophage; CF, collagen fiber; Mt, mitochondria; Sm, sarcomere; EC, endothelial cell. Red arrows indicated exophers.
Fig. 3
Fig. 3. Left atrial (LA) non-immune cell landscape in atrial fibrillation (AF); the interactions between non-immune cells (snRNA-seq data) and myeloid cells (scRNA-seq data).
A Uniform manifold approximation and projection (UMAP) of fibroblasts (FBs) in the left atria (LA) of patients with atrial fibrillation (AF) (n = 5). Proportions of each FB sub-cluster. B Dot plot displaying signature cell gene expression markers for each FB cluster. C Cell-Chat analysis of EGF, PDGF, FN1, and COLLAGEN interactions between myeloid cells and FBs. D UMAP of endothelial cells (ECs) in LA (patients with AF) (n = 5). Proportions of each EC sub-cluster. E Dot plot displaying SCGEMs for each EC cluster. F Cell-Chat analysis of VEGF, IL1, IGF, and NOTCH interactions between myeloid and ECs. G UMAP of cardiomyocytes (CMs) in LA (patients with AF) (n = 5). Proportions of each CM sub-cluster. H Dot plot displaying signature cell gene expression markers for each CM cluster. I Cell-Chat analysis of IGF and EGF interactions between myeloid cells and CMs.
Fig. 4
Fig. 4. Macrophages and monocytes in controls and atrial fibrillation (AF) groups, analyzed by scRNA-seq.
A Uniform manifold approximation and projection (UMAP) of macrophages and monocytes in from 4 control samples obtained from 2 sites of 2 donors (openly published datasets of healthy donors) and AF groups. macs, macrophages; monos, monocytes. B Proportions of each macrophage and monocyte sub-cluster in the control (blue) and AF groups (red). Data were expressed as median with interquartile range and compared using Wilcoxon rank-sum testing. C A volcano plot of genes in IL1B+ macrophages-1 (My.1) and non-classical monocytes (My.6) exhibiting differential expression between the control and AF groups (non-parametric Wilcoxon rank sum testing). Blue: upregulated in controls; red: upregulated in AF samples. The thresholds were log(p) > 10.0 and average log2(fold change) > 0.5 (for AF samples) or log2(fold change) < −0.5 (for controls). D Feature plot of AREG expression in macrophages and monocytes. E AREG expression in each macrophage and monocyte sub-cluster (scRNA-seq data). Wilcoxon rank-sum testing. F Circulating serum AREG levels (n = 15 vs 15 vs 42). Kruskal−Wallis testing followed by Dunn’s post hoc analysis. G Proportions of AREG-positive patients (n: 15 for controls, 15 for paroxysmal AF, and 42 for persistent AF). Chi-square testing. Statistical significance was expressed as *p < 0.05, **p < 0.01, or ***p < 0.001.

References

    1. Chugh, S. S. et al. Worldwide epidemiology of atrial fibrillation: a Global Burden of Disease 2010 Study. Circulation129, 837–847 (2014). - PMC - PubMed
    1. Kornej, J., Börschel, C. S., Benjamin, E. J. & Schnabel, R. B. Epidemiology of atrial fibrillation in the 21st Century: novel methods and new insights. Circ. Res.127, 4–20 (2020). - PMC - PubMed
    1. Yamashita, T. et al. Recruitment of immune cells across atrial endocardium in human atrial fibrillation. Circ. J.74, 262–270 (2010). - PubMed
    1. Smorodinova, N. et al. Analysis of immune cell populations in atrial myocardium of patients with atrial fibrillation or sinus rhythm. PLoS ONE12, e0172691 (2017). - PMC - PubMed
    1. Suzuki, A. et al. Circulating intermediate CD14++CD16+monocytes are increased in patients with atrial fibrillation and reflect the functional remodelling of the left atrium. Europace19, 40–47 (2017). - PubMed

LinkOut - more resources