. 2025 Feb;22(2):399-411.
doi: 10.1038/s41592-024-02543-9. Epub 2024 Dec 2.

RNA-Puzzles Round V: blind predictions of 23 RNA structures

Fan Bu  1   2 Yagoub Adam  3   4 Ryszard W Adamiak  5   6 Maciej Antczak  5   6 Belisa Rebeca H de Aquino  7 Nagendar Goud Badepally  7 Robert T Batey  8 Eugene F Baulin  7 Pawel Boinski  6 Michal J Boniecki  7 Janusz M Bujnicki  7 Kristy A Carpenter  9 Jose Chacon  10   11 Shi-Jie Chen  12 Wah Chiu  13 Pablo Cordero  10   14 Naba Krishna Das  15 Rhiju Das  10   16   17 Wayne K Dawson  7 Frank DiMaio  18   19 Feng Ding  20 Anne-Catherine Dock-Bregeon  21 Nikolay V Dokholyan  22 Ron O Dror  23   24   25   26 Stanisław Dunin-Horkawicz  7 Stephan Eismann  27   28 Eric Ennifar  29 Reza Esmaeeli  30 Masoud Amiri Farsani  7 Adrian R Ferré-D'Amaré  31 Caleb Geniesse  10   32 George E Ghanim  33 Horacio V Guzman  34 Iris V Hood  35 Lin Huang  36 Dharm Skandh Jain  7 Farhang Jaryani  7 Lei Jin  12 Astha Joshi  7 Masha Karelina  17   23 Jeffrey S Kieft  37   38 Wipapat Kladwang  10   16 Sebastian Kmiecik  39 Deepak Koirala  15 Markus Kollmann  40 Rachael C Kretsch  17 Mateusz Kurciński  39 Jun Li  12 Shuang Li  35 Marcin Magnus  7   41 BenoÎt Masquida  42 S Naeim Moafinejad  7 Arup Mondal  30 Sunandan Mukherjee  7 Thi Hoang Duong Nguyen  33 Grigory Nikolaev  7 Chandran Nithin  7   39 Grace Nye  16 Iswarya P N Pandaranadar Jeyeram  7 Alberto Perez  30 Phillip Pham  16 Joseph A Piccirilli  43   44 Smita Priyadarshini Pilla  45 Radosław Pluta  7 Simón Poblete  46   47 Almudena Ponce-Salvatierra  7 Mariusz Popenda  5 Lukasz Popenda  48 Fabrizio Pucci  49 Ramya Rangan  17   28 Angana Ray  7 Aiming Ren  50 Joanna Sarzynska  5 Congzhou Mike Sha  22 Filip Stefaniak  7 Zhaoming Su  51 Krishna C Suddala  35 Marta Szachniuk  5   6 Raphael Townshend  23   28 Robert J Trachman 3rd  31 Jian Wang  22 Wenkai Wang  52 Andrew Watkins  10   53 Tomasz K Wirecki  7 Yi Xiao  54 Peng Xiong  2   55 Yiduo Xiong  54 Jianyi Yang  52 Joseph David Yesselman  16   56 Jinwei Zhang  35 Yi Zhang  54 Zhenzhen Zhang  20 Yuanzhe Zhou  12 Tomasz Zok  6 Dong Zhang  12 Sicheng Zhang  12 Adriana Żyła  7 Eric Westhof  57   58 Zhichao Miao  59   60   61
Affiliations

RNA-Puzzles Round V: blind predictions of 23 RNA structures

Fan Bu et al. Nat Methods. 2025 Feb.

Abstract

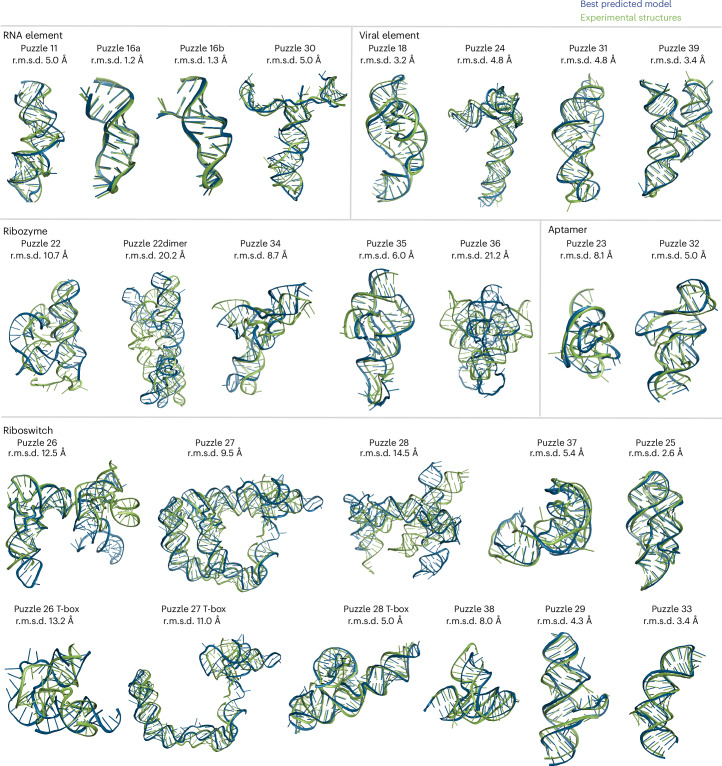
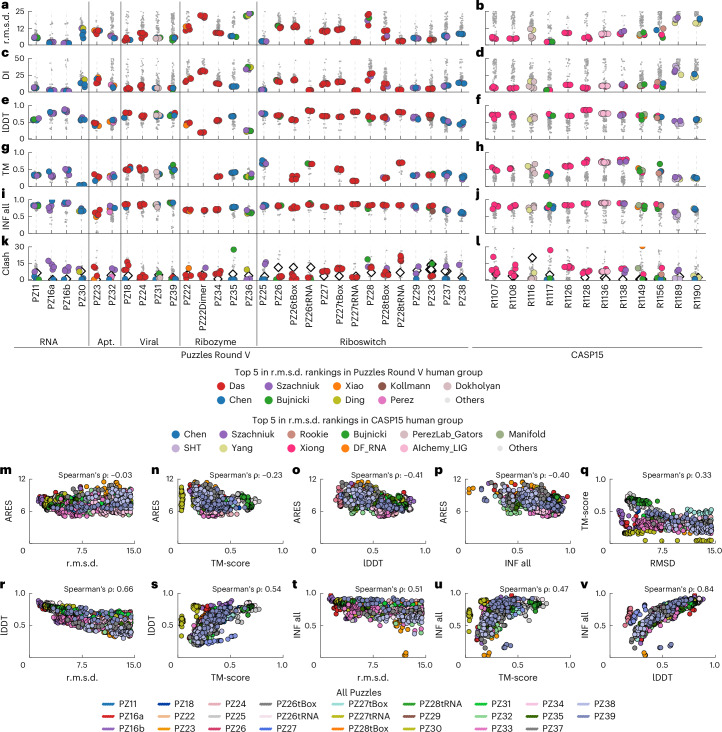
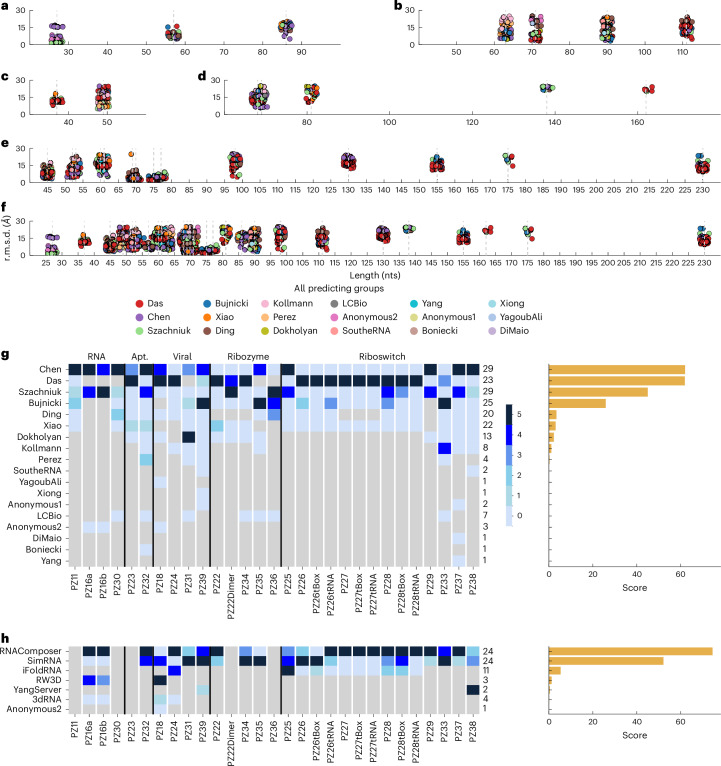
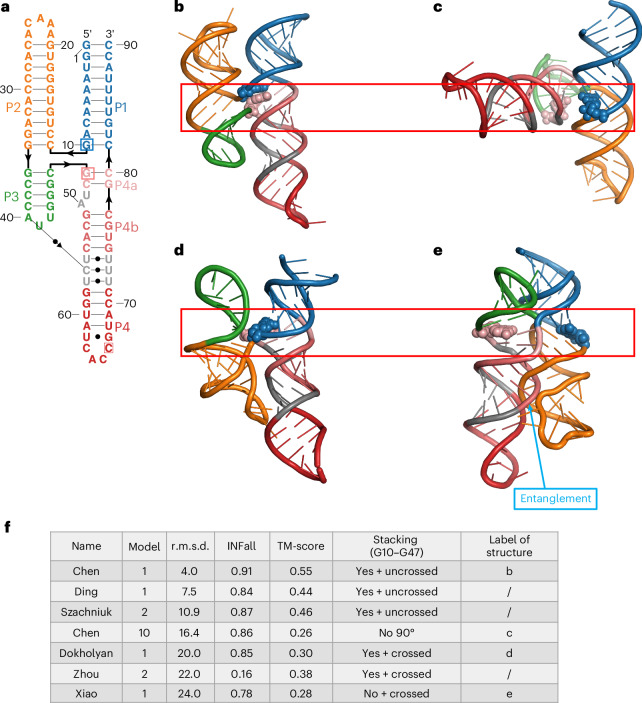
RNA-Puzzles is a collective endeavor dedicated to the advancement and improvement of RNA three-dimensional structure prediction. With agreement from structural biologists, RNA structures are predicted by modeling groups before publication of the experimental structures. We report a large-scale set of predictions by 18 groups for 23 RNA-Puzzles: 4 RNA elements, 2 Aptamers, 4 Viral elements, 5 Ribozymes and 8 Riboswitches. We describe automatic assessment protocols for comparisons between prediction and experiment. Our analyses reveal some critical steps to be overcome to achieve good accuracy in modeling RNA structures: identification of helix-forming pairs and of non-Watson-Crick modules, correct coaxial stacking between helices and avoidance of entanglements. Three of the top four modeling groups in this round also ranked among the top four in the CASP15 contest.


Conflict of interest statement

Competing interests: The authors declare no competing interests.

Figures

Fig. 1
Fig. 1. The best-predicted models superimposed on the experimental structures.
Visualization of 26 targets (green) with the highest ranked model (blue) superimposed on each other (comparisons of the tRNAs in the T-box complexes are not shown). The selection of the best model was based on comparing the r.m.s.d. values of all five predicted models from all predictor groups to the available experimental structures. The best r.m.s.d. value is given beneath the corresponding Puzzle number. The five categories are: RNA element, Viral element, Aptamer, Ribozyme and Riboswitch. To simplify the visualization of RNA folding, the small molecule ligands are not displayed in this figure. Source data
Fig. 2
Fig. 2. General analysis of the overall prediction results for all Puzzles with human expert predictions.
al, The plots display the distribution of structure assessment metrics for all predicted groups for all Puzzles Round V. For comparison purposes, at the right are shown the data for the targets of CASP15 published previously. Each prediction model is represented by a dot, with each group having the same color. The assessment metrics include r.m.s.d. (Å) (a,b), DI (c,d), lDDT (e,f), TM-score (g,h), INF (i,j), where INFall includes all parameters (INFwc considers only the Watson–Crick pairs; INFnwc includes only the non-Watson–Crick pairs; and INFstack counts the stacked bases) and Clash score (k,l) where the black lozenge box indicates the solution structure. The legend below the plots indicates the best-performing group among all Puzzles. mv, A correlation analysis between all models from Puzzles Round V across different metrics is presented. This analysis shows the interrelationships among the various evaluation metrics and helps to determine those that are positively correlated with the overall performance assessment of prediction models. Correlation plots between the metrics used for all Round V Puzzles with the Spearman’s rank correlation coefficients (Spearman’s ρ) indicated. ARES versus r.m.s.d. (Å) (P = 0.37) (m), ARES versus TM-score (P = 0.00) (n), ARES versus lDDT (P = 0.00) (o), ARES versus INFall (P = 0.00) (p), TM-score versus r.m.s.d. (Å) (P = 0.00) (q), lDDT versus r.m.s.d. (Å) (P = 0.00) (r), lDDT versus TM-score (P = 0.00) (s), INFall versus r.m.s.d. (Å) (P = 0.00) (t), INFall versus TM-score (P = 0.00) (u) and INFall versus lDDT (P = 0.00) (v). The r.m.s.d. was multiplied by −1 for calculating the correlations so that higher scores correspond to better accuracy for all metrics. Source data
Fig. 3
Fig. 3. Correlation analysis between sequence length and r.m.s.d. for all Puzzles with human expert predictions.
ae, Scatter-plots are used to visualize the relations between r.m.s.d. and length within the prediction models classified into five groups: RNA element (a), Viral element (b), Aptamer (c), Ribozyme (d) and Riboswitch (e). f, All Puzzles are aggregated together. Each prediction model is depicted as a point on the scatter-plot. A similar plot for automatic webserver-based predictions is shown in Supplementary Fig. 2. g,h, Ranking of the modeling groups for human expert predictions (g) and for web-based predictions (h). For the left drawings of g and h, the color scheme (from dark to light blue) is such that 5 means that the group obtained the best r.m.s.d., 4 the second best and 1, the fifth best-predicted model, with 0 attributed when none of the submitted models was among the first five of the ranked models, when the group did not submit models for that Puzzle or the group was the only one to submit a model (shown in light gray). The last column of the right diagram is the total number of valid submissions to RNA-Puzzles (maximum 29) for each group. In the right drawings of g and h, the total sum reached by each group is given. The final score on the diagrams at the left of g and h is the total sum normalized by the ratio of valid submissions divided by the total number of Puzzles (29). The Das group submitted models coming from different methods and they are all gathered in a single group (Supplementary Table 5). The web-based predictions include RNAComposer (Szachniuk), SimRNA (Bujnicki), iFoldRNA (Dokholyan), RW3D (Das), YangServer (Yang) and 3dRNA (Xiao). Source data
Fig. 4
Fig. 4. Detailed analysis of PZ39, a four-way junction.
a, Diagram of the secondary structure with the non-Watson–Crick pairs of the experimental structure (PDB ID: 8DP3) of Puzzle PZ39. In the experimental structure, P1 coaxially stacks with P4, and P2 with P3. The linking strands do not cross at the junction. The coaxial stacking is monitored by the stacking between G10 (blue square) and G47 (pink square), where the red rectangles indicate the critical coaxial regions. be, Predicted structures for PZ39. f, A table containing the modeling group with some metrics on the predicted model for the drawings represented in be, where ‘Name’ indicates the name of the prediction group and ‘Model’ indicates the number of the model submitted by the prediction group (ten models per group could be submitted for PZ39). Short descriptions about the stacking and arrangement of helices are also given. Note that in e, two strands intertwine and form an entanglement in which two closed loops intertwine. Source data
Fig. 5
Fig. 5. The detailed comparison analysis between experimental and best-predicted structures of the NAD+ II riboswitches PZ37/PZ38.
a, Superimposition of the sugar-phosphate backbones of the experimental structure (resolution 2.5 Å) of PZ37 and of the best-predicted model (Chen_6, r.m.s.d. 5.4 Å). bg, The drawings show specific base pair interactions in both experimental (with atomic bond distances in green) and predicted (with atomic bond distances in blue) structures. i, Superimposition of the sugar-phosphate backbones of the experimental structure (resolution 2.3 Å) of PZ38 and of the best-predicted model (Chen_3, r.m.s.d. 8.0 Å). jo, The drawings show specific base pair interactions in both experimental (with atomic bond distances in green) and predicted (with atomic bond distances in blue) structures. The drawings of h and p represent unique base pair interactions found in PZ37 (h) or PZ38 (p). The experimental structures are shown with carbon atoms colored yellow and the predicted structures with carbon atoms colored cyan. The distances between atoms experimentally forming an H-bond are color-coded as a function of length <3.4 Å in red, 3.4–7 Å in green and >7 Å in dark blue. Source data
Fig. 6
Fig. 6. r.m.s.d. and Clash score for the 29 comparisons between experimental and all submitted predicted structures.
a, For the r.m.s.d. plot, ranges delimited by analysis of the coaxial arrangement of helices are given. Below 4–5 Å, good accuracy can be achieved, but r.m.s.d. values <2.6–3.0 Å seem necessary for good ligand prediction. Between 4–5 and 11–12 Å, arrangements of helices can be correctly predicted; however, between 11–12 Å and 20 Å, wrong arrangements of helices are observed. Above 20 Å, wrong helical arrangements and even formation of entanglements or knots can be observed. b, Clash scores >10–15 are still commonly detected. Good experimental structures at high resolution have Clash scores between 3 and 5. Source data
Extended Data Fig. 1
Extended Data Fig. 1. Comparisons of key non-Watson–Crick pairs between the experimental and best-predicted structures in PZ16a and PZ16b.
(a–e) Non-Watson–Crick pairs in the experimental structure of PZ16a (PDB id: 6y0y). (b–f) Best-predicted non-Watson–Crick pairs for PZ16a (RNAComposerAS1_3, r.m.s.d. = 1.2 Å). (g) Non-Watson–Crick pairs in the experimental structure of PZ16b (PDB id: 6y0t). (h) Best-predicted non-Watson–Crick pairs for PZ16b (RNAComposerAS2_1, r.m.s.d. = 1.3 Å). Source data
Extended Data Fig. 2
Extended Data Fig. 2. Detailed analysis of PZ23, the Mango Aptamer.
(a) Diagrams of the interaction contacts for the experimental structure (PDB ID: 6e8u) and (b) for the best-predicted structure (DAS_7, r.m.s.d. = 8.1 Å). The position of the ligand, thiazole orange linked to Biotin (H2D), is shown in a red rectangle. See Supplementary Fig. 5(i) for more detailed descriptions of the unusual quadruplex structure of PZ23. (c) Global overlay of the target (in green) with the best-predicted model (in blue: Das_7)(global r.m.s.d. without the ligand: 8.1 Å; INFnwc: 0.45). The region within the dashed box is highlighted in (d) and (e) where are shown respectively the structural environment around the bound ligand (in red) within the target (in green) and the best-predicted model (in blue). Source data
Extended Data Fig. 3
Extended Data Fig. 3. Detailed analysis of predictive models for Viral elements.
(a–f) The results of the 12–21 base pair in the crystal structure (PDB id:7mlx) and the top 5 predicted structures of PZ31 (b) Dokholyan_2, r.m.s.d. = 4.80 Å, (c) Dokholyan_1, r.m.s.d. = 4.96 Å, (d) Chen_7, r.m.s.d. = 5.17 Å, (e) Chen_5, r.m.s.d. = 5.42 Å, (f) Bujnicki_2, r.m.s.d. = 5.45 Å). The H-bonds are color-coded as a function of length: < 4.0 Å in red and beyond 5 Å in green. Two residues are missing at the 5′-end of the modeled sequences. Source data
Extended Data Fig. 4
Extended Data Fig. 4. Detailed analysis of predictive models for Ribozymes.
(a) Experimental structure of PZ22dimer (PDB ID: 6jq5). (b) Experimental dimer region. (c) Simplified secondary structure diagram focusing on the intermolecular helices formed in the dimer. (d,e) Predicted PZ22dimer structure (Adamiak_5, r.m.s.d. = 20.2 Å), (d) Tertiary structure, (e) Dimer region, and (f,g) Comparison of key regions between the experimental and predicted structures (Das_5, r.m.s.d. = 10.7 Å) of PZ22 (5′-U7GAGA11-3′ + U39). Source data
Extended Data Fig. 5
Extended Data Fig. 5. Detailed analysis of PZ36, the dimer region of the Chimpanzee CPEB3 HDV-like ribozyme.
The figures illustrate differences in the dimer region between the crystal structure (PDB ID: 7qr3) and the predicted structures (Szachniuk_4, r.m.s.d. = 21.2 Å). (a) the crystal structure of the dimer. (b) the helical region key to the formation of the dimer. (c,d) the same for the best-predicted model (Szachniuk_4, r.m.s.d. = 21.2 Å) where the two strands that should pair are far away from each other. Source data
Extended Data Fig. 6
Extended Data Fig. 6. Comparisons of core catalytic regions in PZ22 and PZ34 from the human group predictions in the Ribozyme category.
(a) The structure shows key distances between selected atoms in the core catalytic regions of the experimental structure of PZ22. These selected atoms include G63-N2, C64-N4, G31-O6, A75-OP (minimum of A75-OP2 or A75-OP1), A74-O2′, G31-N7, G30-C8, A74-N3, and G30-N7. (b) The structure shows distances between selected atoms in the core ligand-binding region of the experimental structure of PZ34. The selected atoms include U45-C1′, A63-C1′, and C10-C1′. (c) The dot plot shows the correlation between the sum of distance differences (predicted vs. crystal model) of the selected atoms (as shown in panel a) in PZ22 and the r.m.s.d. of selected atoms of the selected nucleotides (G63, C64, G31, A75, A74, G30) (P = 0.00). (d) The dot plot shows the correlation between the sum of distance differences of C1′ atoms (predicted vs. crystal model) in PZ34 and the r.m.s.d. of C1′ atoms of the selected nucleotides (U45, A63, C10) (P = 0.00). (e) The dot plot shows the correlation between the sum of distance differences of the selected atoms (predicted vs. crystal model) in PZ22 and the global r.m.s.d. (P = 0.19). (f) The dot plot shows the correlation between the sum of distance differences of C1′ atoms (predicted vs. crystal model) in PZ34 and the global r.m.s.d. (P = 0.02). Source data
Extended Data Fig. 7
Extended Data Fig. 7. Comparisons of the Core Catalytic Regions between the experimental and predicted structures for PZ22 and PZ34 (Human Group Predictions).
(a–c) For PZ22, the panels illustrate selected key interatomic distances (G63-N2, C64-N4, G31-O6, A75-OP (the minimum value of A75-OP2 or A75-OP1), A74-O2′, G31-N7, G30-C8, A74-N3, and G30-N7) within the core catalytic regions predicted by Chen (model: Chen_3, r.m.s.d.: 31.8 Å), Das (model: Das_7, r.m.s.d.: 21.2 Å), and Szachniuk (model: Adamiak_2; r.m.s.d.:19.7 Å) groups. The environment in the experimental structure is shown in Extended Data Fig. 6a. Notice that in the experimental structure (Extended Data Fig. 6a), A74 is close to G30 and A75 to G63. In none of the models, this pattern is respected; they all show A74 and A75 stacked or in close proximity. (d) For PZ34, the panel shows the global overlay between the target (in green) and Chen model (in blue, model: Chen_3) (global r.m.s.d.: 9.4 Å). (e) The panel shows selected interatomic distances (U45-C1′, A63-C1′, and C10-C1′) in the core catalytic region of Chen model (model: Chen_3). (f) The panel displays the global overlay between the target (in green) and Das model (in red, model: Das_2) (global r.m.s.d.: 9.0 Å). (g) The panel highlights the interatomic distances in the core catalytic region of Das model (model: Das_2), focusing on selected atoms U45-C1′, A63-C1′, and C10-C1′. The environment in the experimental structure is shown in Extended Data Fig. 6b. Source data
Extended Data Fig. 8
Extended Data Fig. 8. Detailed analysis of the ligand-binding sites in Puzzle 25 and Puzzle 29 in the Riboswitch category.
(a) Diagram showing the contacts in the crystal structure (PDB ID:6p2h) corresponding to PZ25. The ligand, 2′-deoxyguanosine (dG), is shown in a red rectangle. (b) The recognition mode of the ligand (in red and blue) in the crystal structure. (c) The recognition mode of the ligand in the best-predicted model (Chen_5, r.m.s.d. = 2.55 Å). (d) The recognition mode of the ligand in the next best-predicted model (Adamiak_1, r.m.s.d. = 2.68 Å). (e) The recognition mode of the ligand in the following predicted model (Adamiak_3, r.m.s.d. = 2.69 Å). (f) The recognition mode of the ligand in the following predicted model (Chen_8, r.m.s.d. = 2.71 Å). (g) The recognition mode of the ligand in the following predicted model (Chen_3, r.m.s.d. = 2.84 Å). (h) Diagram showing the contacts in the crystal structure (PDB ID:6tb7) corresponding to PZ29. The ligand, ADP, is shown in a red rectangle. The r.m.s.d. between 6tb7 (ligand AMP) and 6tf1 (ligand ADP) is 0.2 Å; thus either one can be used for comparisons. The numbers inside the parentheses are the numbers of the bases in the predicted structure. (i) The recognition mode of the ligand (in red and blue) in the crystal structure. (j) The recognition mode of the ligand in the best-predicted model (RNAComposer_1, r.m.s.d. = 4.30 Å). (k) The recognition mode of the ligand in the next best-predicted model (Chen_9, r.m.s.d. = 4.68 Å). (l) The recognition mode of the ligand in the next best-predicted model (Szachniuk_3, r.m.s.d. = 4.79 Å). (m) The recognition mode of the ligand in the following predicted model (RNAComposer_5, r.m.s.d. = 4.81 Å). (n) The recognition mode of the ligand in the following predicted model (RNAComposer_3, r.m.s.d. = 4.83 Å). Source data
Extended Data Fig. 9
Extended Data Fig. 9. Comparisons between the rankings of the human and web-based predictions in RNA Puzzles Round IV4 and Round V (this paper).
Rankings from Puzzles Round IV4 are shown for human predictions in (a) and web-based predictions in (b). Rankings from the cumulated Puzzles Round IV and V, are shown for human predictions in (c) and web-based predictions in (d). The color scheme ranges from dark blue (5, best r.m.s.d.) to light gray (0, no models in the top five or no submissions). When a single group has submitted models for a Puzzle, the results are not counted. The right columns show the total number of valid RNA puzzles each group submitted. The final score on the left is the ratio of the sum to the total number of Puzzles (Round IV: 6, Round IV and V: 35). For the Das group, the models obtained by different methods are grouped together (see Supplementary Table 5). The web-based predictions include RNAComposer from the Szachniuk group (Polish Academy of Sciences), SimRNA from the Bujnicki group (International Institute of Molecular and Cell Biology in Warsaw), iFoldRNA from the Dokholyan group (Penn State College of Medicine, Hershey), RW3D from the Das group (Stanford University), YangServer from the Yang group (Shandong University), 3dRNA from the Xiao group (Huazhong University of Science and Technology), and LeeAS from the Lee group (Korea Institute for Advanced Study, Major from Francois Major (Université de Montréal)). Source data

Similar articles

Cited by

References

    1. Cruz, J. A. et al. RNA-Puzzles: a CASP-like evaluation of RNA three-dimensional structure prediction. RNA18, 610–625 (2012). - PMC - PubMed
    1. Miao, Z. et al. RNA-Puzzles Round II: assessment of RNA structure prediction programs applied to three large RNA structures. RNA21, 1066–1084 (2015). - PMC - PubMed
    1. Miao, Z. et al. RNA-Puzzles Round III: 3D RNA structure prediction of five riboswitches and one ribozyme. RNA23, 655–672 (2017). - PMC - PubMed
    1. Miao, Z. et al. RNA-Puzzles Round IV: 3D structure predictions of four ribozymes and two aptamers. RNA26, 982–995 (2020). - PMC - PubMed
    1. Kabsch, W. A solution for the best rotation to relate two sets of vectors. Acta Crystallogr. A32, 922–923 (1976).

MeSH terms