. 2024 Dec;56(12):2673-2689.
doi: 10.1038/s12276-024-01360-6. Epub 2024 Dec 2.

EPRS1-mediated fibroblast activation and mitochondrial dysfunction promote kidney fibrosis

Affiliations

EPRS1-mediated fibroblast activation and mitochondrial dysfunction promote kidney fibrosis

Seung Seob Son et al. Exp Mol Med. 2024 Dec.

Abstract

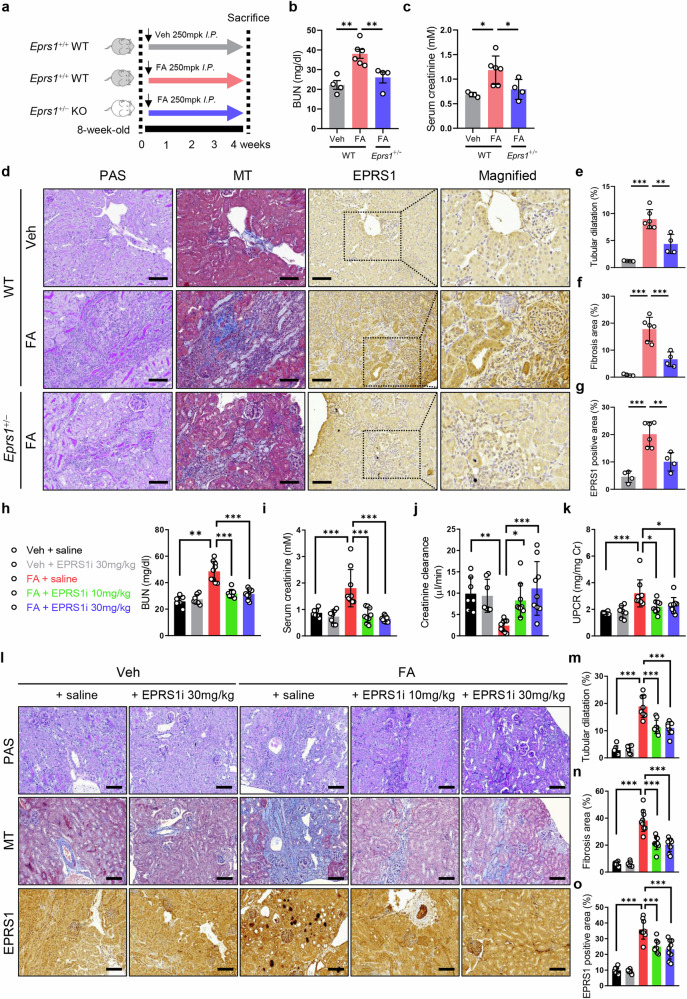
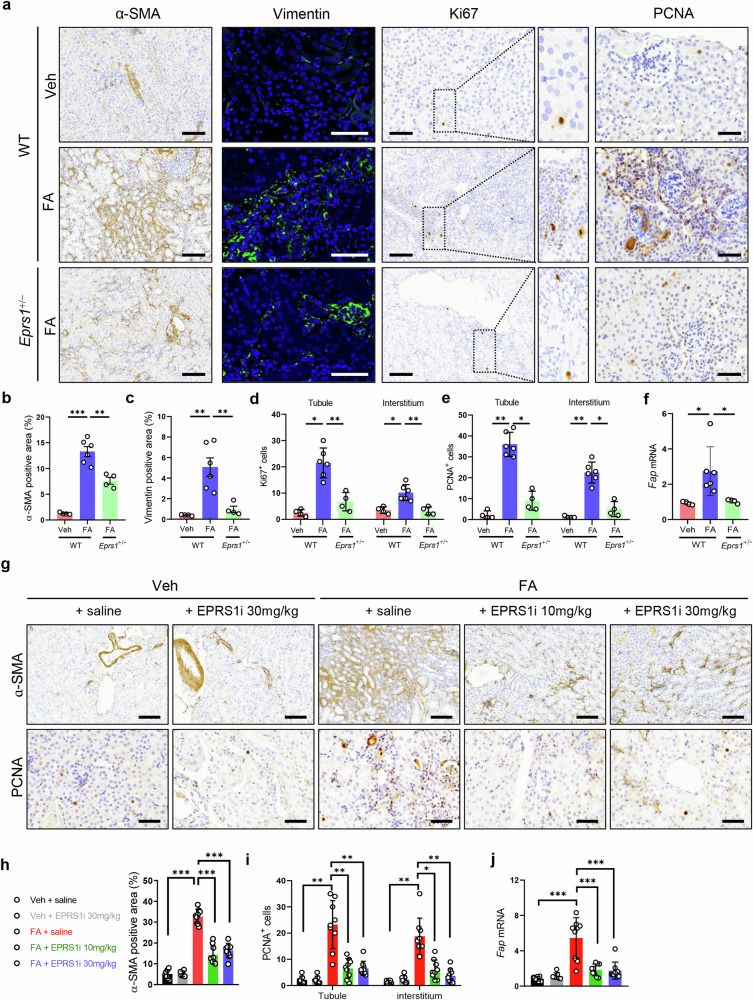
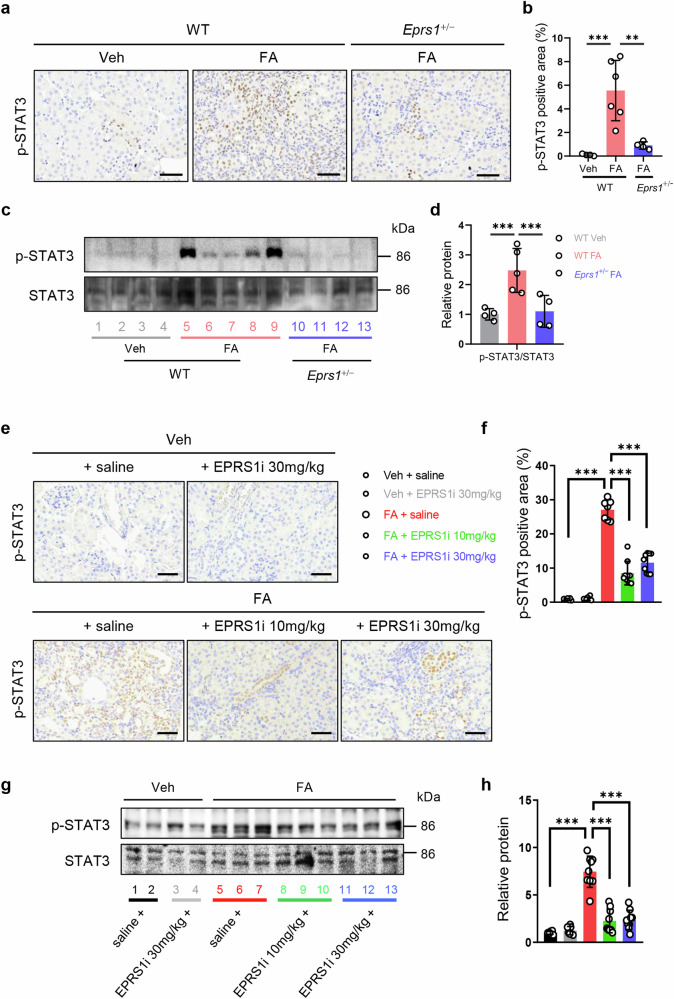
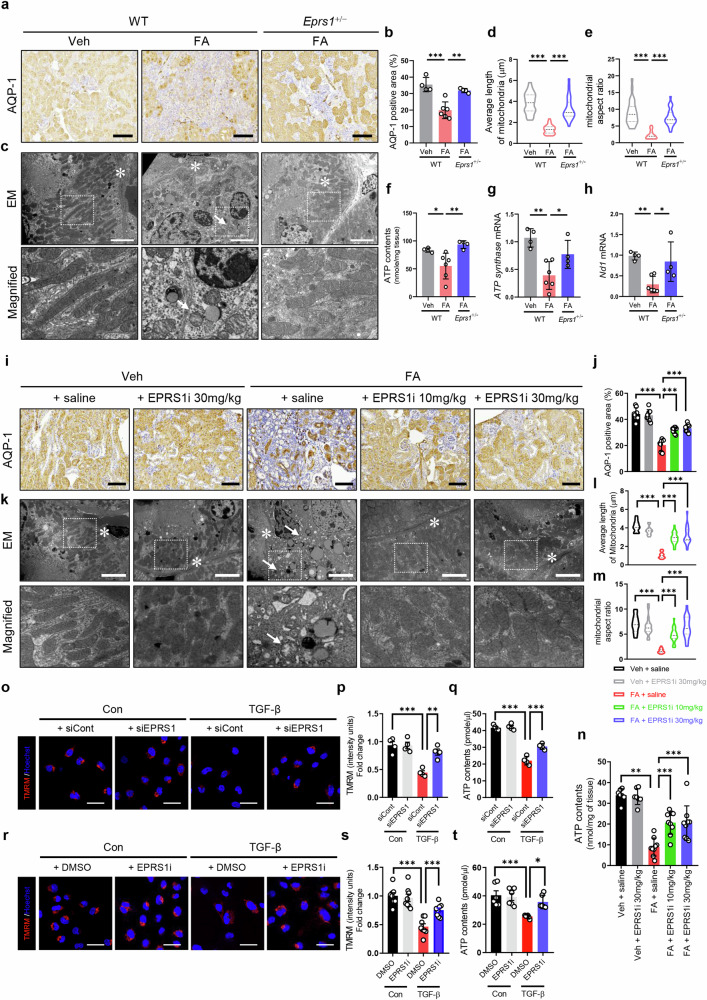
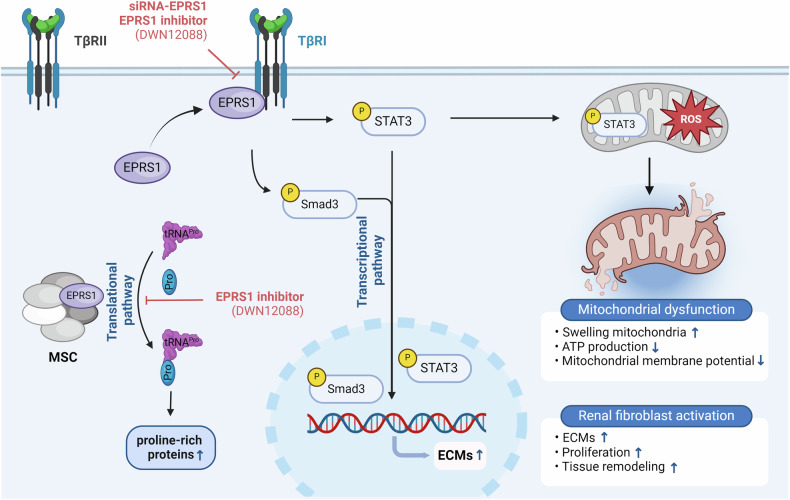
Kidney fibrosis causes irreversible structural damage in chronic kidney disease and is characterized by aberrant extracellular matrix (ECM) accumulation. Although glutamyl-prolyl-tRNA synthetase 1 (EPRS1) is a crucial enzyme involved in proline-rich protein synthesis, its role in kidney fibrosis remains unclear. The present study revealed that EPRS1 expression levels were increased in the fibrotic kidneys of patients and mice, especially in fibroblasts and proximal tubular epithelial cells, on the basis of single-cell analysis and immunostaining of fibrotic kidneys. Moreover, C57BL/6 EPRS1tm1b heterozygous knockout (Eprs1+/-) and pharmacological EPRS1 inhibition with the first-in-class EPRS1 inhibitor DWN12088 protected against kidney fibrosis and dysfunction by preventing fibroblast activation and proximal tubular injury. Interestingly, in vitro assays demonstrated that EPRS1-mediated nontranslational pathways in addition to translational pathways under transforming growth factor β-treated conditions by phosphorylating SMAD family member 3 in fibroblasts and signal transducers and activators of transcription 3 in injured proximal tubules. EPRS1 knockdown and catalytic inhibition suppressed these pathways, preventing fibroblast activation, proliferation, and subsequent collagen production. Additionally, we revealed that EPRS1 caused mitochondrial damage in proximal tubules but that this damage was attenuated by EPRS1 inhibition. Our findings suggest that the EPRS1-mediated ECM accumulation induces kidney fibrosis via fibroblast activation and mitochondrial dysfunction. Therefore, targeting EPRS1 could be a potential therapeutic target for alleviating fibrotic injury in chronic kidney disease.


Conflict of interest statement

Competing interests: The authors declare no competing interests.

Figures

Fig. 1
Fig. 1. Glutamyl-prolyl-tRNA synthetase 1 (EPRS1) is upregulated in the fibrotic kidneys of humans and animals.
a Representative image of immunohistochemistry (IHC) of EPRS1 in human kidneys. Normal control (Control) or fibrosis (Fibrosis) tissues were obtained from kidneys with minor glomerular changes or focal segmental glomerulosclerosis (FSGS) (n = 3 each). The arrowhead indicates fibroblasts. The asterisk indicates a proximal tubule cell. Scale bar = 100 μm. b The EPRS1-positive area was quantified via ImageJ analysis (n = 6). ce Clinical indices of patients: tubular atrophy, fibrosis index, and estimated glomerular filtration rate (eGFR). fi Linear regression revealed that the EPRS1-positive area was correlated with kidney dysfunction, as indicated by the fibrosis index, tubular atrophy, proteinuria, and eGFR. j Representative images of periodic acid-Schiff (PAS), Masson’s trichrome (MT), and IHC of EPRS1 in a folic acid-induced kidney fibrosis mouse model (FA mice). k Tubular dilatation as determined by measuring abnormal shapes in PAS-stained sections. l, m Fibrotic areas identified via MT staining and EPRS1-positive areas were quantified via ImageJ analysis (n = 6–7). Scale bar = 50 μm. n, o Representative Western blot and quantitative data of EPRS1 protein expression in kidneys from the three groups (n = 6–7). The numbers (1–11) indicate individual animals in a given group. pt Linear regression revealing that the EPRS1-positive area correlated with kidney dysfunction: fibrosis area, proteinuria, blood urea nitrogen (BUN), creatinine clearance, and collagen Ι α1 (Col1a1) mRNA levels in FA-treated mice. The data are presented as mean ± standard deviation. Statistical data were analyzed by a two-tailed t-test. *P < 0.05, **P < 0.01, and ***P < 0.001. Veh vehicle.
Fig. 2
Fig. 2. Single-cell RNA sequencing (scRNA-seq) profiling and immunostaining reveal the origins of EPRS1 in FA mice.
a EPRS1-positive cell specificity showing an injured proximal tubule (dotted arrow) and fibroblasts (solid arrow) in human fibrotic tissue. b Uniform manifold approximation and projection (UMAP) plots showing total kidney cells expressed throughout the subcluster compared with those in FA mice and Veh mice. c Violin plot of specific marker genes that identified clusters generated via UMAP plotting. The color is different for various cell subtypes. The color of the cells represents the group’s origin. di Dot plot of Eprs1 gene expression per cell cluster. jl Representative confocal images of EPRS1 (red), α-smooth muscle actin (α-SMA, green), vimentin (green), and lotus tetragonolobus lectin (LTL, green) in FA mice. Scale bar = 50 μm. The colocalized portion is shown with a white arrow. The yellow arrowhead indicates a damaged proximal tubule in the lumen. PCT, proximal convoluted tubule; PST, proximal straight tubule; Inj. PT1, injured proximal tubule 1; Inj. PT2, injured proximal tubule 2; Podo, podocytes; ALOH, ascending limb of loop of Henle; CD_PC, principal cells of the collecting duct; CD_IC, intercalated cells of the collecting duct; DCT, distal convoluted tubule; Endo, endothelial cells; Fibro, fibroblast; MyoFibro, myofibroblast; Myeloid; T cell; B cell; Neutro, neutrophil.
Fig. 3
Fig. 3. Genetic and pharmacological inhibition of EPRS1 attenuates kidney function and structure in FA mice.
a Study designed to examine the effect of genetic Eprs1 inhibition in FA mice. b, c BUN and serum creatinine levels in the three groups are indicated (n = 4–6). d Representative images of PAS, MT, and IHC staining of EPRS1 in kidney tissues (n = 4–6). eg Tubular dilatation in the PAS-stained kidney, the fibrotic area in the MT-stained kidney, and the EPRS1-positive area were quantified via ImageJ analysis (n = 4‒6). Scale bar = 100 μm. hk BUN levels, serum creatinine levels, creatinine clearance, and the urine protein-to-creatinine ratio (UPCR) in the five groups were measured to assess the effect of the EPRS1 inhibitor (n = 7–9). l Representative images of PAS, MT, and IHC staining of EPRS1 in kidney tissues (n = 7–9). mo Tubular dilatation in the PAS-stained kidney, the fibrotic area in the MT-stained kidney, and the EPRS1-positive area were quantified via ImageJ analysis. The data are presented as mean ± standard deviation. Statistical data were analyzed by ANOVA with Tukey’s post hoc test. *P < 0.05, **P < 0.01, and ***P < 0.001.
Fig. 4
Fig. 4. Genetic and pharmacological inhibition of EPRS1 reduces collagen accumulation and hydroxyproline levels.
a Hydroxyproline was measured in whole kidney tissue from the three groups to examine the effect of genetic Eprs1 inhibition in FA mice (n = 4–6). b Representative images of COL1A1 from IHC-stained kidneys. Scale bar = 100 μm. c The COL1A1-positive area was quantified by ImageJ analysis (n = 4–6). d, e Representative Western blot and quantitative data showing the protein expression levels of COL1A1, EPRS1, α-SMA, and transforming growth factor β (TGF-β) in kidneys from the three groups. The numbers (1–13) indicate individual animals in a given group. f, g The mRNA levels of Col1a1, Col3, Col4, Fn, Acta2, and Eprs1 were analyzed via quantitative PCR (qPCR) and normalized to those of Rpl13a (n = 4–6). h Hydroxyproline was measured in whole kidney tissue from the five groups to assess the effect of the EPRS1 inhibitor (n = 7–9). i Representative images of COL1A1 from IHC-stained kidneys. Scale bar = 100 μm. j The COL1A1-positive area was quantified by ImageJ analysis (n = 7–9). k, l Representative Western blot and quantitative data of protein (COL1A1, EPRS1, α-SMA, and TGF-β) expression in kidneys from the five groups. The numbers (1–13) indicate individual animals in a given group. The data are presented as mean ± standard deviation. Statistical data were analyzed by ANOVA with Tukey’s post hoc test. *P < 0.05, **P < 0.01, and ***P < 0.001.
Fig. 5
Fig. 5. Genetic and pharmacological inhibition of EPRS1 suppresses fibroblast activation and proliferation in FA mice.
a Representative images of α-SMA, vimentin, Ki67, and proliferating cell nuclear antigen (PCNA) from IHC-stained kidneys examining the effect of genetic Eprs1 inhibition in FA mice. Scale bar = 100 μm (for α-SMA, vimentin, and Ki67), Scale bar = 50 μm (for PCNA). be α-SMA- and vimentin-positive areas and Ki67- and PCNA-positive cells were quantified by ImageJ analysis (n = 4‒6). f mRNA levels of fibroblast activation protein (Fap) were analyzed by qPCR and normalized to those of Rpl13a (n = 4–6). g Representative images of α-SMA and PCNA from IHC-stained kidneys used to assess the effect of the EPRS1 inhibitor. Scale bar = 100 μm (α-SMA), Scale bar = 50 μm (PCNA). h The α-SMA-positive area was quantified by ImageJ analysis (n = 7–9). i PCNA-positive cells were quantified by ImageJ analysis (n = 7–9). j mRNA levels of Fap were analyzed by qPCR and normalized to those of Rpl13a (n = 7–9). The data are presented as mean ± standard deviation. Statistical data were analyzed by ANOVA with Tukey’s post hoc test. *P < 0.05, **P < 0.01, and ***P < 0.001.
Fig. 6
Fig. 6. EPRS1 inhibitor suppresses fibroblast activation and proliferation in NRK-49F cells.
a Representative confocal image (left) and quantitative data (right) of EPRS1 (red) and Pan-cadherin (green) in NRK-49F cells induced with TGF-β (5 ng/ml) for 24 h. The yellow arrow indicates the plasma membrane portion. Scale bar = 20 μm. Colocalization analysis was performed according to the methods provided in ZEN software. b Representative Western blot (top) and quantitative data (bottom) of the membrane and cytosol of NRK-49F cells treated with or without TGF-β (n = 3). Mem, membrane fraction; Cyto, cytosolic fraction. c Relative mRNA levels of Col1a1 and Col3 were analyzed via qPCR and normalized to Gapdh to assess the effect of the EPRS1 inhibitor (n = 3). d Representative Western blot (left) and quantitative data (right) of FN, COL1A1, and α-SMA in the whole lysate of EPRS1i-treated NRK-49F cells under TGF-β treatment conditions (n = 3). e Representative confocal images (top) and quantitative data (bottom) of COL1A1 and α-SMA in EPRS1i-treated cells under TGF-β treatment conditions for 24 h. The α-SMA-positive area and COL1A1-positive area were quantified by ImageJ analysis (n = 6). In particular, quantitative data for α-SMA were analyzed according to the area under the curve (AUC). The yellow line represents the value of the surface plot profile and the calculated area under the curve. f Membrane and cytosol of EPRS1i-treated NRK-49F cells incubated in the absence or presence of TGF-β for 24 h. g mRNA levels of Eprs1 were analyzed by qPCR and normalized to Gapdh (n = 3). h Representative Western blot (left) and quantitative data (right) of EPRS1 expression in EPRS1i-treated cells under TGF-β treatment conditions for 24 h (n = 3). i Representative Western blot (left) and quantitative data (right) of protein (p-Smad3/Smad3) expression in EPRS1i-treated cells after 24 h of TGF-β treatment (n = 3). j The level of hydroxyproline in cultured cells was quantified via colorimetric assay (n = 3). k Proliferation of cells treated with the indicated concentrations of EPRS1i under TGF-β treatment conditions determined by a WST-1 assay. l Representative confocal images (left) of Ki67 in EPRS1i-treated cells under TGF-β treatment conditions for 24 h. The Ki67 ratio (right) was quantified by ImageJ analysis (n = 5). The data are presented as mean ± standard deviation. Statistical data were analyzed by ANOVA with Tukey’s post hoc test. *P < 0.05, **P < 0.01, and ***P < 0.001.
Fig. 7
Fig. 7. Genetic and pharmacological inhibition of EPRS1 decreases p-STAT3 in FA mice.
a Representative images of phospho-signal transducer and activator of transcription 3 (p-STAT3, brown) from an IHC-stained kidney showing the effect of genetic Eprs1 inhibition in FA mice. Scale bar = 50 μm. b The p-STAT3-positive area was quantified by ImageJ analysis (n = 4–6). c, d Representative Western blot and quantitative data of protein (p-STAT3/STAT3) expression in kidneys from the three groups. The numbers (1–13) indicate individual animals in a given group (n = 4–6). e, f Representative images and quantitative data showing the expression of p-STAT3 (brown) along with nuclei (blue) in each group to assess the effect of the EPRS1 inhibitor (n = 7–9). Scale bar = 50 μm. g, h Representative Western blot and quantitative data of protein (p-STAT3/STAT3) expression in the kidneys of the five groups. The numbers (1–13) indicate individual animals in a given group (n = 7–9). The data are presented as the means ± standard deviations. Statistical data were analyzed by ANOVA with Tukey’s post hoc test. *P < 0.05, **P < 0.01, and ***P < 0.001.
Fig. 8
Fig. 8. Genetic and pharmacological inhibition of EPRS1 improves mitochondrial dysfunction in FA mice and HK-2 cells.
a Representative images of aquaporin-1 (AQP-1) from IHC-stained kidneys. Scale bar = 100 μm. b The AQP-1-positive area was quantified by ImageJ analysis (n = 4–6). c Representative electron microscopy (EM) micrographs showing the effects of genetic Eprs1 inhibition on FA mice. The asterisk indicates tubular basement membrane thickening. The arrows indicate swollen mitochondria in each group (n = 4–6). Scale bar = 5 μm. d, e Quantitative data on the mitochondrial length and aspect ratio (ratio of large to small axes) were analyzed by ImageJ (n = 4–6). f Adenosine triphosphate (ATP) contents in whole kidney tissues from the three groups (n = 4–6). g, h Relative mRNA levels of ATP synthase and NADH dehydrogenase 1 (ND1) were analyzed via qPCR and normalized to those of 18S rRNA (n = 4–6). i Representative images of AQP-1 from IHC-stained kidneys used to assess the effect of the EPRS1 inhibitor. Scale bar = 100 μm. j The AQP-1-positive area was quantified by ImageJ analysis (n = 7–9). k Representative EM micrographs of kidney fibrosis in FA mice with or without EPRS1i treatment. The asterisk indicates tubular basement membrane thickening. The arrow indicates swollen mitochondria in FA mice. Scale bar = 5 μm. l, m Quantitative data on the mitochondrial length and aspect ratio were analyzed using ImageJ (n = 7–9). n ATP contents in whole kidney tissues from the five groups (n = 7–9). o, p Representative confocal images and quantitative data showing tetramethylrhodamine methyl ester (TMRM) activity in siEPRS1 (20 nM)-treated HK-2 cells under TGF-β (10 ng/ml) treatment conditions for 24 h (n = 4). Scale bar = 50 μm. q ATP contents in siEPRS1 (20 nM)-treated cells under TGF-β (10 ng/ml) treatment conditions were determined according to the manufacturer’s protocol (n = 4). Scale bar = 50 μm. r, s Representative confocal images and quantitative data showing TMRM in EPRS1i (1 μM)-treated cells under TGF-β (10 ng/ml) treatment conditions for 24 h (n = 8). Scale bar = 50 μm. t ATP contents in EPRS1i (1 μM)-treated cells under TGF-β (10 ng/ml) treatment conditions (n = 6). The data are presented as mean ± standard deviation. Statistical data were analyzed by ANOVA with Tukey’s post hoc test. *P < 0.05, **P < 0.01, and ***P < 0.001. siEPRS1: siRNA-mediated EPRS1.
Fig. 9
Fig. 9. Schematic showing that EPRS1-mediated fibroblast activation and mitochondrial dysfunction induce kidney fibrosis.
Our results indicate that EPRS1 can mediate kidney fibrosis. EPRS1 is an enzyme that catalyzes the binding of proline to tRNAPro. EPRS1 of the multi-tRNA synthetase complex (MSC) translationally synthesizes proline-rich profibrotic proteins. However, the EPRS1 inhibitor inhibits hydroxyproline. EPRS1 also activates the TGF-β pathway. EPRS1 can translocate to the cell membrane and bind to TGF-β receptor 1 (TβRI), resulting in downstream pathways. Our results demonstrated that EPRS1 is linked to three different pathways associated with kidney fibrosis. EPRS1 regulates the phosphorylation of STAT3 and Smad3. The nuclear localization of p-STAT3 and p-Smad3 induces the transcription of profibrotic genes. This pathway leads to fibroblast activation, resulting in increased ECM production, cell proliferation, and tissue remodeling. p-STAT3 affects mitochondrial reactive oxygen species (ROS) generation,. Eventually, ROS lead to mitochondrial dysfunction in cells. However, EPRS1 inhibition not only transcriptionally reduces p-Smad3 and p-STAT3 but also improves mitochondrial dysfunction. As a result, EPRS1 inhibition reduces kidney fibrosis through transcriptional and translational regulation. MSC multi-tRNA synthetase complex, ECM extracellular matrix, EMT epithelial‒mesenchymal transition, FMT fibroblast–mesenchymal transition, Pro proline, ROS reactive oxygen species. This figure was created with Biorender.com.

References

    1. Wang, C., Li, S. W., Zhong, X., Liu, B. C. & Lv, L. L. An update on renal fibrosis: from mechanisms to therapeutic strategies with a focus on extracellular vesicles. Kidney Res. Clin. Pract.42, 174–187 (2023). - PMC - PubMed
    1. Bülow, R. D. & Boor, P. Extracellular matrix in kidney fibrosis: more than just a scaffold. J. Histochem. Cytochem.67, 643–661 (2019). - PMC - PubMed
    1. Meran, S. & Steadman, R. Fibroblasts and myofibroblasts in renal fibrosis. Int. J. Exp. Pathol.92, 158–167 (2011). - PMC - PubMed
    1. Liu, Y. Renal fibrosis: new insights into the pathogenesis and therapeutics. Kidney Int.69, 213–217 (2006). - PubMed
    1. Kramann, R., DiRocco, D. P. & Humphreys, B. D. Understanding the origin, activation and regulation of matrix-producing myofibroblasts for treatment of fibrotic disease. J. Pathol.231, 273–289 (2013). - PubMed

LinkOut - more resources