. 2025 Jan;44(1):166-199.
doi: 10.1038/s44318-024-00316-w. Epub 2024 Dec 2.

In vivo HIV-1 nuclear condensates safeguard against cGAS and license reverse transcription

Affiliations

In vivo HIV-1 nuclear condensates safeguard against cGAS and license reverse transcription

Selen Ay et al. EMBO J. 2025 Jan.

Abstract

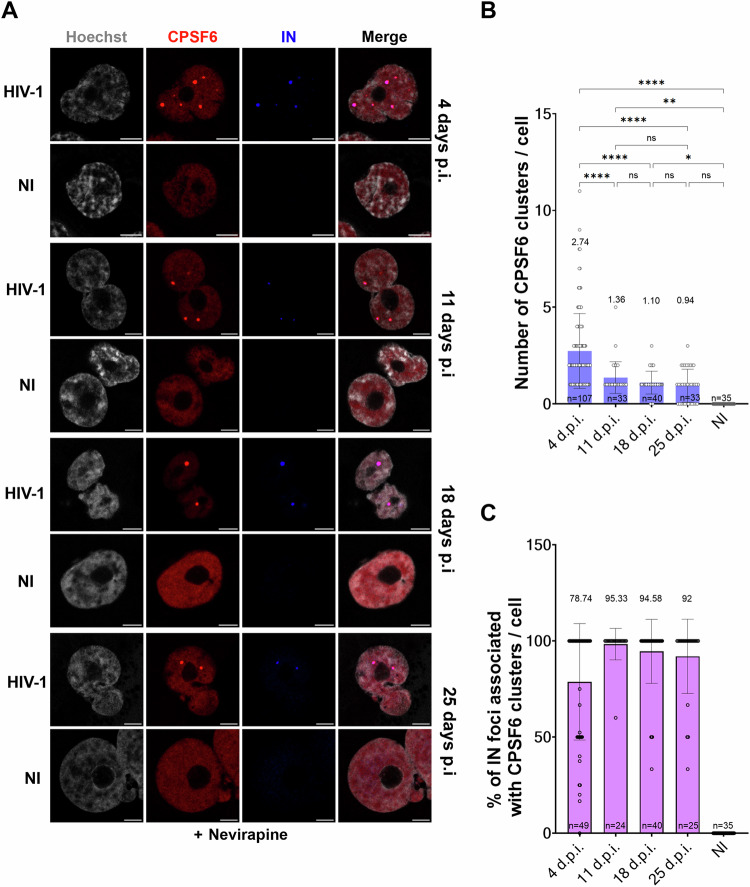
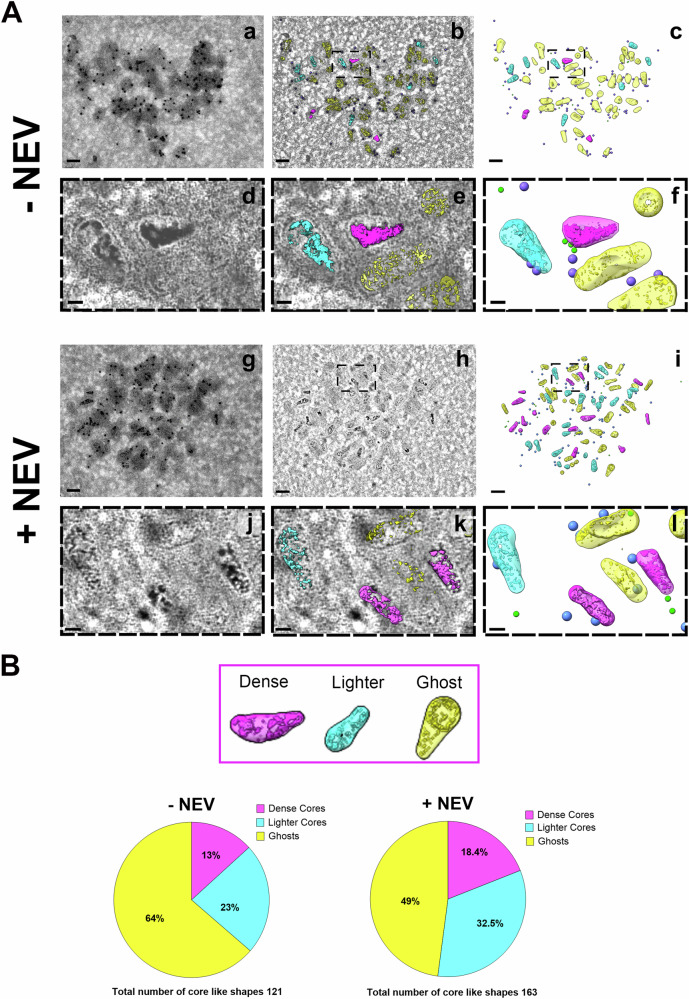
Entry of viral capsids into the nucleus induces the formation of biomolecular condensates called HIV-1 membraneless organelles (HIV-1-MLOs). Several questions remain about their persistence, in vivo formation, composition, and function. Our study reveals that HIV-1-MLOs persisted for several weeks in infected cells, and their abundance correlated with viral infectivity. Using an appropriate animal model, we show that HIV-1-MLOs were formed in vivo during acute infection. To explore the viral structures present within these biomolecular condensates, we used a combination of double immunogold labeling, electron microscopy and tomography, and unveiled a diverse array of viral core structures. Our functional analyses showed that HIV-1-MLOs remained stable during treatment with a reverse transcriptase inhibitor, maintaining the virus in a dormant state. Drug withdrawal restored reverse transcription, promoting efficient virus replication akin to that observed in latently infected patients on antiretroviral therapy. However, when HIV-1 MLOs were deliberately disassembled by pharmacological treatment, we observed a complete loss of viral infectivity. Our findings show that HIV-1 MLOs shield the final reverse transcription product from host immune detection.

Keywords: Biomolecular Condensates; HIV-1 Cores; Innate Immunity; Nuclear Reverse Transcription; Post-nuclear Entry Steps.


Conflict of interest statement

Disclosure and competing interests statement. The authors declare no competing interests.

Figures

Figure 1
Figure 1. HIV-1-MLOs persist in macrophage-like cells in presence of nevirapine.
(A) THP1 cells differentiated with phorbol 12-myristate 13-acetate (PMA) and treated with Nevirapine (NEV) were infected with HIV-1 ∆Env pseudotyped with VSV-G and carrying the IN with an HA tag (MOI 10). At different times post infection (p.i.), cells were fixed and labeled with antibodies to detect CPSF6 (in red) and IN (in blue). Nuclei were stained with Hoechst (in gray). Scale bar = 5 μm. (B) The histogram shows the quantification of the number of CPSF6 clusters per cell at different times p.i. Data from two independent experiments are shown as the mean ± SD (Ordinary one-way ANOVA test; ****: (4 d.p.i. vs 11 d.p.i. p-value = 0.0000149), (4 d.p.i. vs 18 d.p.i. p-value = 0.000000013), (4 d.p.i. vs 25 d.p.i. p-value = 0.000000004146790), 4 d.p.i. vs N.I. p-value = 0.000000000000277); **: p-value 0.0031; *: p-value 0.0216; ns (not significant p-value >0.05): (11 d.p.i. vs 18 d.p.i. p-value = 0.929), 11 d.p.i. vs 25 d.p.i. p-value = 0.73), (18 d.p.i. vs 25 d.p.i. p-value = 0.98), (25 d.p.i. vs N.I. p-value = 0.08). (C) Percentage of IN foci associated with CPSF6 clusters at different times p.i. The data derive from two datasets of biological replicates. Source data are available online for this figure.
Figure 2
Figure 2. CPSF6 condensates co-exist with active proviruses and shield viral RNA genomes.
(A) Schematic representation of the two systems (MCP-MS2 and RNA-FISH) applied for the detection of the viral RNAs (done with BioRender). The cartoon on the left illustrates the backbone of the virus carrying MS2 loops at the place of nef used for the experiments. The cartoon on the right represents a schema of RNA-FISH approach. (B) Comparison between infection (MOI 30) in presence or in absence of NEV and co-labeling of the vRNA with MCP GFP-MS2 (in green) and RNA FISH (in gray). CPSF6 clusters are detected by the antibody against CPSF6 (in red) (scale bar = 5 µm). On the right, the zoom of the two spots analyzed and the graph displaying the intensity profile of vRNA detected with both approaches, both inside and outside of the CPSF6 clusters. (C) Number of events (CPSF6 clusters and vRNA detected by MCP-GFP or RNA-FISH) in presence (left) or in absence (right) of NEV. Data from two datasets of biological replicates are shown as the mean ± SD (Ordinary one-way ANOVA test; data +NEV: ns p-value = 0.415, ∗∗∗∗: p-value=0.000000000031536, 0.000000002132483; data −NEV: ∗∗∗: p-value = 0.0008; *: p-value = 0.0120; ns: p-value = 0.0522). Percentage of RNA-FISH detections colocalizing with CPSF6 clusters or MCP-GFP-MS2 dots or alone, in presence (left) or in absence of NEV (right). (D) In the absence of NEV, a percentage of cells displaying MCP-MS2 puncta also showed CPSF6 clusters, and no association between MCP-MS2 puncta and CPSF6 clusters was detected, across a sample size of 14 cells. (E) THP-1 cells differentiated with PMA were infected with HIV-1 ∆Env pseudotyped with VSV-G and carrying the GFP reporter gene (schema made with BioRender). At 4 d.p.i., cells were fixed and labeled with an antibody to detect CPSF6 (in red) and with RNA-FISH probes (specific to the HIV-1 POL RNA sequence) to detect viral RNA (vRNA, in white) incoming or being transcribed by the cell. Productively infected cells expressed the GFP reporter protein (in green) and nuclei were stained with Hoechst (in blue) (scale bar = 5 µm). (F) Linear regression between the % of cells hosting CPSF6 clusters and the % of GFP-positive cells (GFP+), in 33 fields of view (R2 = 0.7514, P-value < 0.0001) (up). Linear regression between the number of vRNA transcription foci (outside CPSF6 clusters) and the number of incoming vRNA foci (co-localizing with CPSF6 clusters) per cell, in 62 cells (R2 = 0.5238, P-value <0.0001) (bottom). The error bars represent the 95% confidence interval of the simple linear regression curve calculated using Prism. (G) Proportion of GFP+ cells in the total cell population. The percentage of GFP negative cells carrying CPSF6 clusters (top) and proportion of cells presenting or not CPSF6 clusters in the GFP+ cells population (bottom) is indicated in pie charts. The data derive from two datasets of biological replicates. Source data are available online for this figure.
Figure 3
Figure 3. HIV-1-MLOs build during in vivo infection.
(A) Schema of CCR5-tropic HIV-1 strain (NLAD8) infection in BRGS mice (done with BioRender). (B) Graphs showing viral infectivity in BRGS mice by quantitative RT PCR, measuring the late reverse transcripts copies per mL of blood in each mouse (left) (Data are shown as the mean ± SD of two replicates), quantification of the percentage of cells presenting CPSF6 clusters per mouse (middle) and the number of CPSF6 clusters per nuclei in individual mice (right) (the n corresponds to the number of cells analyzed). (C) Mononucleated cells derived from BM of infected BRGS mice were differentiated ex vivo and labeled for the detection of the vRNA (in red) and CPSF6 (in green). Nuclei were stained with Hoechst (in blue) (scale bar = 2 µm). (D) Sphericity analysis conducted on CPSF6 clusters by ICY software. Source data are available online for this figure.
Figure 4
Figure 4. Viral components in nuclear condensates.
(A) At the top is a schematic representation of the viral genome used for electron microscopy (EM) experiments (done with BioRender). THP-1 cells infected or not for 3 days in presence of NEV. Sections were co-labeled with antibodies against CPSF6 and CA. (B) Three areas showing HIV-1-MLOs in the nucleus of infected cells in absence of NEV at 7 d.p.i. In the left column (overview panels) the cytoplasm is pseudocolored in purple to be easily discriminated from the nucleus (remaining in gray). In the middle column higher magnification projection images of the corresponding HIV-1-MLO sites are displayed. In the third column, close up views from the middle column images are shown. Some of the HIV-1 cores are easily recognized even in 2D projection images, one such core per image is pseudocolored in green (right column panels) for easier visualization. Diameter of CPSF6 immunogold beads = 10 nm, diameter of CA immunogold beads = 6 nm. Scale bar is shown in each panel. (C) Similar to (B) but cells were infected in presence of NEV for 7 days. (D) Cells were infected for 7 days and labeled with antibodies against CPSF6 and IN, followed by labeling with secondary antibodies conjugated to gold particles of 10 nm and 6 nm in size, respectively. The histogram shows the quantification of the number of integrase (IN) proteins detected by gold particles in the presence or absence of NEV. The statistical analysis was performed using the Mann–Whitney test (*p-value = 0.0212). Data are shown as the mean ± SD of two independent datasets. (E) Comparison between HIV-1-MLOs size and number of CPSF6 dots detection is shown in violins graphs. Two independent datasets from biological replicates have been included in the analysis. Data are shown as the mean ± SD (T test *p value = 0.0435; **p value = 0.0045). Source data are available online for this figure.
Figure 5
Figure 5. Viral nuclear condensates host different viral core morphologies.
(A) Different morphologies of HIV-1 core-like shapes inside CPSF6 clusters immuno-gold labeled are shown in the host cell nucleus. Ultrathin sections immunolabelled for CPSF6 (10 nm gold beads, annotated as purple spheres) and the capsid protein (6 nm gold beads, annotated in green) in presence and absence of NEV were screened using TEM. Large clusters of CPSF6 immunogold were observed in the cell nucleus. In (a), 2D projection image of a cluster observed in absence of NEV. In (b), one of the central slices of the dual-axis tomographic volume in the same area, revealing the presence of at least three different kinds of cores. In (c), full annotation of the different cores (very dense cores in magenta, less dense in cyan and ghosts in yellow). In (d) and (e), the zoomed area of the panel in (b) with and without the iso-surface rendering of the core interiors. In (f), the equivalent zoomed area of (d) and (e) only with the different kind of cores and beads annotated. In (g), 2D projection image of a cluster observed in presence of nevirapine. In (h), one of the central slices of a dual-axis tomographic volume in the same area. In (i), the full annotation of the different cores. In (j) and (k), the zoomed area of the panel in (h) with and without the iso-surface rendering of the core interiors. In (l), the equivalent zoomed area of (j) and (k) only with the different kind of cores and beads annotated. Color coding follows the one of panels (a–f). Scale bar for panels (a–c) and (g–l) is 100 nm. Scale bar for panels (d–f) and (j–l) is 20 nm. (B) Percentage of dense cores, lighter cores and ghosts in cells treated (right) and untreated (left) with NEV from 284 total cores. Source data are available online for this figure.
Figure 6
Figure 6. CPSF6 condensate disassembly impedes nuclear viral reverse transcription after nevirapine removal.
(A) THP1 cells differentiated with PMA were infected (with HIV-1 ∆Env pseudotyped with VSV-G and carrying the GFP reporter gene, schema Fig. 2E) (MOI 10) for 120 h without any treatments, or treated with NEV for 120 h, or treated with NEV and washed out after 48 h adding or not PF74 (25 µM) and then left without any treatments for 72 h. Cells were fixed 120 h p.i. (first panel from the left). Productive infection was quantified by FACS through GFP expression intensity (2nd panel starting from the left). Fixed cells were labeled with an antibody to detect CPSF6 (in red). Productively infected cells expressed the GFP reporter protein (in green) and nuclei were stained with Hoechst (in blue) (scale bar = 5 µm) (3rd panel from the left). (B) Histograms showing the quantification of CPSF6 clusters per cell (almost 100 cells per condition have been analyzed) from two datasets of biological replicates (top panel). Data are shown as the mean ± SD (Ordinary one-way ANOVA test; ****: p-value = 0.000000000273883, 0.000059345976010, <0.000000000000001, 0.000000000021184; ***: p-value = 0.0002; *: p-value = 0.0473). Quantitative PCR: early viral reverse transcripts (ERT) per cell (middle panel) or late viral reverse transcripts (LRT) per cell (lower panel) in the different culture conditions. A representative experiment is shown, based on two independent experiments, each performed with three replicates. (C) THP-1 cells were treated with a high dose of PF74 (25 µM) at 48 h post-infection (h.p.i.) (MOI 10), while a control group remained untreated. The number of puncta from CPSF6 (indicated by white arrows) and CA (indicated by yellow arrows) were quantified in both cell populations, with the results presented in the violin graph (number of cells analyzed = 222). The data are derived from three independent experiments and shown as the mean ± SD. An ordinary one-way ANOVA test was used for statistical analysis; **** indicates a p-value = 0.000000000000076, 0.000000000000081 and ‘ns’ denotes not significant p-value = 0.947850878211297. Scale bar: 5 µm. Source data are available online for this figure.
Figure 7
Figure 7. CPSF6 condensates shield viral genomes from cGAS in the nucleus of infected cells.
(A) THP-1 cells differentiated with PMA were infected with HIV-1 ∆Env pseudotyped with VSV-G, in presence or absence of NEV, with EdU supplemented to the media. Fixed cells were labeled with an antibody to detect CPSF6 (in red) and viral DNA (vDNA) was revealed through EdU Click-chemistry (in gray). Nuclei were stained with Hoechst (in blue) (scale bar = 1 µm). The right panel shows the quantification of vDNA spots colocalizing with CPSF6 clusters per nucleus, in presence or absence of NEV (error bars are represented as ± SD, unpaired Welch’s t-test; ****: p-value = 0.000002014358640). (B) Model illustrating the disassembly of HIV-1-MLOs potentially exposing vDNA (on the top) (made with BioRender). THP-1 cells differentiated with PMA were infected with HIV-1 ∆Env pseudotyped with VSV-G, in presence or absence of NEV. 48 h p.i. cells were treated with PF74 or not (bottom left panel presents the various culture conditions). Ten hours post PF74 treatment, cells were lysed and cGAMP levels were measured by cGAMP ELISA assay (bottom right panel). The fold increase of cGAMP in each sample with respect to uninfected cells is represented. The data are derived from three independent experiments and shown as the mean ± SD. (Ordinary one-way ANOVA test; ns: p-value = 0.428237768384628; ****: p-value = 0.000006748324383, 0.000001340723954). (C) cGAMP measurements were taken at 2 h post PF74 treatment. Following treatment, cells were lysed, and cGAMP levels were quantified using a cGAMP ELISA assay. The fold increase in cGAMP levels, compared to uninfected cells, is depicted in a violin graph for THP-1 cells that were either untreated or treated with a high dose of PF74. Statistical analysis was conducted using unpaired Welch’s t-test; **indicates a p-value = 0.0084. Data derive from two independent experiments and shown as the mean ± SD. (D) Role of CPSF6 in cGAS activation evaluated using THP-1 KO for CPSF6. Western blot showing control cells (Ctrl) and CPSF6 knock out (KO) THP-1 cells obtained by CRISPR Cas9 technology. Cells were infected (maintaining a similar time used for the samples treated with PF74 in (B)) and lysed. cGAMP levels were quantified using a cGAMP ELISA assay. Statistical analysis was conducted using t-test; * denotes a p-value = 0.0141. Data derive from two independent experiments and shown as the mean ± SD. Source data are available online for this figure.
Figure 8
Figure 8. Dissolution of CPSF6 condensates induces the activation of ISGs in both THP-1 cells and primary infected cells.
(A) ISGs induced after PF74 treatment. Twenty-four hours after treatment with PF74, or without any treatment, HIV-1 infected THP-1 cells (MOI 10) were analyzed for the expression of interferon-stimulated genes (ISGs) by RT-PCR: MxA, CXCL10, and IFIT-2. Fold increase RT-PCR data on amplicons derived from infected cells treated with PF74 in comparison to infected untreated cells are displayed. Statistical analysis was performed using one-way ANOVA test; MxA * indicates a p-value = 0.0163; CXCL10 *p value = 0.0354; IFIT2 *p value = 0.0152. Data derive from two independent experiments with four replicates for each and shown as the mean ± SD. (B) MDMs were infected with MOI 30 and treated or not with high dose of PF74. The cellular RNA extracted was used as template to amplify ISGs by RT-PCR: MxA, CXCL10, and IFIT-2. Fold increase RT-PCR data on amplicons derived from infected cells treated with PF74 in comparison to infected untreated cells from 6 healthy donors. Statistical analysis was performed using a one-way ANOVA test, data are shown as the mean ± SD of three replicates from each donor. MxA *** indicates a p-value = 0.000944, CXCL10 *** indicates a p-value = 0.000969 and IFIT2 ** indicates a p-value = 0.00478. Source data are available online for this figure.
Figure EV1
Figure EV1. HIV-1-MLOs build during in vivo infection, related to Fig. 3.
(A) Schema of CCR5-tropic HIV-1 strain (NLAD8) infection in BRGS mice for 10 days. Bone marrow human CD4+ cells were immediately labeled and imaged without the need of cell culture passage. (B) Graph showing viral infectivity in BRGS mice by quantitative RT PCR (Data are shown as the mean ± SD of two replicates). (C) CD4+ cells derived from BM of infected BRGS mice were directly fixed and labeled for the detection of CPSF6 (in green). Nuclei were stained with Hoechst (in blue).
Figure EV2
Figure EV2. Asynchronous viral reactivation in nuclear HIV-1-MLOs, related to Fig. 2 and 4.
(A) THP-1 cells infected with HIV-1 ∆Env pseudotyped with VSV-G and carrying the GFP as reporter gene at 3 and 7 d.p.i. +/− NEV or after washout of NEV at 3 d.p.i. and live imaging (EVOS microscope) were done at 7 and 12 d.p.i., respectively. (B) The increased ratio of GFP+ cells between the first 2 time points p.i. and post wash out. (C) Percentage of GFP after recovery of RT post wash out at different time p.i. Cells infected without NEV were considered as 100%.
Figure EV3
Figure EV3. Viral core classification in HIV-1-MLOs, related to Fig. 5.
(A) Nuclear HIV-1-MLOs composition classes in absence of NEV: in the panels (a, e) projection images at sites of interest as recorded by the detector. Immunogold labeling (10 nm beads) are labeling the CPSF6 at HIV-1-MLOs. In the panels (b, f) a slice from the middle of the dual-axis tomographic volume where HIV cores are more easily observed. Examples of the three different classes as they identified according to the criteria below in dense cores (in magenta boxes), lighter cores (in blue boxes) and ghosts (in yellow boxes). Assigning core classes in absence of NEV: Pixel classification predictions for two different sites shown here (c, d, g, h). In the left column, initial user input (labels) are shown in the images as thin lines together with the predictions for the rest of the image (c, g). The prediction of ghosts was not possible using all features selected in Ilastik, and the pixels were most commonly classified as background (background was seeded as a separate longer label, here in white). In the right column (d, h), pixel classification predictions are overlaid with the manual traced contours of cores, colored according to the underline predictions. Magenta and blue predictions outside the cores are either due to immunogold beads that are still contributing to the slice under evaluation, or sometimes due to Tokuyasu artifacts (darker/thicker area in Bg). Scale bars = 100 nm. Percentage of HIV core shapes (pie chart): HIV cores were included in this analysis only when their longer axis was parallel or near parallel to the tomographic XY plane. The cores were classified as cones in the case an orientation (head to tip) could be assigned easily to them. The characteristic conical shape of the HIV was easily identifiable in most of the cases. In the rest of the cases, where the head could not be identified, HIV cores were assigned as of tubular shape. (B) Nuclear HIV-1-MLOs composition in presence of NEV (panels a, b, e, f), assigning core classes (panels c, d, g, h) and percentage of HIV core shapes (pie chart) have been processed as in (A).
Figure EV4
Figure EV4. Viral core intensity analysis and comparison to free viruses, related to Fig. 5.
(A) Intensity analysis of HIV cores. A representative core from mature virions before infection (first row), a representative of a dense core inside a nuclear MLO (second row), a representative core with lighter dark areas inside a nuclear MLO (third row) and a representative of a “ghost” or empty core in HIV-1-MLOs (forth row). In middle column only the inside of the core intensities are maintained, while in the third column only the exterior intensities are visible. (B) A scatter plot from the internal mean intensity (y axes) (negative values represent denser signal) vs external mean intensity (x axes) of individual cores. The diameter of the dots represents the standard deviation of the mean interior intensity for each individual core. In gray, the corresponding values from mature virions before the infection, in magenta the values from full cores inside the MLOs, cores in MLOs with intermediate intensities are in blue and the values from ghosts in MLOs are in yellow. (C) A ghost core detected by anti-CA antibody (green bead) is decorated with anti-CPSF6 antibody (purple beads). The left panel shows the original volume section, while the right panel is pseudocolored: yellow indicates the ghost core, and purple highlights the dark intensity near the core’s head. Scale bar 50 nm.
Figure EV5
Figure EV5. High PF74 dosage leads to the disassembly of CPSF6 condensates, related to Figs. 6, 7 and 8.
Immunostaining of cells kept in the same culture conditions as in Fig. 6A and an additional condition with lower PF74 dosage (1.25 µM) (blue = Hoechst; green = GFP; red = CPSF6; scale bar = 20 µm) (top panel). Graph showing the quantification of CPSF6 clusters per cell in cells treated with PF74 (1.25 and 25 µM) or not (Data are shown as the mean ± SD of two datasets of biological replicates, statistical test: ordinary one-way ANOVA; ∗∗∗∗: p-value= 6 × 10⁻¹⁴; ns: p-value = 0.6040) (bottom panel).

References

    1. Alberti S, Gladfelter A, Mittag T (2019) Considerations and challenges in studying liquid-liquid phase separation and biomolecular condensates. Cell 176:419–434 - PMC - PubMed
    1. Ay S, Di Nunzio F (2023) HIV-induced CPSF6 condensates. J Mol Biol 435:168094 - PubMed
    1. Ballandras-Colas A, Maskell DP, Serrao E, Locke J, Swuec P, Jónsson SR, Kotecha A, Cook NJ, Pye VE, Taylor IA et al (2017) A supramolecular assembly mediates lentiviral DNA integration. Science 355:93–95 - PMC - PubMed
    1. Bejarano DA, Peng K, Laketa V, Börner K, Jost KL, Lucic B, Glass B, Lusic M, Müller B, Kräusslich HG (2019) HIV-1 nuclear import in macrophages is regulated by CPSF6-capsid interactions at the nuclear pore complex. Elife 8:e41800 - PMC - PubMed
    1. Bertrand E, Chartrand P, Schaefer M, Shenoy SM, Singer RH, Long RM (1998) Localization of ASH1 mRNA particles in living yeast. Mol Cell 2:437–445 - PubMed

Substances

LinkOut - more resources