. 2025 Jan;44(2):356-381.
doi: 10.1038/s44318-024-00324-w. Epub 2024 Dec 2.

Rhythmic astrocytic GABA production synchronizes neuronal circadian timekeeping in the suprachiasmatic nucleus

Affiliations

Rhythmic astrocytic GABA production synchronizes neuronal circadian timekeeping in the suprachiasmatic nucleus

Natalie Ness et al. EMBO J. 2025 Jan.

Abstract

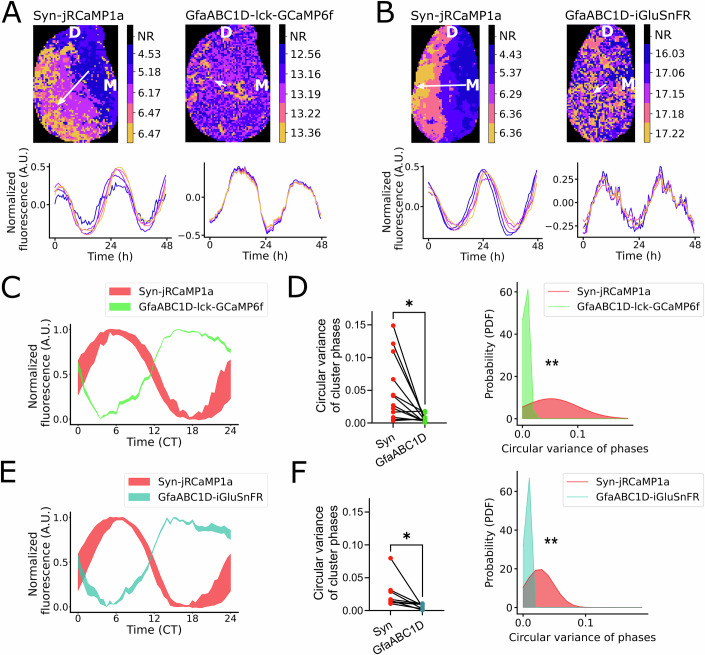
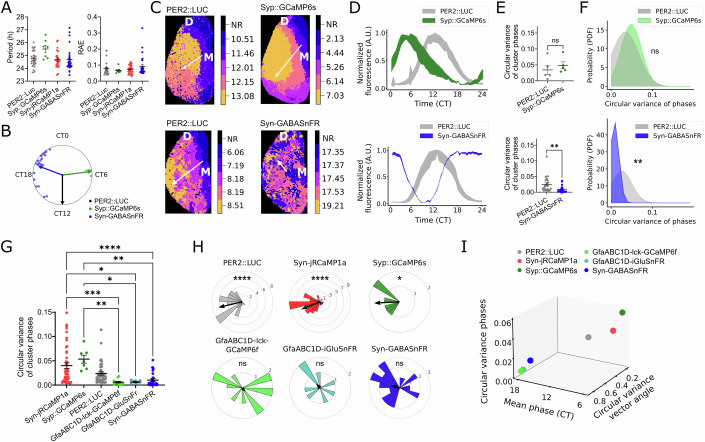
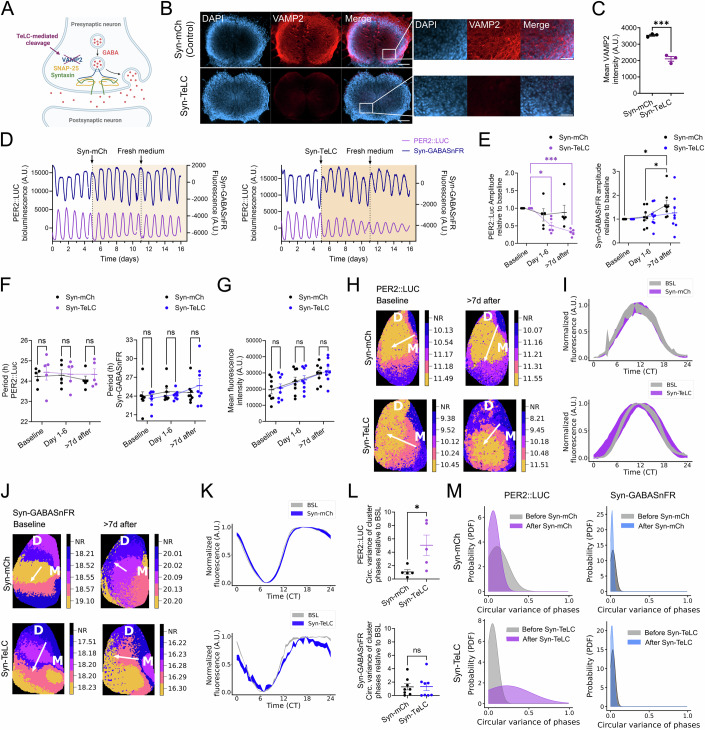
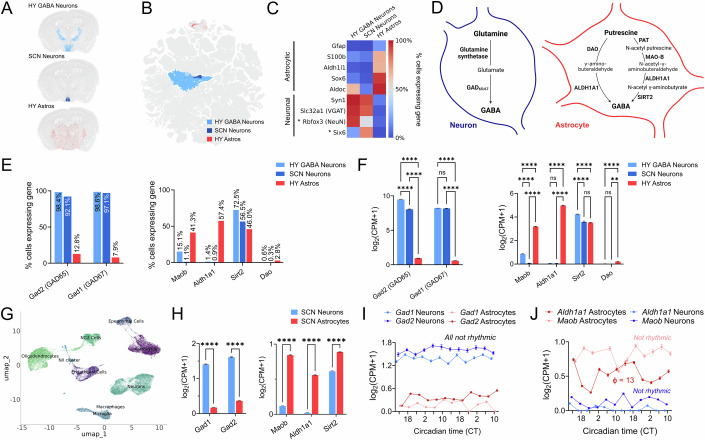
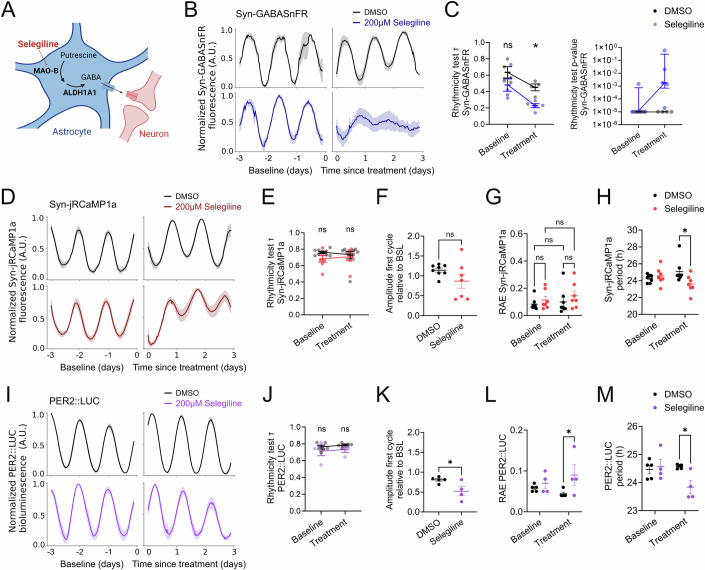
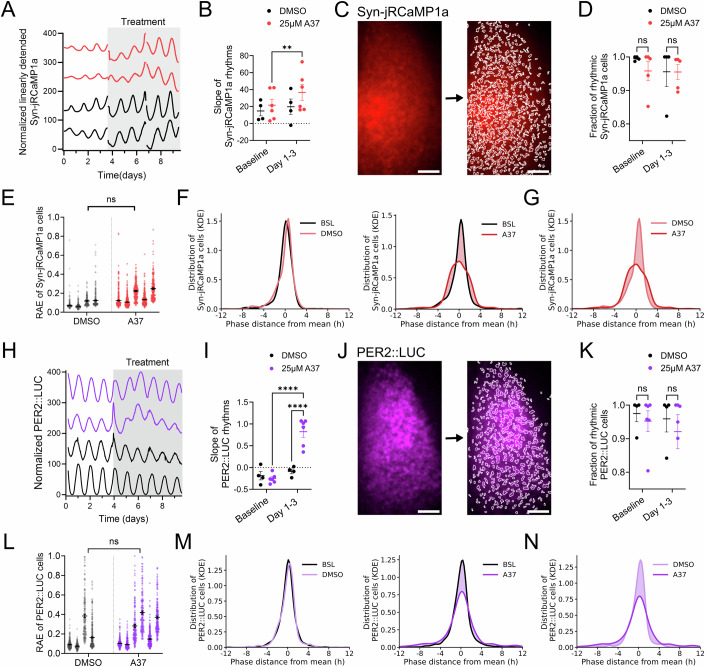
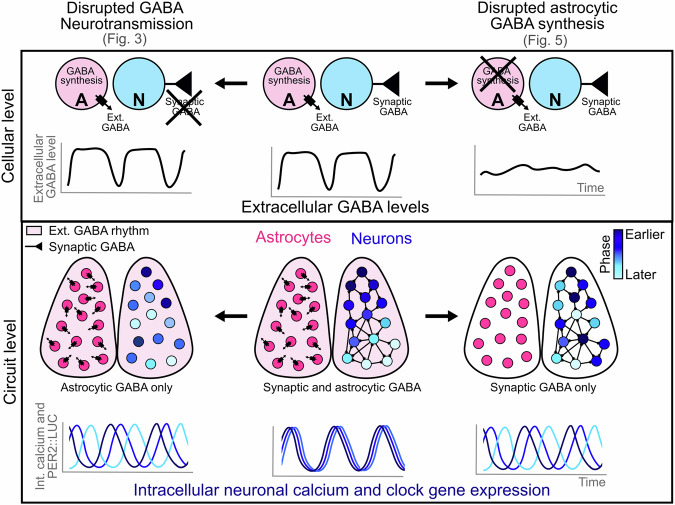
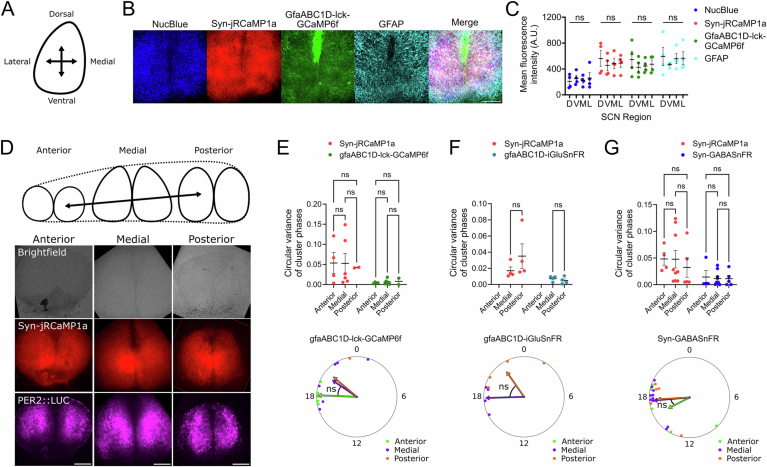
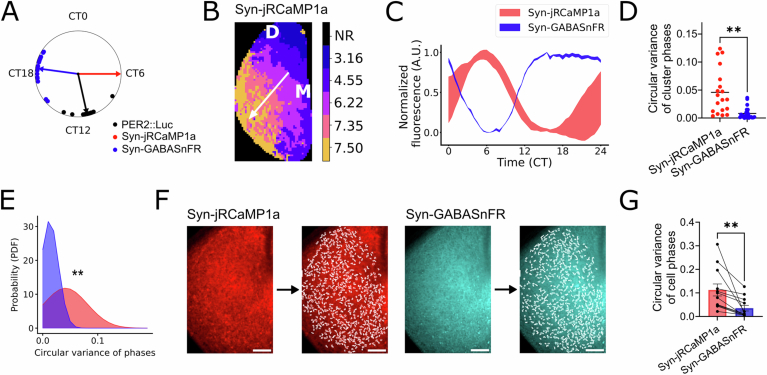
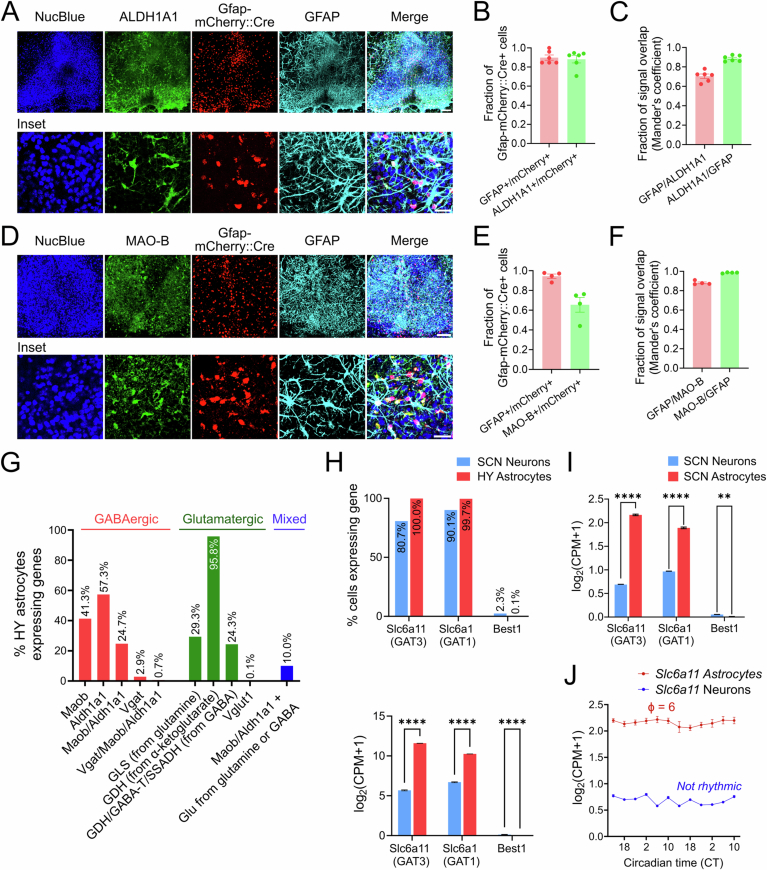
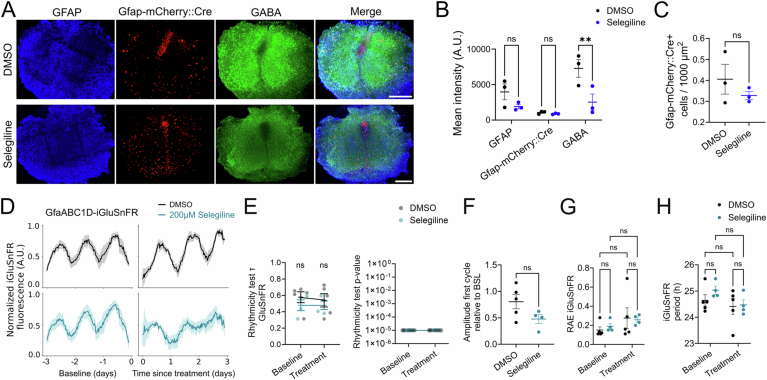
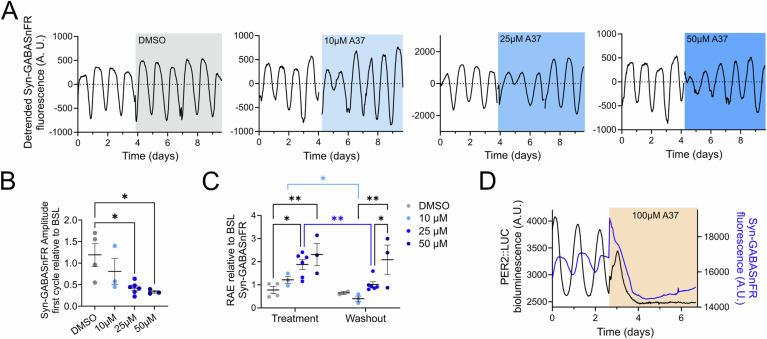
Astrocytes of the suprachiasmatic nucleus (SCN) can regulate sleep-wake cycles in mammals. However, the nature of the information provided by astrocytes to control circadian patterns of behavior is unclear. Neuronal circadian activity across the SCN is organized into spatiotemporal waves that govern seasonal adaptations and timely engagement of behavioral outputs. Here, we show that astrocytes across the mouse SCN exhibit instead a highly uniform, pulse-like nighttime activity. We find that rhythmic astrocytic GABA production via polyamine degradation provides an inhibitory nighttime tone required for SCN circuit synchrony, thereby acting as an internal astrocyte zeitgeber (or "astrozeit"). We further identify synaptic GABA and astrocytic GABA as two key players underpinning coherent spatiotemporal circadian patterns of SCN neuronal activity. In describing a new mechanism by which astrocytes contribute to circadian timekeeping, our work provides a general blueprint for understanding how astrocytes encode temporal information underlying complex behaviors in mammals.

Keywords: Astrocyte; Circadian Clock; GABA; MAO-B; SCN.


Conflict of interest statement

Disclosure and competing interests statement. The authors declare no competing interests.

Figures

Figure 1
Figure 1. Astrocytes and neurons of the SCN show distinct patterns of network synchronization.
(A, B) Representative circadian phase map of Syn-jRCaMP1a co-detected with GfaABC1D-lck-GCaMP6f (A), or GfaABC1D-iGluSnFR (B), in SCN slices. One SCN is shown (top: dorsal—D, right: medial—M), showing dorsomedial to ventrolateral spatiotemporal progression of neuronal activity (reported by Syn-jRCaMP1a), as opposed to uniform phase distribution of astrocytic activity (reported by GfaABC1D-lck-GCaMP6f and GfaABC1D-iGluSnFR). The color bar shows the circadian phase of each cluster. NR = non-rhythmic. White vectors indicate the direction of phase progression. Time series of each cluster with the corresponding color is shown below. (C) Representative standard deviation of cluster time series within SCN co-expressing Syn-jRCaMP1a and GfaABC1D-lck-GCaMP6f, showing less variance across clusters in astrocytic calcium compared to neuronal calcium. CT = Circadian time. (D) Inter-cluster phase dispersal (measured by circular variance) of co-detected Syn-jRCaMP1a and GfaABC1D-lck-GCaMP6f (left), with PDF of cluster phase variance (right). N = 12 SCN slices. Left panel shows paired two-tailed t test, P = 0.0105. Right panel shows Kolmogorov–Smirnov test, P = 0.0079. (E) Representative standard deviation of cluster time series within a slice co-expressing Syn-jRCaMP1a and GfaABC1D-GluSnFR, showing similarly reduced variance across clusters of astrocytic glutamate, when compared to neuronal calcium. CT = Circadian time. (F) Inter-cluster phase dispersal of co-detected Syn-jRCaMP1a and GfaABC1D-iGluSnFR (left), with PDF of cluster phase variance (right). N = 8 SCN slices. Left panel shows paired two-tailed t test, P = 0.0477. Right panel shows Kolmogorov–Smirnov test, P = 0.0025. Each data point represents one SCN slice. *P < 0.05, **P < 0.01. A detailed statistical report for this figure is provided in Appendix Table S1. Source data are available online for this figure.
Figure 2
Figure 2. Circadian rhythms of extracellular GABA co-segregate with reporters of astrocyte activity and not with neuronal ones.
(A) Period and relative amplitude error (RAE) of circadian oscillations of PER2::LUC, Syp::GCaMP6s, Syn-jRCaMP1a and Syn-GABASnFR. One-way mixed-effects model with matching, and post hoc Tukey’s test shown. All non-significant. Each dot presents one SCN slice. PER2::LUC (N = 26 SCN slices), Syp::GCaMP6s (N = 7), Syn-jRCaMP1a (N = 25) and Syn-GABASnFR (N = 28). (B) Rayleigh plot showing circadian phase of Syp::GCaMP6s (dark green) and Syn-GABASnFR (blue) rhythms, relative to co-detected PER2::LUC. Each point indicates 1 SCN slice. Vector direction indicates mean phase, length of vector is a measure of circular dispersion. (C) Representative circadian phase cluster map of co-detected PER2::LUC and Syp::GCaMP6s (top) or Syn-GABASnFR (bottom). One SCN nucleus is shown (dorsal (D) and medial (M) area indicated). Color bars indicate cluster phases, NR = non-rhythmic. White arrow indicates the direction of the phase progression. (D) Representative standard deviation of cluster time series of co-detected PER2::LUC and Syp::GCaMP6s (top) or Syn-GABASnFR (bottom). (E) Inter-cluster phase dispersal (measured by circular variance) of co-detected PER2::LUC and Syp::GCaMP6s (N = 5 SCN slices, P = 0.480), or Syn-GABASnFR (N = 22, P = 0.0079). Paired two-tailed t test shown. (F) PDF of cluster phase variance for each co-detected reporter, with Kolmogorov–Smirnov test: Syp::GCaMP6s P = 0.357 and Syn-GABASnFR P = 0.00236. (G) Inter-cluster phase dispersal of Syn-jRCaMP1a (N = 46 SCN slices), Syp::GCaMP6s (N = 7 SCN slices), PER2::LUC (N = 42 SCN slices), GfaABC1D-lck-GCaMP6f (N = 12 SCN slices), GfaABC1D-GluSnFR (N = 8 SCN slices) and Syn-GABASnFR (N = 30 SCN slices). Mixed-effects analysis with matching, P < 0.0001, and Tukey’s post hoc test shown. Significant comparisons in order shown top to bottom: ****P < 0.0001, **P = 0.0029, *P = 0.0157, *P = 0.0143, ***P = 0.001, and **P = 0.0035. (H) Circular histogram of directionality of phase progression across the SCN (see representative white arrows in (C)). Frequency of SCN slices within bar indicated by y-axis circle labels. The vector angle indicates the mean direction, length of the vector indicates circular dispersion. Rayleigh test of uniformity for PER2::LUC P < 0.0001, Syn-jRCaMP1a P < 0.0001, Syp::GCaMP6s P = 0.0151, GfaABC1D-lck-GCaMP6f P = 0.753, GfaABC1D-iGluSnFR P = 0.763, and Syn-GABASnFR P = 0.0870. (I) Correlation of mean circular variance of cluster phases, circular variance of phase wave directionality and mean phase (CT). All scatter graphs show mean ± SEM. ns = non-significant, *P < 0.05, **P < 0.01, ***P < 0.001, ****P < 0.0001. A detailed statistical report for this figure is provided in Appendix Table S1. Source data are available online for this figure.
Figure 3
Figure 3. Disrupting synaptic GABA transmission via tetanus toxin light chain desynchronizes PER2::LUC clusters without affecting circadian oscillations of GABA.
(A) Schematic showing mechanism of blockade of GABAergic synaptic transmission by TeLC-dependent cleavage of the SNARE complex protein VAMP2. (B) Representative widefield images and insets of SCN slices expressing Syn-mCherry (control, top) or Syn-TeLC-mCherry (bottom) labeled with anti-VAMP2 antibody and DAPI, scale bar = 200 µm. Inset scale bar = 20 µm. (C) Quantification of mean VAMP2 intensity within the SCN. NSyn-mCh = 3, NSyn-TeLC = 3 SCN slices, two-tailed t test, P = 0.0008. (D) Representative detrended time series of SCN slices expressing reporters for extracellular GABA (Syn-GABASnFR) and PER2::LUC before and after treatment with Syn-mCherry (left) or Syn-TeLC-mCherry (right). (E) Amplitude relative to baseline of rhythms of PER2::LUC (left) and Syn-GABASnFR (right). Two-way ANOVA with post hoc Šidák’s test, PER2::LUC: P = 0.0152 for baseline-Day 1–6; P = 0.0002 for baseline->7 d after; Syn-GABASnFR: P = 0.042 for BSL- > 7 d after, P = 0.0249 for Day 1-6- > 7 d after. (F) Circadian period of PER2::LUC (left) and Syn-GABASnFR rhythms (right). NPER2::LUC = 5 SCN slices, NSyn-GABASnFR = 8 SCN slices. Two-way ANOVA with post hoc Šidák’s test shown. (G) Mean fluorescence intensity of Syn-GABASnFR signal across timepoints. NPER2::LUC = 5, NSyn-GABASnFR = 8 SCN slices. Two-way ANOVA with post hoc Šidák’s test shown. (H) Representative circadian phase cluster map of PER2::LUC before and >7 days after transduction with Syn-TeLC-mCherry (bottom) or mCherry control (top). One SCN nucleus is shown, orientation as indicated (dorsal—D, medial—M). Color bar indicates circadian phases of clusters, NR = non-rhythmic. White vector indicates the directionality of phase progression. (I) Representative standard deviation of cluster time series shown in (H). (J) Representative circadian phase cluster map of Syn-GABASnFR co-detected with PER2::LUC shown in (H) before and >7 days after viral transduction. (K) Representative standard deviation of cluster time series shown in (J). (L) Inter-cluster phase dispersal of PER2::LUC (top) or Syn-GABASnFR (bottom) relative to baseline, with two-tailed t test, PER2::LUC P = 0.0338, Syn-GABASnFR P = 0.259; NPER2::LUC = 5, NSyn-GABASnFR = 8 SCN slices. (M) PDF of cluster phase variance shown in (L); NPER2::LUC = 5, NSyn-GABASnFR = 8 SCN slices. All data shown mean ± SEM unless otherwise indicated. For longitudinal data, connecting lines are shown between means. ns = non-significant. *P < 0.05, ***P < 0.001. A detailed statistical report for this figure is provided in Appendix Table S1. Source data are available online for this figure.
Figure 4
Figure 4. The polyamine-to-GABA biosynthetic pathway is specifically expressed in hypothalamic astrocytes but not in SCN neurons.
(A) Schematic of data from (Yao et al, 2023) spatial cell-type atlas of the mouse brain acquired using MERFISH, indicating the approximate positions of hypothalamic GABAergic neurons, SCN neurons and astrocytes in a mouse brain. (B) UMAP plot of data from (Yao et al, 2023) scRNA-Seq dataset, showing hypothalamic GABAergic neurons (‘HY GABA Neurons’, light blue), SCN neurons (blue) and hypothalamic astrocytes (‘HY Astros’, red), used for analyses from (CF). (C) Heatmap showing the percentage of cells expressing various cell-type specific markers in hypothalamic GABAergic neurons, SCN neurons and hypothalamic astrocytes. Genes marked with * are known to be differentially expressed in SCN neurons. (D) Schematic depicting GABA biosynthetic pathways previously observed in neurons or astrocytes. Left diagram shows neuronal GABA synthesis from glutamine via GAD65/67 (canonical pathway), right diagram shows astrocytic GABA biosynthetic pathways from putrescine (noncanonical pathway). (E) Percentage of cells expressing genes from the GABA biosynthetic pathways shown in D by cell-type. GAD65/67 are highly expressed in neurons, but not astrocytes, while noncanonical MAO-B-dependent putrescine-to-GABA synthesis pathway components are specifically expressed in astrocytes. (F) Normalized gene expression levels of genes shown in (E). N = 36,019 hypothalamic GABAergic neurons, N = 1836 SCN neurons and N = 20,549 hypothalamic astrocytes. Two-way ANOVA with post hoc Šidák’s test. (G) UMAP plot of SCN-restricted scRNA-Seq dataset (Wen et al, 2020), with cell-type annotation. (H) Normalized expression levels of genes involved in GABA biosynthesis. N = 12,018 SCN neurons and N = 8429 SCN astrocytes. Two-way ANOVA with post hoc Šidák’s test shown. (I) Time series of normalized gene expression of neuronal GABA biosynthesis genes Gad1 and Gad2 in SCN neurons and astrocytes. N = 12,018 neurons and N = 8429 astrocytes with 238–2410 cells/timepoint. eJTK Cycle rhythmicity test with Benjamini–Hochberg correction, all P > 0.05. (J) Time series of normalized expression levels of astrocytic GABA biosynthesis genes Aldh1a1 and Maob in SCN neurons and astrocytes. N = 12,018 neurons and N = 8429 astrocytes with 238–2410 cells/ timepoint. eJTK Cycle rhythmicity test with Benjamini–Hochberg correction, P = 0.022 for Aldh1a1 in astrocytes peaking at CT13 (indicated as ϕ on the plot), all other time series P > 0.05. All data show mean ± SEM, ns = non-significant, **P < 0.01, ****P < 0.0001. A detailed statistical report for this figure is provided in Appendix Table S1. Source data are available online for this figure.
Figure 5
Figure 5. Pharmacological inhibition of MAO-B abolishes circadian rhythms of extracellular GABA in SCN slices and shortens the circadian period of neuronal calcium and clock gene expression.
(A) Schematic of Selegiline action on polyamine GABA biosynthesis in astrocytes. (B) Averaged, aligned time series of Syn-GABASnFR in SCN slices before and after treatment with 200 µM Selegiline (blue) or DMSO vehicle (black). NDMSO = 4, NSelegiline = 5 SCN slices. (C) Left panel shows τ values obtained from eJTK Cycle rhythmicity test on time series of Syn-GABASnFR before and within 1–3 days after treatment with Selegiline or DMSO. Right panel shows the P value obtained from eJTK Cycle rhythmicity test empirically calculated against random noise data. NDMSO = 4, NSelegiline = 5 SCN slices. P = 0.0303 for DMSO vs Selegiline at treatment. (D) Averaged, aligned time series of neuronal calcium (Syn-jRCaMP1a) before and after treatment with 200 µM Selegiline (red) or DMSO (black). NDMSO = 8, NSelegiline = 7 SCN slices. (E) τ values obtained from eJTK Cycle rhythmicity test on time series of Syn-jRCaMP1a before and within 1–3 days after treatment with Selegiline or DMSO; NDMSO = 8, NSelegiline = 7 SCN slices. (F) Syn-jRCaMP1a amplitude of the first cycle of rhythms (over 30 h) after treatment with Selegiline or DMSO relative to baseline. NDMSO = 8, NSelegiline = 7 SCN slices. Two-tailed unpaired t test, P = 0.138. (G) RAE of Syn-jRCaMP1a rhythms before and after treatment NDMSO = 8, NSelegiline = 7 SCN slices. (H) Period of Syn-jRCaMP1a rhythms before and after treatment, P = 0.0176 for DMSO vs Selegiline at treatment. NDMSO = 8, NSelegiline = 7 SCN slices (I) Averaged, aligned time series of PER2::LUC before and after treatment with 200 µM Selegiline (purple), or DMSO (black). NDMSO = 5, NSelegiline = 4 SCN slices. (J) τ values obtained from eJTK Cycle rhythmicity test on time series of PER2::LUC before and within 1–3 days after treatment with Selegiline or DMSO; NDMSO = 5, NSelegiline = 4 SCN slices. (K) PER2::LUC amplitude of first cycle of rhythms (over 30 h) after treatment with Selegiline or DMSO, relative to baseline. NDMSO = 5, NSelegiline = 4 SCN slices. Two-tailed unpaired t test, P = 0.0341. (L) RAE of PER2::LUC rhythms before and after Selegiline treatment; NDMSO = 5, NSelegiline = 4 SCN slices; P = 0.0443 for DMSO vs Selegiline at treatment. (M) Period of PER2::LUC rhythms before and after Selegiline treatment, NDMSO = 5, NSelegiline = 4 SCN slices, P = 0.0214 for DMSO vs Selegiline at treatment. All graphs, including time series, show mean ± SEM, except right panel in (C), showing median ± interquartile range due to logarithmic scale. All graphs with multiple comparisons show two-way mixed-effects analysis with matching, with post hoc Šidák’s test. ns=non-significant, *P < 0.05. A detailed statistical report for this figure is provided in Appendix Table S1. Source data are available online for this figure.
Figure 6
Figure 6. Pharmacological inhibition of ALDH1A1 temporarily suppresses rhythms of extracellular GABA in SCN organotypic slices.
(A) Schematic of A37 action on polyamine GABA biosynthesis in astrocytes. (B) Averaged, aligned time series of reporter of extracellular GABA (Syn-GABASnFR) in organotypic SCN slices before and after treatment with 25 µM A37 (blue) or DMSO vehicle (black). Baseline and treatment: NDMSO = 4, NA37 = 6 SCN slices; washout: NDMSO = 2, NA37 = 6 SCN slices. (C) Amplitude of first circadian cycle (over 30 h) after treatment with A37 or DMSO relative to baseline, P = 0.0085. NDMSO = 4, NA37 = 6 SCN slices. (D) RAE before and after treatment, and after washout. Baseline and treatment: NDMSO = 4, NA37 = 6 SCN slices; washout: NDMSO = 2, NA37 = 6 SCN slices, P = 0.0092 for DMSO vs A37 after treatment. (E) τ values obtained from eJTK Cycle rhythmicity test on time series of Syn-GABASnFR before, after treatment and after washout of A37 or DMSO vehicle. Baseline and treatment: NDMSO = 4, NA37 = 6 SCN slices; washout: NDMSO = 2, NA37 = 6 SCN slices (F) Period of Syn-GABASnFR rhythms before and after treatment. Baseline and treatment: NDMSO = 4, NA37 = 6 SCN slices; washout: NDMSO = 2, NA37 = 6 SCN slices. (G) Averaged, aligned time series of co-detected neuronal calcium (Syn-jRCaMP1a) before and after treatment with A37 (red) or DMSO (black). NDMSO = 4, NA37 = 6 SCN slices. (H) Amplitude of first cycle of rhythms (over 30 h) after treatment with A37 or DMSO relative to baseline, NDMSO = 4, NA37 = 6 SCN slices, P = 0.424. (I) RAE of Syn-jRCaMP1a relative to baseline after treatment and washout of A37 or DMSO Baseline and treatment: NDMSO = 4, NA37 = 6 SCN slices; washout: NDMSO = 2, NA37 = 6 SCN slices. (J) Period of Syn-jRCaMP1a rhythms before and after treatment. P = 0.0364 for DMSO vs A37 after washout. Baseline and treatment: NDMSO = 4, NA37 = 6 SCN slices; washout: NDMSO = 2, NA37 = 6 SCN slices. (K) Averaged, aligned time series of co-detected PER2::LUC before and after treatment with A37 (purple) or DMSO (black). NDMSO = 4, NA37 = 6 SCN slices. (L) Amplitude of first cycle of rhythms (over 30 h) after treatment with A37 or DMSO relative to baseline, NDMSO = 4, NA37 = 6 SCN slices, P = 0.7328. (M) RAE of PER2::LUC relative to baseline after treatment and washout of A37 or DMSO. Baseline and treatment: NDMSO = 4, NA37 = 6 SCN slices; washout NDMSO = 2, NA37 = 6 SCN slices. (N) Period of PER2::LUC rhythms before and after treatment. Baseline and treatment: NDMSO = 4, NA37 = 6 SCN slices; washout: NDMSO = 2, NA37 = 6 SCN slices. All graphs, including time series, show mean ± SEM. Pairwise comparison in (C, H, L) show two-tailed unpaired t test. All other graphs show two-way mixed-effects analysis with matching, with post hoc Šidák’s test. ns = non-significant, *P < 0.05, **P < 0.01. A detailed statistical report for this figure is provided in Appendix Table S1. Source data are available online for this figure.
Figure 7
Figure 7. Inhibition of astrocytic GABA biosynthesis desynchronizes circadian oscillations of neuronal calcium and clock gene expression in the SCN.
(A) Representative normalized Syn-jRCaMP1a rhythms monitored in SCN slices before and after treatment with A37 (red traces) or vehicle (DMSO; black traces). (B) Slope of Syn-jRCaMP1a signal before and after treatment. Each dot represents one SCN slice. NDMSO = 4, NA37 = 6 SCN slices, P = 0.0085 for A37 BSL-Day 1–3. (C) Representative image of one SCN expressing Syn-jRCaMP1a and detected single cells to the right. Scale bar = 100 μm. (D) Fraction of rhythmic Syn-jRCaMP1a cells across SCN slices. NDMSO = 4, NA37 = 5 SCN slices. (E) Relative amplitude error (RAE) of individual cells across SCN slices treated with DMSO or A37 NDMSO = 4, NA37 = 5 SCN slices, (n = 200–400 cells/SCN slice), P = 0.0807. (F) Phase frequency distribution of phase distance from the mean SCN phase for Syn-jRCaMP1a cells. Distribution before and after treatment with DMSO (left), and before and after treatment with A37 (right). Difference in distribution is indicated by shading. NDMSO = 4, NA37 = 5 SCN slices, (n = 200–400 cells/SCN slice). (G) Phase frequency distribution after treatment with DMSO or A37. NDMSO = 4, NA37 = 5 SCN slices, (n = 200–400 cells/SCN slice). (H) Representative normalized PER2::LUC rhythms before and after treatment with A37 (purple traces) or vehicle (DMSO; black traces). (I) Slope of PER2::LUC rhythm before and after treatment. Each dot represents one SCN slice. NDMSO = 4, NA37 = 6 SCN slices. (J) Representative image of SCN expressing PER2::LUC with tissue outlined and detected single cells to the right. Scale bar = 100 μm. (K) Fraction of rhythmic PER2::LUC cells across SCN slices. NDMSO = 4, NA37 = 6 SCN slices, (n = 150–350 cells /SCN slices). (L) RAE of individual cells across SCN slices treated with A37 or DMSO, NDMSO = 4, NA37 = 6 SCN slices, (n = 150–350 cells/SCN slices), P = 0.550. (M) Phase frequency distribution of phase distance from the mean SCN phase for PER2::LUC cells. Distribution before and after treatment with DMSO (left), and before and after treatment with A37 (right). The difference in distribution is indicated by shading. NDMSO 4, NA37 = 6 SCN slices, (n = 150–350 cells/SCN slice). (N) Phase frequency distribution after treatment with DMSO or A37. NDMSO = 4, NA37 = 6 SCN slices, (n = 150–350 cells/SCN slice). All data shown mean ± SEM. For comparisons across SCN slices shown in (B, D, I, K), a two-way ANOVA with pairing and post hoc Šidák’s test is shown. For nested single-cell comparisons in (E, L), a nested two-tailed t test is shown. ns = non-significant, **P < 0.01, ****P < 0.0001. A detailed statistical report for this figure is provided in Appendix Table S1. Source data are available online for this figure.
Figure 8
Figure 8. Proposed model for the role of astrocytic and synaptic GABA in SCN function.
Top panel summarizes findings at the cellular level. In brief, in the presence of astrocytic GABA synthesis and GABA released by synapses, we observe extracellular GABA rhythms. If synaptic GABA transmission is blocked via genetic TeLC expression (left panel; see Fig. 3), extracellular GABA rhythms persist. If astrocytic GABA synthesis is inhibited (right panel; see Figs. 5 and 6), extracellular GABA rhythms are disrupted. Bottom panel summarizes findings at the SCN circuit level (see Fig. 7), showing astrocytic rhythms are synchronized to a uniform phase in every condition. Neuronal intracellular calcium rhythms and rhythms of clock gene expression are desynchronized across the network when synaptic GABA transmission is disrupted (left panel) and when astrocyte-derived extracellular GABA rhythm is disrupted (right panel), showing that both synaptic GABA transmission and astrocyte-derived extracellular GABA contribute to neuronal synchrony in the SCN.
Figure EV1
Figure EV1. Astrocytic calcium reporter is evenly expressed across the SCN, and spatiotemporal activity of astrocyte reporters is homogenous along the SCN anterior-posterior axis.
(A) Schematic showing spatial regions within a coronal SCN slice with dorsal, medial, lateral and ventral edges. (B) Representative confocal image of an SCN slice expressing neuronal (Syn-jRCaMP1a) and astrocytic (GfaABC1D-lck-GCaMP6f) calcium reporters, counterstained with NucBlue and GFAP antibody. Scale bar = 200 µm. (C) Quantification of mean fluorescence intensity of each reporter in the dorsal (D), ventral (V), medial (M) and lateral (L) SCN regions (see Methods), showing no detectable spatial differences in the expression of the neuronal or astrocytic calcium indicators, or GFAP staining intensity within the different SCN regions. N = 4 SCN slices, two-way ANOVA with matching and post hoc Šídák’s test. (D) Schematic showing the shape of SCN nuclei along the anterior-posterior axis, with images of one representative SCN expressing Syn-jRCaMP1a and PER2::LUC for each region. Scale bar = 200 μm. (E) Top panel shows circular variance of phases across clusters in SCN slices expressing Syn-jRCaMP1a and GfaABC1D-lck-GCaMP6f divided by region across A-P axis as shown in (D). N = 2–6 SCN slices per region. Bottom panel shows Rayleigh plot of circadian phases of GfaABC1D-lck-GCaMP6f relative to co-detected Syn-jRCaMP1a (peaking at CT6) within each region across the A-P axis. Each dot represents one SCN slice, vector direction indicates mean phase, and vector length inversely indicates circular dispersion. (F) Top panel shows circular variance of cluster phases of Syn-jRCaMP1a and GfaABC1D-iGluSnFR by region. N = 4 SCN slices per region. Bottom panel shows Rayleigh plot of circadian phases of GfaABC1D-iGluSnFR relative to co-detected Syn-jRCaMP1a by region. (G) Top panel shows circular variance of cluster phases of Syn-jRCaMP1a and Syn-GABASnFR by region. N = 4–10 SCN slices per region. Bottom panel shows Rayleigh plot of circadian phases of Syn-GABASnFR relative to co-detected Syn-jRCaMP1a by region. All linear graphs show mean ± SEM, graphs in top panel of (EG) show two-way mixed-effects analysis with matching and post hoc Šídák’s test. Circular Rayleigh plots in bottom panel of (EG) show Watson-Williams test of homogeneity of means. ns = non-significant. A detailed statistical report for this figure is provided in Appendix Table S1. Source data are available online for this figure.
Figure EV2
Figure EV2. Characterization of phase relationship between Syn-jRCaMP1a and Syn-GABASnFR and their synchronization across the SCN network and single cells.
(A) Rayleigh plot showing circadian phase of Syn-GABASnFR (blue) and PER2::LUC (black) relative to co-detected Syn-jRCaMP1a. (B) Representative circadian phase cluster map of Syn-jRCaMP1a, showing same SCN as co-detected PER2::LUC and Syn-GABASnFR phase map in Fig. 2C. One SCN nucleus is shown (dorsal (D) and medial (M) area indicated). Color bars indicate cluster phases, NR = non-rhythmic. White arrow indicates the direction of the phase progression. (C) Representative standard deviation of cluster time series of co-detected Syn-jRCaMP1a and Syn-GABASnFR. (D) Inter-cluster phase dispersal (measured by circular variance) of co-detected Syn-jRCaMP1a and Syn-GABASnFR (N = 19 SCN slices). Paired two-tailed t test, P = 0.0013. (E) PDF of cluster phase variance for each co-detected reporter, with Kolmogorov–Smirnov test, P = 0.00397. (F) Representative images of averaged Syn-jRCaMP1a (left) and Syn-GABASnFR (right) signal in an SCN slice with detected single cells indicated in white to the right. Scale bar = 100 μm. (G) Circular variance of circadian phases of Syn-jRCaMP1a or Syn-GABASnFR across individual cells across the SCN, each data point represents 1 SCN slice, with 200–300 cells measured per slice. Two-tailed paired t test, P = 0.0076. All graphs are mean ± SEM, **P < 0.01. A detailed statistical report for this figure is provided in Appendix Table S1. Source data are available online for this figure.
Figure EV3
Figure EV3. MAO-B and ALDH1A1 protein expression in SCN astrocytes and characterization of GABAergic astrocytes.
(A) Representative confocal image of an SCN slice expressing Gfap-mCherry::Cre counterstained with NucBlue, ALDH1A1 and GFAP antibodies. Inset with higher magnification shown below. Scale bar = 100 µm (top row), 30 µm (bottom row). (B) Fraction of Gfap-mCherry::Cre+ astrocytes co-expressing GFAP or ALDH1A1. N = 6 SCN slices. (C) Fraction of relative signal overlap, as determined by Mander’s coefficient of GFAP and ALDH1A1. N = 6 SCN slices. (D) Representative confocal image of an SCN slice expressing Gfap-mCherry::Cre counterstained with NucBlue, MAO-B and GFAP antibodies. Inset with higher magnification shown below. Scale bar = 100 µm (top row), 30 µm (bottom row). (E) Fraction of Gfap-mCherry::Cre+ astrocytes co-expressing GFAP or MAO-B. N = 4 SCN slices. (F) Fraction of relative signal overlap, as determined by Mander’s coefficient of GFAP and MAO-B. N = 4 SCN slices. (G) Characterization of potential GABA- and/or glutamate-producing hypothalamic astrocytes based on scRNA-Seq data from the Yao et al (2023) dataset. Graph shows percentage of astrocytes expressing one or more genes involved in GABA production (GABAergic), glutamate production (Glutamatergic) or both (Mixed). N = 20,549 hypothalamic astrocytes. (H) Top panel shows percentage of SCN neurons and hypothalamic astrocytes expressing GABA transporters Slc6a11, Slc6a1 or Best1 in the Yao et al, scRNA-Seq (2023) dataset. Bottom panel shows normalized gene expression levels of each GABA transporter gene. N = 1836 SCN neurons and N = 20,549 hypothalamic astrocytes. (I) Normalized gene expression levels of GABA transporters in SCN neurons and SCN astrocytes from the Wen et al, (2020) scRNA-Seq dataset. N = 12,018 SCN neurons and N = 8,429 SCN astrocytes. ****P < 0.0001, **P = 0.0038. (J) Time series of normalized gene expression levels of Slc6a11, encoding GAT3, in SCN astrocytes and neurons. N = 12,018 SCN neurons and N = 8,429 SCN astrocytes, with 238–2410 cells/timepoint. eJTK Cycle rhythmicity test with Benjamini–Hochberg correction, P = 0.004 with circadian peak at CT6 in astrocytes (indicated as ϕ on the plot), not significantly rhythmic in neurons as indicated. All graphs show mean ± SEM, and panels (H, I) show two-way ANOVA with post hoc Šidák’s test. A detailed statistical report for this figure is provided in Appendix Table S1. Source data are available online for this figure.
Figure EV4
Figure EV4. Selegiline treatment decreases GABA concentration in SCN slices without significantly affecting GFAP immunoreactivity or circadian rhythms of extracellular glutamate.
(A) Representative confocal images of fixed SCN slices expressing Gfap-mCherry::Cre, and stained with antibodies against GFAP and GABA, 4 days after treatment with Selegiline or DMSO. Scale bar = 200 µm. (B) Quantification of mean fluorescence intensity of GFAP antibody, Gfap-mCherry::Cre and GABA antibody in SCN slices treated with Selegiline or DMSO. NDMSO  = 3, NSelegiline = 3 SCN slices. Two-way ANOVA with matching and post hoc Šídák’s test, P = 0.0053 for GABA DMSO vs Selegiline. (C) Number of Gfap-mCherry::Cre-expressing cells per 1000 µm2 tissue in slices treated with DMSO or Selegiline. NDMSO = 3, NSelegiline = 3 SCN slices. Two-tailed unpaired t test. (D) Averaged, aligned time series of extracellular glutamate reporter (GfaABC1D-iGluSnFR) before and after treatment with 200 µM Selegiline (teal) or DMSO (black). NDMSO = 5, NSelegiline = 4 SCN slices. (E) Left panel shows τ values obtained from eJTK Cycle rhythmicity test on time series of GfaABC1D-iGluSnFR before and within 1–3 days after treatment with Selegiline or DMSO. Right panel shows the P value obtained from eJTK Cycle rhythmicity test empirically calculated against random noise data. NDMSO = 5, NSelegiline = 4 SCN slices. (F) GfaABC1D-iGluSnFR amplitude of first cycle of rhythms (over 30 h) after treatment with Selegiline or DMSO relative to baseline. NDMSO = 5, NSelegiline= 4 SCN slices. Two-tailed unpaired t test. (G) RAE of GfaABC1D-iGluSnFR rhythms before and after Selegiline treatment. (H) Period of GfaABC1D-iGluSnFR rhythms before and after Selegiline treatment. NDMSO = 5, NSelegiline= 4 SCN slices. Graphs (E, G, H) show two-way mixed-effects analysis with matching, with post hoc Šidák’s test. All graphs, including time series, show mean ± SEM, except right panel in (E) which shows median ± interquartile range due to logarithmic scale, ns = non-significant, **P < 0.01. A detailed statistical report for this figure is provided in Appendix Table S1. Source data are available online for this figure.
Figure EV5
Figure EV5. A37-mediated ALDH1A1 inhibition suppresses extracellular rhythms of GABA in a dose-dependent manner.
(A) Representative time series of SCN slices expressing Syn-GABASnFR before and after treatment with increasing concentrations of A37 from left to right: DMSO (0 µM A37), 10 µM, 25 µM and 50 µM A37. (B) Amplitude of the first cycle (30 h) of Syn-GABASnFR rhythms after treatment with increasing concentrations of A37 relative to baseline. One-way ANOVA, with post hoc Tukey’s t test shown, P = 0.0161 for DMSO-25µM, and P = 0.0233 for DMSO-50µM. NDMSO = 4, N10 = 3, N25 = 6; N50 = 3. (C) RAE of Syn-GABASnFR rhythms with A37 treatment and after washout of increasing concentrations of A37 relative to baseline. Treatment: NDMSO = 4, N10 = 3, N25 = 6; N50 = 3, washout: NDMSO = 2, N10 = 3, N25 = 6; N50 = 3. Mixed-effects analysis with matching, timepoint effect P < 0.01, A37 dose effect P < 0.01, with post hoc Sidak’s test, treatment: DMSO-25 µM, P = 0.0206, DMSO-50 µM, P = 0.0052; washout: 10 µM–50 µM, P = 0.004, 25 µM–50 µM, P = 0.0477; comparisons across timepoints are shown in the corresponding color. (D) Representative time series of PER2::LUC and Syn-GABASnFR before and after treatment with 100 µM A37, showing immediate tissue death. All graphs are mean ± SEM. *P < 0.05, **P < 0.01. A detailed statistical report for this figure is provided in Appendix Table S1. Source data are available online for this figure.

References

    1. Aguilar-Roblero R, Verduzco-Carbajal L, Rodríguez C, Mendez-Franco J, Morán J, de la Mora MP (1993) Circadian rhythmicity in the GABAergic system in the suprachiasmatic nuclei of the rat. Neurosci Lett 157:199–202 - PubMed
    1. Allen NJ, Rossi DJ, Attwell D (2004) Sequential release of GABA by exocytosis and reversed uptake leads to neuronal swelling in simulated ischemia of hippocampal slices. J Neurosci 24:3837–3849 - PMC - PubMed
    1. Aton SJ, Huettner JE, Straume M, Herzog ED (2006) GABA and Gi/o differentially control circadian rhythms and synchrony in clock neurons. Proc Natl Acad Sci USA 103:19188–19193 - PMC - PubMed
    1. Barakat L, Bordey A (2002) GAT-1 and reversible GABA transport in Bergmann glia in slices. J Neurophysiol 88:1407–1419 - PubMed
    1. Barca-Mayo O, Pons-Espinal M, Follert P, Armirotti A, Berdondini L, De Pietri Tonelli D (2017) Astrocyte deletion of Bmal1 alters daily locomotor activity and cognitive functions via GABA signalling. Nat Commun 8:14336 - PMC - PubMed

Substances

LinkOut - more resources