

Sex differences in the association between sarcopenia index and sarcopenia: a cross-sectional study from a Chinese community-based population
- PMID: 39623162
- PMCID: PMC11850426
- DOI: 10.1007/s41999-024-01111-w
Sex differences in the association between sarcopenia index and sarcopenia: a cross-sectional study from a Chinese community-based population
Abstract
Purpose: The sarcopenia index (SI) is a convenient method to screen for sarcopenia, but few studies have analysed whether there are sex differences. The aim of this study was to analyse sex differences in the relationship between SI and sarcopenia in a Chinese community-based population.
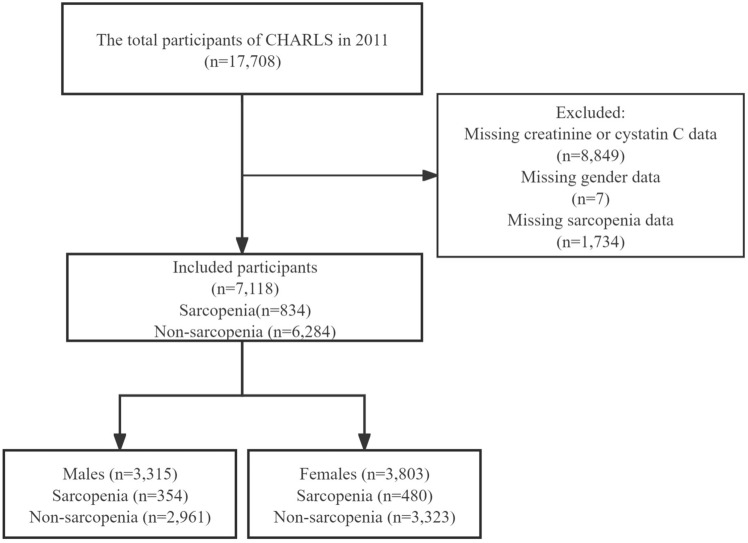
Methods: This cross-sectional study included participants from 2011 China Health and Retirement Longitudinal Study. The SI was defined as 100 × creatinine / cystatin C. Diagnosis of sarcopenia based on the Asian Working Group for Sarcopenia 2019 consensus. Logistic regression model, linear regression model, and natural spline model were used to analyze the association between SI and sarcopenia.
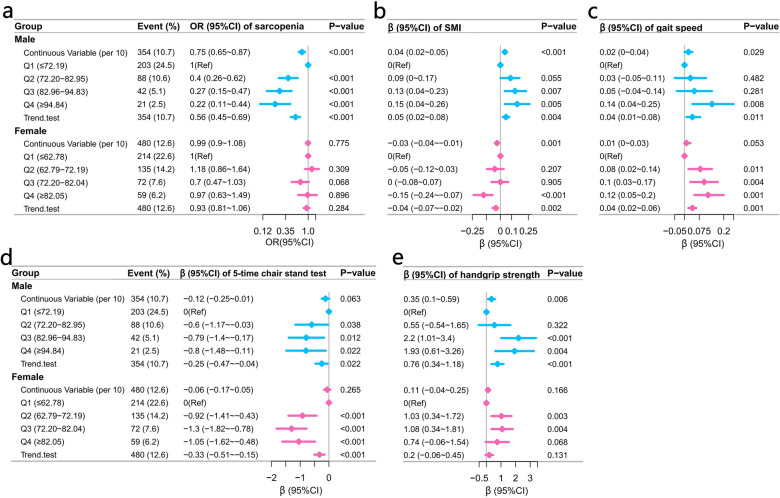
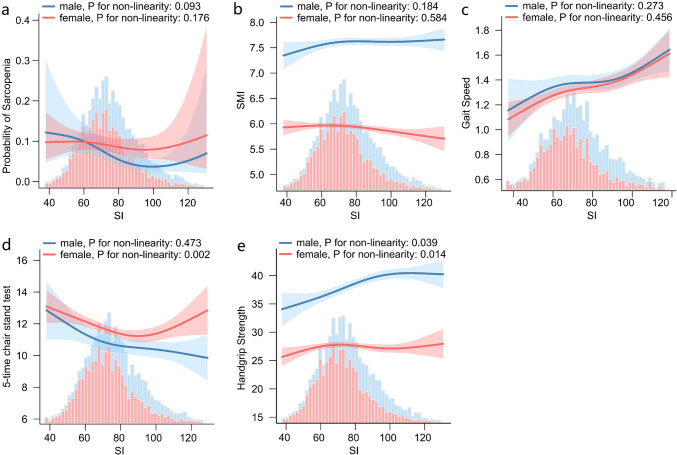
Results: A total of 7,118 participants with a mean age of 60.6 ± 10.1 were included, 53.4% females. In males, the prevalence of sarcopenia decreased by 25% for every 10 increase in SI, and skeletal muscle mass index (SMI) increased by 0.04, odds ratio (OR), β, and 95% confidence interval (CI) were 0.75 (0.65-0.87), 0.04 (0.02-0.05), both P < 0.001. In females, the SI was not significantly associated with sarcopenia, OR and 95% CI were 0.99 (0.9 ~ 1.08), P = 0.775; for every 10 increase in SI, the SMI in females decreased by 0.03, β and 95% CI were -0.03 (-0.04 ~ -0.01), P = 0.001.
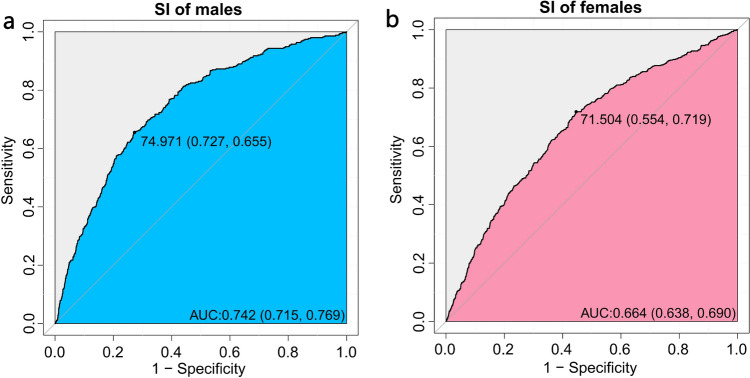
Conclusion: In the Chinese community, the SI is negatively associated with sarcopenia in males and has moderate diagnostic test performance. It was not associated with sarcopenia in females, and using the SI to screen for sarcopenia in females may not be a reliable method.
Keywords: CHARLS; Creatinine; Cystatin C; Sarcopenia; Sarcopenia index.
© 2024. The Author(s).
Conflict of interest statement
Declarations. Conflict of interest: The authors declare that they have no conflict of interest. Ethical approval: The CHARLS study was approved by the Ethical Review Committee of Peking University (IRB00001052-11015). All methods were carried out in accordance with relevant guidelines and regulations. Informed consent: Informed consent was obtained from all subjects.
Figures
Similar articles
-
Sarcopenia index based on serum creatinine and cystatin C is associated with mortality in middle-aged and older adults in Chinese: A retrospective cohort study from the China Health and Retirement Longitudinal Study.Front Public Health. 2023 Mar 21;11:1122922. doi: 10.3389/fpubh.2023.1122922. eCollection 2023. Front Public Health. 2023. PMID: 37026117 Free PMC article.
-
A new index based on serum creatinine and cystatin C is useful for assessing sarcopenia in patients with advanced cancer.Nutrition. 2021 Feb;82:111032. doi: 10.1016/j.nut.2020.111032. Epub 2020 Oct 12. Nutrition. 2021. PMID: 33172686
-
Diagnostic accuracy of a 'sarcopenia index' based on serum biomarkers creatinine and cystatin C in 458,702 UK Biobank participants.Clin Nutr ESPEN. 2024 Oct;63:207-213. doi: 10.1016/j.clnesp.2024.06.041. Epub 2024 Jun 28. Clin Nutr ESPEN. 2024. PMID: 38968079
-
Sarcopenia index as a predictor of clinical outcomes among older adult patients with acute exacerbation of chronic obstructive pulmonary disease: a cross-sectional study.BMC Geriatr. 2023 Feb 11;23(1):89. doi: 10.1186/s12877-023-03784-7. BMC Geriatr. 2023. PMID: 36774462 Free PMC article.
-
Lower serum creatinine to cystatin C ratio associated with increased incidence of frailty in community-dwelling elderly men but not in elderly women.Aging Clin Exp Res. 2024 Jul 4;36(1):140. doi: 10.1007/s40520-024-02787-7. Aging Clin Exp Res. 2024. PMID: 38965150 Free PMC article.
References
-
- Chen L-K, Woo J, Assantachai P, Auyeung T-W, Chou M-Y, Iijima K et al (2020) Asian working group for sarcopenia: 2019 consensus update on sarcopenia diagnosis and treatment. J Am Med Dir Assoc 21:300-307.e2. 10.1016/j.jamda.2019.12.012 - PubMed
-
- Lin T, Jiang T, Huang X, Xu P, Liang R, Song Q et al (2024) Diagnostic test accuracy of serum creatinine and cystatin C-based index for sarcopenia: a systematic review and meta-analysis. Age Ageing 53(1):afad252 - PubMed
-
- Xu J, Wan CS, Ktoris K, Reijnierse EM, Maier AB (2022) Sarcopenia is associated with mortality in adults: a systematic review and meta-analysis. Gerontology 68:361–376. 10.1159/000517099 - PubMed
MeSH terms
Substances
Supplementary concepts
Grants and funding
LinkOut - more resources
Full Text Sources