. 2025 Jan;26(2):407-442.
doi: 10.1038/s44319-024-00313-4. Epub 2024 Dec 2.

Mitochondrial calcium uniporter complex controls T-cell-mediated immune responses

Affiliations

Mitochondrial calcium uniporter complex controls T-cell-mediated immune responses

Magdalena Shumanska et al. EMBO Rep. 2025 Jan.

Abstract

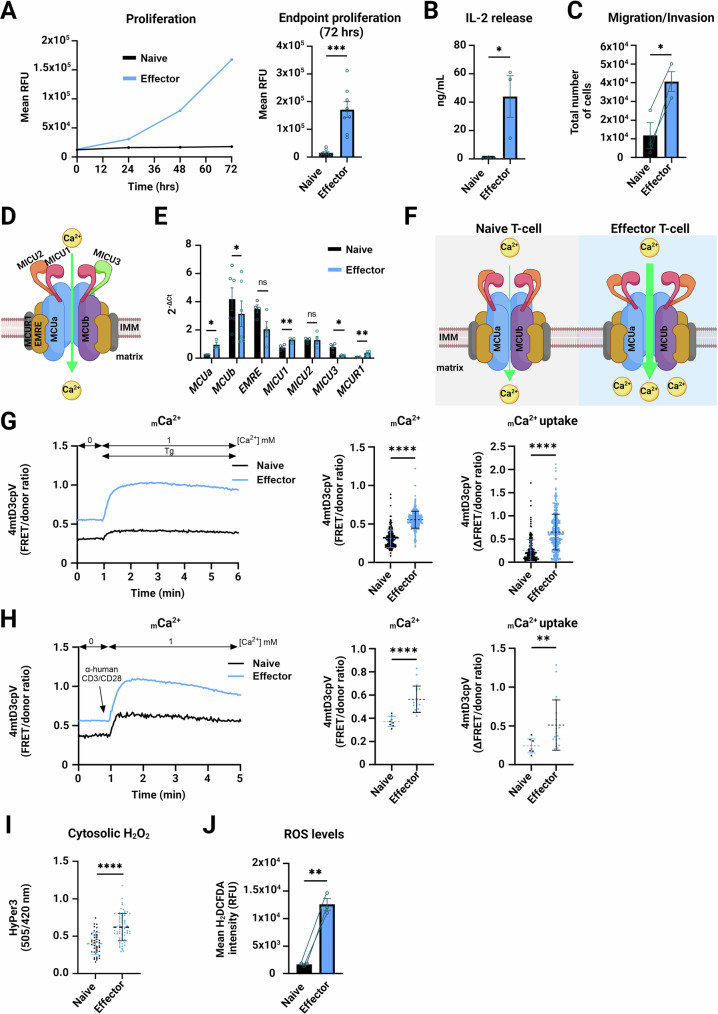
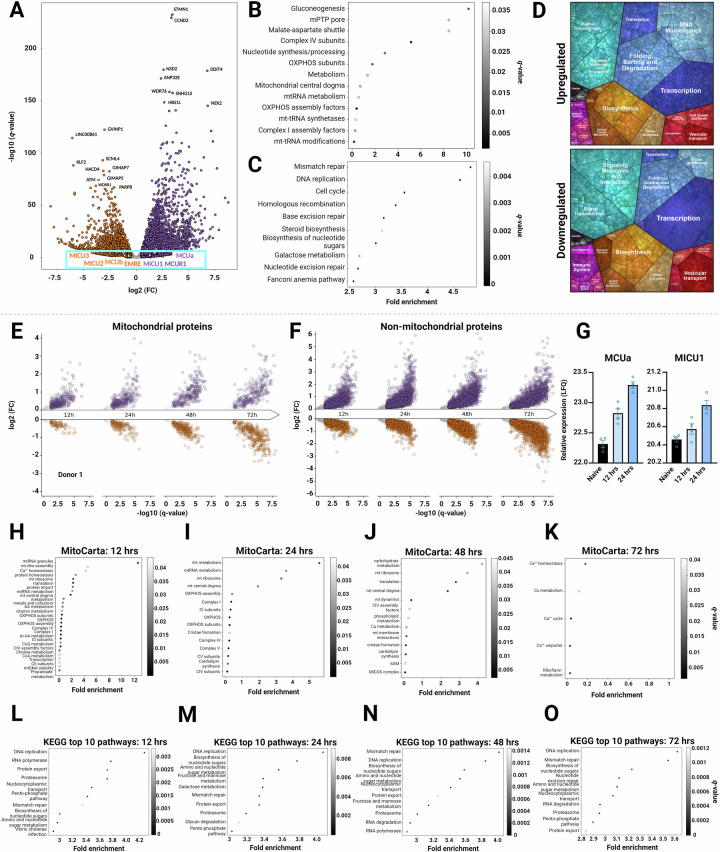
T-cell receptor (TCR)-induced Ca2+ signals are essential for T-cell activation and function. In this context, mitochondria play an important role and take up Ca2+ to support elevated bioenergetic demands. However, the functional relevance of the mitochondrial-Ca2+-uniporter (MCU) complex in T-cells was not fully understood. Here, we demonstrate that TCR activation causes rapid mitochondrial Ca2+ (mCa2+) uptake in primary naive and effector human CD4+ T-cells. Compared to naive T-cells, effector T-cells display elevated mCa2+ and increased bioenergetic and metabolic output. Transcriptome and proteome analyses reveal molecular determinants involved in the TCR-induced functional reprogramming and identify signalling pathways and cellular functions regulated by MCU. Knockdown of MCUa (MCUaKD), diminishes mCa2+ uptake, mitochondrial respiration and ATP production, as well as T-cell migration and cytokine secretion. Moreover, MCUaKD in rat CD4+ T-cells suppresses autoimmune responses in an experimental autoimmune encephalomyelitis (EAE) multiple sclerosis model. In summary, we demonstrate that mCa2+ uptake through MCU is essential for proper T-cell function and has a crucial role in autoimmunity. T-cell specific MCU inhibition is thus a potential tool for targeting autoimmune disorders.

Keywords: Autoimmunity; Calcium; MCU; Mitochondria; T-cell.


Conflict of interest statement

Disclosure and competing interests statement. The authors declare no competing interests.

Figures

Figure 1
Figure 1. T-cell activation causes elevated mCa2+ uptake.
(A) CD4+ T-cell proliferation measured in naive and effector cells. The traces and quantification at 72 hrs represent a mean ± SEM of 8 different donors/biological replicates. ***p < 0.001 (p = 0.0006), assessed by two-tailed paired Student’s t-test. RFU = relative fluorescence units. (B) IL-2 secretion upon T-cell activation (mean ± SEM of 3 donors/biological replicates shown as single points). *p ≤ 0.05 (p = 0.0422), assessed by two-tailed paired Student’s t-test. (C) Naive and effector CD4+ T-cell trans-well migration/invasion. The quantification shows a mean ± SEM of 3 donors/biological replicates. *p ≤ 0.05 (p = 0.0209), assessed by two-tailed paired Student’s t-test. (D) Structure of the MCU complex (Image created with BioRender). (E) Gene expression analyses of MCU complex components in naive (black bars) and effector CD4+ T-cells (blue bars). Data present mean ± SEM of 4–7 donors/biological replicates normalised to TATA-binding protein (TBP). **p < 0.01, *p ≤ 0.05, ns - not significant (MCUa p = 0.0200; MCUb p = 0.0494; MICU1 p = 0.0052; MICU3 p = 0.0177; MCUR1 p = 0.0074); assessed by two-tailed paired Student’s t-test. (F) TCR activation leads to higher mCa2+ uptake (Image created with BioRender). (G) Quantification of mCa2+ levels in human naive and effector T-cells by the 4mtD3cpV biosensor. Traces and quantification plots show an average of 224 naive and 371 effector cells/biological replicates from 2 healthy donors. Cells were stimulated by addition of 1 µM thapsigargin at the indicated time point. The quantification/violin plots show mean ± SD basal mCa2+ levels and mitochondrial Ca2+ uptake. Single cells are given as single points. ****p < 0.0001, assessed by two-tailed unpaired Student’s t-test (Basal p = 1.5409E−100; Uptake p = 7.67291E−39). (H) Quantification of mCa2+ levels in human naive and effector T-cells by 4mtD3cpV. Traces and quantification plots show an average of 8 naive and 19 effector cells/biological replicates from 1 donor. Cells were stimulated by addition of anti-human CD3/CD28-coated beads at the indicated time point. The quantification/violin plots show the mean ± SD basal mCa2+ levels and mitochondrial Ca2+ uptake. ****p < 0.0001 (p = 0.000205), **p < 0.01 (p = 0.0054), assessed by Mann–Whitney U test. (I) Cytosolic H2O2 levels measured with the HyPer-3 biosensor in naive and effector CD4+ T-cells. Quantifications show mean ± SD of 32 naive and 164 effector T-cells/biological replicates from 3 healthy donors. ****p < 0.0001 (p = 6.2986E−10), assessed by two-tailed unpaired Student’s t-test. (J) ROS levels in effector T-cells determined by H2DCFDA. Quantification shows mean ± SEM of 3 different donors/biological replicates. **p < 0.01 (p = 0.0092), assessed by two-tailed paired Student’s t-test. RFU = relative fluorescence units. Source data are available online for this figure.
Figure 2
Figure 2. TCR stimulation induces a robust functional reprogramming of T-cell mitochondria.
(A, B) Resting and maximal mitochondrial oxygen consumption rates (OCR), and extracellular acidification rates (ECAR) in effector CD4+ T-cells from 3 donors measured using the Seahorse assay. (B) Quantified mean ± SEM of 3 healthy donors/biological replicates. *p ≤ 0.05 (Basal p = 0.0471; Maximal p = 0.0275; ECAR p = 0.0274), assessed by two-tailed paired Student’s t-test. (C) ATP levels (assessed by the Cell Titer Glo® Luminescence Assay) upon CD4+ T-cell activation. Quantification shows mean ± SEM of 6 healthy donors/biological replicates. **p < 0.01 (p = 0.0083), assessed by two-tailed paired Student’s t-test. (D) Mitochondrial H2O2 levels in naive and effector CD4+ T-cells. Quantifications show a mean ± SD of 43 naive and 71 effector T-cells/biological replicates from 3 healthy donors. ****p < 0.0001 (p = 8.9134E−07), assessed by two-tailed unpaired Student’s t-test. (E) Single cell measurements of ∆Ψm using TMRE in naive and effector T-cells. Traces show mean RFU of 782 naive and 678 effector T-cells/biological replicates from 4 healthy donors. The quantification on the right shows mean ± SD of the resting ∆Ψm. CCCP: 2 μM. ****p < 0.0001 (p = 0), assessed by two-tailed unpaired Student’s t-test. RFU = relative fluorescence units. (F) Single cell measurements of ∆Ψm using JC-1 staining. Traces and quantification show mean ± SD of 121 naive and 164 effector T-cells/biological replicates from 2 healthy donors. CCCP: 2 μM. ****p < 0.0001 (p = 1.41716E−40), assessed by two-tailed unpaired Student’s t-test. (G) Mitochondrial protein translation measured at 0, 24, 48, and 72 hrs after TCR activation, using metabolic 35S labelling. The blot is representative of one donor and the quantification is a mean ± SEM of 3 different donors/biological replicates (single points), as percentage of ‘Naive control’. ***p < 0.001; *p ≤ 0.05 (COX1 p = 0.0278; CYTB p = 0.0138; ND2 p = 0.0484; ND1 p = 0.0384; COX2/COX3 p = 0.0004; ATP6 p = 0.0065; ATP8 p = 0.0428), assessed by two-tailed paired Student’s t-test. E = Effector. Source data are available online for this figure.
Figure 3
Figure 3. T-cell activation causes time-dependent transcriptome and proteome rewiring.
(AD) RNA sequencing of naive and effector CD4+ T-cells. (A) Volcano plot displays DEGs between naive and effector T-cells. DEGs have been selected and sorted as up- or down-regulated depending on the fold change (up—FC > 0 (purple); down—FC < 0 (orange)) using a q-value cut-off of 0.05 (DEseq2, FDR-correction). MCU complex components are marked with a blue frame. (B) MitoCarta 3.0-based sub-mitochondrial compartment and pathway annotation. q-values were calculated using Fisher’s exact test. (C) Top 10 pathways (according to KEGG) ranked by fold enrichment, involved in T-cell activation after 72 hrs of stimulation, excluding mitochondria-related genes. (D) Proteomap analyses based on data shown in (A), excluding mitochondria-related genes. (EO) Proteomics and bioinformatic analyses of bead-activated T-cells for 12, 24, 48, and 72 h. The volcano plots (E, F) show significantly up- (purple) and downregulated (orange) proteins (DEPs) as compared to naive T-cells. (E) Mitochondria-related DEPs in effector T-cells as compared to naive T-cells. (F) Non-mitochondria-related DEPs in activated T-cells compared to naive T-cells. (G) Relative protein abundance of MCUa and MICU1 extracted from the proteomics dataset. Data is shown as mean ± SEM from 4 technical replicates. LFQ = label-free quantitation. (HK) MitoCarta 3.0-based sub-mitochondrial compartment and pathway annotation. q-values were calculated using Fisher’s exact test. (LO) Top 10 pathways (according to KEGG) ranked by fold enrichment, involved in T-cell activation after 12, 24, 48, and 72 hrs of stimulation, excluding mitochondria-related proteins. Source data are available online for this figure.
Figure 4
Figure 4. MCUaKD inhibits mCa2+ uptake and affects crucial T-cell functional parameters.
(A) MT3.1 Pericam-based quantification of resting mCa2+ and mCa2+ uptake upon ionomycin stimulation (4 µM). The traces and violin plots (mean ± SD) show the average of 38 control effector T-cells and 48 siMCUaKD effector T-cells/biological replicates from 4 donors. ***p < 0.001; **p ≤ 0.01 (Basal p = 0.0002; Uptake p = 0.0011), assessed by two-tailed unpaired Student’s t-test. (B) Viability of siMCUaKD T-cells and controls determined by CellTiter-Blue® assay. Traces and graph (72 h) show mean ± SEM of 4 healthy donors/biological replicates. ns - not significant, assessed by two-tailed paired Student’s t-test. RFU = relative fluorescence units. (C) Migration/invasion of siMCUaKD cells and controls determined by trans-well assay. Quantification shows mean ± SEM of 6 different donors/biological replicates. **p ≤ 0.01 (p = 0.0084), assessed by two-tailed paired Student’s t-test. (D) mRNA expression of IL-2 in siMCUaKD cells and controls determined by RT-qPCR. Quantification shows mean ± SEM of 3 different donors/biological replicates. *p ≤ 0.05 (p = 0.0455), assessed by two-tailed paired Student’s t-test. (E) mRNA expression of IFNγ in siMCUaKD cells and controls determined by RT-qPCR. Quantification shows mean ± SEM of 5 healthy donors/biological replicates. *p ≤ 0.05 (p = 0.0352), assessed by two-tailed paired Student’s t-test. (F) mRNA expression of Treg transcription factor FoxP3 in siMCUaKD cells and controls determined by RT-qPCR. Quantification shows mean ± SEM of 6 heathy donors/biological replicates. *p ≤ 0.05 (p = 0.0312), assessed by two-tailed paired Student’s t-test. (G, H) ELISA-based measurements of IFNγ secretion in Ab-stimulated siMCUaKD effector T-cells. Quantification (at 25 µL/mL Ab solution) shows mean ± SEM of 7 healthy donors/biological replicates. *p ≤ 0.05 (p = 0.0156), assessed by Wilcoxon’s signed-rank test. (I, J) Evaluation of endogenous NFAT1 upon T-cell activation with 1 µM Tg in siMCUaKD effector T-cells and control cells. (I) Representative confocal images of control-transfected and siMCUaKD cells, with or without Tg stimulation. Left to right: DAPI, NFAT1, merged channels; magnification: 40× (N. A 1.3) oil; scale bar: 10 μm. (J) Quantification (upper panel) shows NFAT1 mean ± SD intensity difference between the total cell area and the nuclear area. Quantification (lower panel) shows NFAT1 mean ± SD intensity ratio of the nuclear area of the cell to the total cell area. Both graphs represent a total of 59 control cells+DMSO, 61 control cells+Tg, 65 siMCUaKD cells+DMSO, and 65 siMCUaKD cells+Tg cells/biological replicates from 3 healthy donors. ****p ≤ 0.0001 (Cytosolic p = 8.38774E−06; Nuclear p = 2.12737E−07), assessed by Welch’s t-test. (K) Quantification of % of Tg-induced NFAT1 translocation based on data in (J). Both graphs show mean ± SEM of 61 control and 65 siMCUaKD cells. ****p ≤ 0.0001 (p = 0.00001), assessed by two-tailed unpaired Student’s t-test. Source data are available online for this figure.
Figure 5
Figure 5. MCUaKD affects vital mitochondrial parameters.
(A) Oxygen consumption rate measurements (OCR) in control and siMCUaKD effector CD4+ T-cells from 3 healthy donors/biological replicates given as mean ± SEM. (B) Quantification from the 3 healthy donors/biological replicates in (A) as mean ± SEM. ****p < 0.0001; **p < 0.01 (Basal p = 3.8776E−07; Maximal p = 0.0038), assessed by two-tailed unpaired Student’s t-test. (C) Mitochondrial ATP levels, measured using BioTracker ATP-Red dye in control and siMCUaKD T-cells. Violin plots display mean ± SD of 155 control and 130 siMCUaKD T-cells/biological replicates from 2 healthy donors. ****p < 0.0001 (p = 1.8025E−13), assessed by two-tailed unpaired Student’s t-test. RFU = relative fluorescence units. (D) Mitochondrial protein abundance in control and siMCUaKD cells from 3 healthy donors/biological replicates (E) Quantification of abundance shown in (D) normalised to Histone H3. Data are shown as mean ± SEM. *p ≤ 0.05 (p = 0.0403), assessed by two-tailed paired Student’s t-test. (FH) RNA sequencing of control and siMCUaKD cells. (F) Volcano plot. DEGs were selected and sorted as up- or down-regulated depending on the fold change (up—FC > 0 (purple); down—FC < 0 (orange)) using a p-value cut-off of 0.05 (DEseq2, FDR-correction). (G) KEGG pathway analysis of significantly affected cellular pathways. (H) Proteomap-based analysis of data shown in (F). Source data are available online for this figure.
Figure 6
Figure 6. Knockdown of MCUa in rat CD4+ effector T-cells affects their function in vitro.
(A) Generation of stable rat CD4+ effector T-cell lines by CRISPR Cas9 and retroviral transduction to target MCUa expression (Image created with BioRender). (B) Measurements of mCa2+ using 2mtScarlet-GCaMP6s in sgRosa26 control and three sgMCUaKD rat CD4+ T-cell clones. TCR stimulation was achieved by addition of anti-rat CD3/CD28 monoclonal antibodies (1 µg/mL). (C) Quantification of data presented in (B). Violin plots represent mean ± SD of 72 sgRosa26 control, 82 sgMCUaKD 1, 51 sgMCUaKD 2, and 32 sgMCUaKD 3 cells/biological replicates. ****p < 0.0001; ***p < 0.001; **p < 0.01; *p ≤ 0.05; ns - not significant, assessed by ordinary one-way ANOVA (ANOVA summary: Basal p = 0.0006; Uptake p = 5.55055E−06). (D) Seahorse-based measurements of OCR in sgRosa26 control and sgMCUaKD 1 rat CD4+ T-cells given as mean ± SD of 3 biological replicates. (E) Quantification of data given in (D). Basal and maximal OCR given as mean ± SD of 3 biological replicates. *p ≤ 0.05 (p = 0.0484); ns - not significant, assessed by Mann–Whitney U test. (F) ATP measurements in sgRosa26 control and sgMCUaKD 1 rat CD4+ T-cells. Quantification as mean ± SEM of 4 biological replicates. *p ≤ 0.05 (p = 0.0307), assessed by two-tailed unpaired Student’s t-test. (G) Measurements of in vitro T-cell migration/invasion in sgRosa26 control and sgMCUaKD 1 rat CD4+ T-cells. Quantification as mean ± SEM of 3 biological replicates. *p ≤ 0.05 (p = 0.0166), assessed by two-tailed unpaired Student’s test. Source data are available online for this figure.
Figure 7
Figure 7. Effector T-cells lacking MCUa have a decreased autoimmune potential in vivo.
(A) Clinical course of EAE induced by transfer of β-synuclein-specific sgRosa26 control and sgMCUaKD 1 and 2 rat effector CD4+ T-cells. Data are shown as mean ± SEM disease scores (n = 4 animals for the control group and n = 3 animals for the sgMCUaKD 1 and 2 groups). (B) Quantification of data shown in (A) (n = 4 animals for the control group and n = 3 animals for the sgMCUaKD 1 and 2 groups). Maximal EAE score and disease severity (presented as area under the curve; AUC). Data are represented as mean ± SEM. **p < 0.01; *p ≤ 0.05, assessed by ordinary one-way ANOVA test (ANOVA summary: Maximal EAE score p = 0.0053; AUC p = 0.0058). (C) T-cell migration pattern after adoptive transfer, prior to induction of clinical EAE. (DG) T-cell numbers quantified ex vivo after adoptive T-cell co-transfer in different compartments: (D) lungs, (E) mediastinal lymph nodes, (F) blood, and (G) brain cortex. T-cell counts were analysed on a CytoFLEX flow cytometer after staining with anti-CD134 (OX-40)-AF647 and anti-CD25-BV750. Graphs show mean ± SEM (n = 3 animals presented as single points) of cell numbers at a given day after transfer. *p ≤ 0.05 (p = 0.0351 for E, p = 0.0500 for F, p = p = 0.0233 for G), assessed by two-tailed paired Student’s test. (HK) Log2 Ratio of control and sgMCUaKD T-cells migrating in the different compartments, given as mean ± SEM (n = 3 animals presented as single points; based on data in DG) at a certain day after co-transfer. Source data are available online for this figure.
Figure EV1
Figure EV1. Cytosolic and mitochondrial Ca2+ levels are increased upon T-cell activation.
(A) Pure CD4+ naive T-cell population isolated from blood of healthy human donors. Naive T-cells mainly exhibited positive CD4 (PE-A) staining, and not CD8. 99% and 96.9% of cells of from donor 1 (left) and donor 2 (right) were CD4+, respectively. The histograms were generated from 10,000 events after gating. The gating strategy for flow cytometry is shown in Appendix Fig. S1. Legend: Grey=unstained control; Green=CD8 staining; Blue = CD4 staining. (B) Fura-2 measurements of cCa2+ in naive CD4+ T-cells treated with anti-CD3/CD28-coated magnetic beads (1:5 bead:cell ratio) or antibody solution (1:1000 working solution). Quantification shown as mean ± SD of 1479 bead-activated and 1,656 antibody solution-activated T-cells/biological replicates from 5 healthy donors. ****p < 0.0001 (p = 1.34872E−74), assessed by two-tailed unpaired Student’s t-test. (C) Naive T-cell proliferation following beads or antibody solution stimulation. Quantification shown as mean ± SEM of 8 healthy donors/biological replicates. ***p < 0.001 (p = 0.0006); **p < 0.01 (p = 0.0039), assessed by two-tailed paired Student’s t-test. RFU = relative fluorescence units. (D) Fura-2 measurements of cCa2+ in naive and effector T-cells. The SERCA-blocker thapsigargin (Tg; 1 μM) was used to deplete ER Ca2+ stores and activate SOCE. (E) Quantification of data given in (D). Data show mean ± SD of 768 naive T-cells and 577 effector T-cells/biological replicates from 3 healthy donors, normalised to their respective cell volume (in µm3) as shown in (G). ****p < 0.0001 (p = 2.73994E−12), assessed by two-tailed unpaired Student’s t-test. (F) Representative 3D images of a naive (left) and an effector (right) T-cell. Using pixel classification in Imaris v10.1.0, the cell surface (green) and the mitochondria (red) were created (refer to methods for more details). Quantification of cellular (G) and mitochondrial (H) volume in naive and effector T-cells showing a mean ± SEM of 66 naive and 52 effector T-cells/biological replicates from 3 healthy donors. Cell volume was quantified by using Machine Learning-based segmentation. ****p < 0.0001 (p = 2.40289E−45) and (p = 2.3739E−37), assessed by two-tailed unpaired Student’s t-test. (I) Measurements of mCa2+ levels with the 4mtTNXL biosensor in human naive and effector T-cells. Quantification plots show an average of 118 naive and 331 effector cells/biological replicates from 2 different donors. Cell stimulation was achieved by addition of 1 µM Tg at the indicated time point. The quantification/violin plots show mean ± SD of basal mCa2+ levels and maximal mCa2+ uptake. ****p < 0.0001 (Basal p = 1.6523E−33; Uptake p = 8.3596E−16), assessed by two-tailed unpaired Student’s t-test. (J) Measurements of mCa2+ levels with the 4mtTNXL biosensor in human naive and effector T-cells. Traces show an average of 4 naive and 16 effector cells/biological replicates from 1 healthy donor. Cells were stimulated with anti-human CD3/CD28-coated beads at the indicated time point. The quantification/violin plots show mean ± SD for both the basal mCa2+ levels and mCa2+ uptake. ***p < 0.001 (p = 0.0004). (K) Calcium Retention Capacity (CRC) assay measuring mCa2+ uptake in digitonin-permeabilized naive and effector T-cells using Calcium-Green-5N. Traces show mean ± SEM relative fluorescence units (RFU) of 10 naive and 10 effector T-cells/biological replicates from 3 healthy donors (assays always performed at least in duplicate). mCa2+ uptake was induced by subsequent additions of a bolus of Ca2+ at the indicated time points (black arrows). The quantification plots show mean ± SEM for basal mCa2+ uptake at the time points indicated by a red star. mCa2+ uptake was quantified as the delta decrease in measured RFU upon Ca2+ addition. *p ≤ 0.05 (p = 0.0481-left; p = 0.0443-right panel), assessed by two-tailed unpaired Student’s t-test.
Figure EV2
Figure EV2. Activation of naive human T-cells causes time-dependent proteome alterations.
Proteomics and bioinformatic analyses of bead-activated T-cells for 12, 24, 48, and 72 h. The volcano plots (A, B) show significantly up- (purple) and downregulated (orange) proteins as compared to naive T-cells. (CF) Proteomap-based evaluation of signalling pathways and cellular functions regulated by significantly up- (upper panels) and downregulated (lower panels) proteins following bead-induced T-cell activation (from 12 to 72 h). Proteomaps are based on differentially-expressed proteins (DEPs) depicted in Fig. 3F.
Figure EV3
Figure EV3. MCUaKD affects human effector T-cell function.
(A) RT-qPCR-based evaluation of transient MCUa knockdown efficiency in human CD4+ effector T-cells. The quantified graph shows mean ± SEM of 9 healthy donors/biological replicates, as compared to control transfection. ****p < 0.0001 (p = 3.89251E−13), assessed by two-tailed paired Student’s t-test. (B) Immunoblot-based evaluation of transient MCUa knockdown efficiency in human CD4+ effector T-cells. Quantification shows mean ± SEM from 3 healthy donors/biological replicates as compared to control transfection, normalised to Histone H3. **p < 0.01 (p = 0.0033), assessed by two-tailed paired Student’s t-test. (C) RT-qPCR-based evaluation of Ca2+ signalling-related genes and MCU complex components in effector T-cells with transient knockdown of MCUa. Quantifications show mean ± SEM from 3 healthy donors/biological replicates for all assessed genes. ns - not significant, assessed by two-tailed paired Student’s t-test. (D, E) Measurements of cCa2+ levels using Fura2 in control and siMCUaKD effector T-cells. Quantification shows mean ± SD of 648 control and 739 siMCUaKD T-cells/biological replicates from 3 healthy donors. Tg = 1 μM. ****p < 0.0001 (Basal p = 8.86452E−78; SOCE p = 3.26694E−11), assessed by two-tailed unpaired Student’s t-test. (F, G) Measurements of cCa2+ levels using Fura2 in siMCUaKD effector T-cells. Quantification shows mean ± SD of 848 control and 930 siMCUaKD T-cells/biological replicates from 2 healthy donors. Tg = 1 μM. ****p < 0.0001 (p = 5.75699E−46), assessed by two-tailed unpaired Student’s t-test. (H) Measurements of cCa2+ levels using Fura2 in control and siMCUaKD effector T-cells stimulated with anti-human CD3/CD28-coated beads. Quantification shows mean ± SD of 169 control and 365 siMCUaKD T-cells/biological replicates from 2 healthy donors. **p < 0.01 (p = 0.0033), assessed by Student’s t-test. (I, J) IFNγ mRNA levels in re-stimulated siMCUaKD T-cells. The quantification (at 25 µL/mL Ab solution) shows mean ± SEM of 8 healthy donors/biological replicates. *p ≤ 0.05 (p = 0.0457), assessed by two-tailed paired Wilcoxon test. Source data are available online for this figure.
Figure EV4
Figure EV4. Establishment of MCUaKD models in rat effector T-cells.
(A) Schematic representation of retroviral constructs used to establish control and sgMCUaKD rat effector T-cell lines. LTR – long terminal repeats; PuroR – puromycin resistance gene; U6p – U6 promoter; 2mt – tandem mitochondrial localisation signals. (B) Schematic representation of the rat MCUa gene and the position of protospacers targeted by single guide RNAs (sg; the numbering of exons starts from the first coding exon) (Images (A) and (B) created with BioRender). (C, D) Immunoblot-based evaluation of knockdown efficiency in sgMCUaKD 2 (C) and sgMCUaKD 1 (D) cell lines. Protein expression data are normalised to the loading control calnexin. Quantification shows mean ± SEM of 3 experiments/biological replicates. **p < 0.01 (p = 0.0065), assessed by two-tailed unpaired Student’s t-test, in (D). (E) PCR-based T7 endonuclease cleavage confirmed the intended editing of the respective sequence in the different sgMCUaKD cell lines. T7 cleavage fragments, marked by a star, revealed sequence alterations (indels) introduced by Cas9 at a genomic level. (F) Confocal images of DAPI-stained sgMCUaKD 1 T-cells transduced by Puro2A-2mtScarlet-GCaMP6s retrovirus show proper mitochondrial localisation of the biosensor 2mtScarlet-GCaMP6s. Scale bar: 10 µm. (G) Body weight change curves in animals during transfer EAE experiments (related to Fig. 6H). Data show mean ± SEM, as percentage of initial weight on day 0 (n = 4 animals for the control group and n = 3 animals for the sgMCUaKD 1 and 2 groups). (H) Inactivation of MCUa results in a delayed EAE onset in rats injected with MBP-specific effector T-cells. Data are represented as mean ± SEM of 3 animals/biological replicates per condition. **p < 0.01 (p = 0.0018), assessed by Mann–Whitney U test. (I) (related to Fig. 7). An equal number of different fluorescently-labelled control (Scarlet fluorescent protein) and sgMCUaKD (Turquoise fluorescent protein) T-cells were co-transferred in Lewis rats. Both cell lines that were injected showed a similar activation state assessed by CD134 (OX-40) and CD25 expression using flow cytometry. (J) Ex vivo-isolated T-cells were analysed at different time points after co-transfer using flow cytometry. At day 1 after co-transfer, sgMCUaKD T-cells (57.9%) outnumbered the control cells (34.6%) in the blood. At day 3 after co-transfer, the control T-cells (68.7%) outnumbered the sgMCUaKD cells (30.1%) in the brain. (K) sgMCUaKD T-cells that have succeeded to enter the CNS show comparable activation as those cells in the blood, determined by CD134 (OX-40) expression. (L) OX-40 expression of control and sgMCUaKD T-cells in the brain at day 3 after co-transfer. Quantification shows mean fluorescence intensity (MFI) of CD134 from 3 rats/biological replicates. ns - not significant, assessed by unpaired Student’s t-test. Source data are available online for this figure.
Figure EV5
Figure EV5. MCUaKD in rat effector T-cells alters their proteome.
Proteomics data generated from the two sgMCUaKD cell lines and the control rat T-cell line. (A) The volcano plot shows multiple significant up- (magenta) and downregulated (orange) proteins in the two sgMCUaKD cell lines, compared to control, analysed by ANOVA (5% FDR). (B) Proteomaps showing the quantitative composition of proteomes with a high probability to be significantly up- (left panel) and downregulated (right panel) upon MCUa knockdown in rat effector T-cells. Proteomaps are based on DEPs shown in (A). (C, D) Significant up- (C) and downregulated (D) cellular functions and signalling pathways in sgMCUaKD cells ordered by percentage of associated proteins, based on DEPs shown in (A). (E) HOMER analysis of the proteomic data showing the top five most enriched motifs (TFs). Analysis is based on q-values (Benjamini-Hochberg-C).

References

    1. Baughman JM, Perocchi F, Girgis HS, Plovanich M, Belcher-Timme CA, Sancak Y, Bao XR, Strittmatter L, Goldberger O, Bogorad RL et al (2011) Integrative genomics identifies MCU as an essential component of the mitochondrial calcium uniporter. Nature 476:341–345 - PMC - PubMed
    1. Ben-Nun A, Wekerle H, Cohen IR (1981) The rapid isolation of clonable antigen-specific T lymphocyte lines capable of mediating autoimmune encephalomyelitis. Eur J Immunol 11:195–199 - PubMed
    1. Berod L, Friedrich C, Nandan A, Freitag J, Hagemann S, Harmrolfs K, Sandouk A, Hesse C, Castro CN, Bähre H et al (2014) De novo fatty acid synthesis controls the fate between regulatory T and T helper 17 cells. Nat Med 20:1327–1333 - PubMed
    1. Berthold MR, Cebron N, Dill F, Gabriel TR, Kötter T, Meinl T, Ohl P, Thiel K, Wiswedel B (2009) KNIME - the Konstanz information miner: version 2.0 and beyond. SIGKDD Explor Newsl 11:26–31
    1. Bogeski I, Kummerow C, Al-Ansary D, Schwarz EC, Koehler R, Kozai D, Takahashi N, Peinelt C, Griesemer D, Bozem M et al (2010) Differential redox regulation of ORAI ion channels: a mechanism to tune cellular calcium signaling. Sci Signal 3:ra24 - PubMed

MeSH terms