. 2025 Jan;11(1):118-130.
doi: 10.1038/s41477-024-01864-z. Epub 2024 Dec 2.

Regulation and function of a polarly localized lignin barrier in the exodermis

Affiliations

Regulation and function of a polarly localized lignin barrier in the exodermis

Concepcion Manzano et al. Nat Plants. 2025 Jan.

Abstract

Multicellular organisms control environmental interactions through specialized barriers in specific cell types. A conserved barrier in plant roots is the endodermal Casparian strip (CS), a ring-like structure made of polymerized lignin that seals the endodermal apoplastic space. Most angiosperms have another root cell type, the exodermis, that is reported to form a barrier. Our understanding of exodermal developmental and molecular regulation and function is limited as this cell type is absent from Arabidopsis thaliana. We demonstrate that in tomato (Solanum lycopersicum), the exodermis does not form a CS. Instead, it forms a polar lignin cap (PLC) with equivalent barrier function to the endodermal CS but distinct genetic control. Repression of the exodermal PLC in inner cortical layers is conferred by the SlSCZ and SlEXO1 transcription factors, and these two factors genetically interact to control its polar deposition. Several target genes that act downstream of SlSCZ and SlEXO1 in the exodermis are identified. Although the exodermis and endodermis produce barriers that restrict mineral ion uptake, the exodermal PLC is unable to fully compensate for the lack of a CS. The presence of distinct lignin structures acting as apoplastic barriers has exciting implications for a root's response to abiotic and biotic stimuli.


Conflict of interest statement

Competing interests: The authors declare no competing interests.

Figures

Fig. 1
Fig. 1. Exodermal lignin is polarized and serves as an apoplastic barrier.
a, Tomato root cross-section stained with basic fuchsin (pink) and calcofluor white (blue) for lignin and cellulose, respectively. ex, exodermis; C1, cortex 1; C2, cortex 2; C3, cortex 3; en, endodermis. Scale bar, 50 µM. b, Model for exodermis lignin deposition. Top: each cube represents an exodermis cell. The epidermis (epi) face is on the right. Pink represents lignin. Bottom: root cross-sections from 0.4 cm, 1 cm, 2 cm and 8 cm from the root tip, stained with basic fuchsin. c, TEM of a middle root section stained with potassium permanganate. Left: root section. Middle: magnified exodermis (grey dotted square). Right: magnified endodermis (blue dotted square). co, cortex; pe, pericycle. Identical results were observed in 3 independent experiments. d, Same images as in c with adjusted contrast to highlight lignin. Dark arrows highlight lignin deposition in the exodermis cell wall. e, Tomato root sections from control and PA-treated plants for 24 h and next incubated with the apoplastic tracer PI for 30 min. Scale bars, 50 µM. f, Quantification of PI blockage at the exodermal PLC and penetration into cortex cells in control and PA-treated plants (n = 11). PI blockage ****P = 9.5 × 10−11; PI penetration **P = 0.0046. *statistical significance (one-way ANOVA). Boxplots show the median, 25th−75th percentiles (interquartile range (IQR)), and minima and maxima (whiskers). g, Tomato root cross-sections from control, PA-treated and PA+monolignol-treated plants, followed by incubation with PI. Scale bars, 50 µM h, Quantification of PI blockage at the epidermis, exodermal PLC and cortex cell penetration in control and PA-treated plants and PA+monolignol plants, followed by incubation with PI (n = 11). Statistical significance was determined using one-way ANOVA with a post hoc Tukey HSD test; P < 0.05. Letters indicate statistically different groups. Boxplot definitions are as in f.
Fig. 2
Fig. 2. Known endodermal developmental regulators do not control exodermal differentiation.
a, Root sections of 4-day-old plants stained with basic fuchsin (pink) and calcofluor white (blue) for lignin and cellulose. Left: the wild-type endodermis has a CS and the exodermis a polar lignin cap (PLC). Middle: in the slshr-1 mutant, the CS is absent earlier (8 mm from the tip). Right: ectopic lignin deposition is observed in cells that surround the vasculature (10 mm from the tip). The exodermal PLC is normal. b, Left: root length of 4-day-old wild type and slshr-1 (n = 12). Middle: cortical symmetry (exodermis included) calculated as the minimum/maximum number of cortex layers in radial cross-section (n = 10) in wild type and slshr-1. Right: vascular cylinder symmetry measured by minimum/maximum distance across its centre (n = 10). Statistical tests with one-way ANOVA; ***P < 0.005. Boxplots show the median, 25th−75th percentiles (IQR), and minima and maxima (whiskers). c, Two independent mutant alleles of SlMYB36 (slmyb36-1 and slmyb36-2) lack an endodermal CS but retain a wild-type exodermal PLC. Left: root cross-section stained with basic fuchsin, blue asterisks show a normal exodermal PLC. Right: magnified view of vascular cylinder and endodermis. Results were consistent across 3 experiments. d, SlSGN3 mutation (slsgn3-1) leads to an interrupted, non-continuous CS. Left: root section stained with basic fuchsin, blue asterisks show a normal exodermal PLC. Right: magnified view of vascular cylinder and endodermis. Small square, top views showing wild-type versus interrupted CS in slsgn3-1 (white asterisks and triangles). Brightness was adjusted in the magnified pictures for clarity. Results were consistent across 3 experiments. e, Translational fusions of SlCASP2 and SlCASP1 with mCitrine under their respective promoters localize specifically in the endodermis, not the exodermis. Cell walls are stained with calcofluor white (blue), lignin with basic fuchsin (pink), and mCitrine is visualized in the GFP channel (green). Results were consistent across 6 experiments. f, slcasp1/2 double mutant did not affect endodermal CS or exodermal PLC formation relative to wild type. Lignin is stained with basic fuchsin (pink). Results were consistent across 4 experiments. All CRISPR or reporter lines were generated via A. tumefaciens transformation unless otherwise noted. All scale bars, 50 µm.
Fig. 3
Fig. 3. SlEXO1 and SlSCZ repress lignification in the inner cortical layer(s).
a, The slexo1-1 mutant shows an additional PLC in the first inner cortical layer, while the slscz-1 mutant shows additional PLC and occasional full lignification in cortex layers and non-polar lignification in the exodermis. The first inner cortex layer contains a PLC. The slscz-3slexo1-2 double mutant shows reduced symmetric lignification compared with slscz-1. b, Overexpression of SlEXO1 (OE-SlEXO1) reduces exodermal PLC and increases epidermal lignin. Overexpression of SlSCZ (OE-SlSCZ) causes ectopic lignification in some inner cortex cells. ic, inner cortex. Pink, lignin. c, Root length of wild type, the slexol-1, slscz-1 and slscz-3slexol-2 mutants, and SlEXO1 and SlSCZ overexpressors (wildtype, n = 9; slscz-1, n = 6; slexo1, n = 5; OE-SlEXO1, n = 10; OE-SlSCZ, n = 7). Significance was determined using one-way ANOVA with post hoc Tukey HSD test; P < 0.05. Boxplots show median, 25th−75th percentiles (IQR), and minima and maxima (whiskers). d, Proportion of exodermal cells showing no PLC, corner lignin, the PLC and fully (symmetric) lignin in wild type, slscz-1, slexo1-1, slscz-3slexo1-2, OE-SlSCZ and OE-SlEXO1 (wild type, n = 8; slscz-1, n = 8; slexo1, n = 6; OE-SlEXO1, n = 10; OE-SlSCZ, n = 12). Lignin (pink) patterns are represented in hexagons. Significance was determined using one-way ANOVA with a post hoc Tukey HSD test (P < 0.05). Error bars denote s.d. e, Proportion of inner cortex cells with no PLC, corner lignin, PLC and fully (symmetric) lignification in wild type, slscz-1, slexo1-1, slscz-3slexo1-2, OE-SlSCZ and OE-SlEXO1 (wild type, n = 8; slscz-1, n = 8; slexo1, n = 6; OE-SlEXO1, n = 10; OE-SlSCZ, n = 12). Lignin patterns are represented in hexagons. Significance was determined using one-way ANOVA with a post hoc Tukey HSD test (P < 0.05). Error bars denote s.d. f, Uniform manifold approximation and projection (UMAP) of cortex/endodermis/exodermis cells re-embedded from the general projection (Extended Data Fig. 8e). SlEXO1 is expressed in the cortex, and SlSCZ is expressed in the meristem, cortex and exodermis. Colour scale shows log2-normalized unique molecular identifier counts. g, Cell type-specific expression profiles for SlEXO1 and SlSCZ. Dot size indicates the percentage of expressing cells and colours represent scaled average expression across developmental stages, with warmer colours indicating higher expression levels. RC, root cap; QC, quiescent centre; Col, columella; Procamb, procambium. All scale bars, 50 µm.
Fig. 4
Fig. 4. SlEXO1 and SlSCZ transcriptionally regulate distinct and overlapping genes.
a, PCA of wild type (orange), slscz (green) and slexo1 (purple) of R. rhizogenes-transformed root transcriptomes. The first two dimensions contribute to 39.5% of the observed variation. The transcriptomes of these genotypes are distinct in PC1 and PC2. b, Venn diagram indicating the common and uniquely DEGs in two independent slexo1 mutant alleles and two independent slscz mutant alleles (FDR = 0.05; fold change ± 1.3) relative to wild type. c, Heat map indicating significantly DEGs in each genotype (with slexo1 and slscz representing DEGs in two independent alleles each) relative to wild type. Colour intensity represents the row-normalized z-score. Rows are clustered with Pearson correlation and columns with Spearman correlation. d, Cell type or tissue-enriched expression profiles for upregulated genes (FDR < 0.05) in slexo1 and slscz mutants. Dot size indicates the percentage of expressing cells and colours represent scaled average expression across developmental stages, with purple colours indicating higher expression levels. Common upregulated genes in slexo1 and slscz, upregulated genes in slexo1 and upregulated genes in slscz are highlighted in green, yellow and blue. e, Enriched GO terms for upregulated exodermis-expressed genes in slexo1 and slscz-1 (from d) relative to wild type.
Fig. 5
Fig. 5. The exodermal PLC barrier does not compensate for the endodermal Casparian strip.
a, Schematic representation of wild type, slmyb36-1, slexo1-1 and slscz-1 lignin in the endodermis, cortex and exodermis. b, PCA of 20 mineral ions within wild-type, slmyb36-1, slexo1-1 and slslscz-1 mutant plants (n = 4 for slscz-1, slexo1-1 and wild type; n = 3 for slmyb36-1). Considerable variation exists between the ionome of the slscz-1 and slmyb36-1 mutants. c, log2 fold change (FC) of ions relative to wild type. Heat map indicates the relative abundance of ions. Statistical significance was determined using one-way ANOVA; *P < 0.05.
Extended Data Fig. 1
Extended Data Fig. 1. Ultrastructural lignin deposition in the exodermis and endodermis.
a. TEM panoramas from wild-type root cross-sections at 2, 5, and 8 mm from the tip, a middle section of the root, and at 1mm from hypocotyl stained with KMn04. Dark deposits indicate electron dense Mn02 precipitation caused by reaction with lignin. Lower panels show the same pictures with an adapted contrast that highlights the dark deposits. co = cortex, exo = exodermis, ep = epidermis, en = endodermis, pe =pericycle, scale bars=30 µm. b. Close-up of the exodermis area from panels in A (zone defined with brown dashed lines). Lower panels show the same pictures with an adapted contrast that highlights the dark deposits. Dark arrows highlight lignin deposition in the exodermis cell wall. White arrows highlight the absence of lignin in the exodermis cell wall. Lignin deposition begins at 8mm from the root tip and is oriented toward the epidermis. co = cortex, exo = exodermis, ep = epidermis, scale bars=5 µm. c. Close-up of the endodermis area from panels in A (zone defined with blue dashed lines). Lower panels show the same pictures with an adapted contrast that highlights the dark deposits. The CS is fully lignified at 5mm from the root tip. co = cortex, en = endodermis, pe = pericycle, cs = Casparian strip, scale bars=5 µm.
Extended Data Fig. 2
Extended Data Fig. 2. The PLC is conserved in the Solanaceae family and piperonylic acid does not affect root growth.
a. Cross sections of Solanum species and Nicotiana benthamiana stained with basic fuchsin and calcofluor. Left panel: Capsicum annuum variety Alliance bell pepper. Middle panel: Solanum tuberosum group Andigenum. Right panel: Nicotiana benthamiana. Scale bar = 50 µM. b. Schematic representation of the experimental design to test the PA. 4-day-old plants after germination were transferred to MS media + 1% sucrose with and without 200 µM of PA. After 24 hours, root growth was measured for the part of the root that grew after transferring. Orange horizontal bar = newly grown root after transferring. Scale Bar = 50 µm c. Root growth after 24H in control and PA treatment for the new root zone after transferring n=6. Statistical significance test determined by one-way ANOVA p-value <0,05. Box plots show median, IQR (25th−75th percentile), and whiskers represent minima and maxima. Error bars s.d.
Extended Data Fig. 3
Extended Data Fig. 3. Endodermal regulators do not regulate exodermal differentiation.
a. Hairy root cross-sections stained with fuchsin of wild-type (transformed with R.rhizogenes with no binary plasmid) and shr-1 mutants from 2 independent hairy root lines. Left panel = wild-type, middle panel = slshr1 hairy root Line 1 (slshr1-hr1), right panel = slshr1 hairy root line 2 (shr1-hr2). Scale Bar = 50 µm b. Cross sections of wild-type and the shr-2 mutant allele (A. tumefaciens-transformed) from two different parts of the root - 8 mm from the tip (middle) and 10 mm from the tip (right). The mutant layer undergoes ectopic lignin deposition in more mature regions of the root. Scale Bar = 50 µm c. Left panel: Symmetry of cortical layers (including the exodermis). This is calculated as the minimum number of cortex layers observed divided by the maximum number of cortex layers in wild type and shr-2 mutant roots (p-value=2.86e06, *=statistical significance as determined by one-way ANOVA n=14. Box plots show the median, error bars s.d. IQR (25th−75th percentile) and whiskers represent minima and maxima. d. Symmetry of the vascular cylinder was calculated as the minimum distance across the centre of the vascular cylinder divided by the maximum distance across the centre of the vascular cylinder (p-value=1.36e05, *=statistical significance as determined by one-way ANOVA n=14). Box plots show the median, IQR (25th−75th percentile) and whiskers represent minima and maxima. e. Hairy roots with transcriptional fusions for CASP1-3 genes to GFP and a translational fusion of SlCASP3 to mCitrine transformed. Scale Bar = 50 µm f. Hairy roots with SlSGN3 and SlCIF2 transcriptional fusion to GFP. Scale Bar = 50 µm. g. Root length in cm of two slmyb36 independent alleles. Statistical significance as determined by one-way ANOVA with a post-hoc Tukey HSD test; pvalue<0.05 n=5. Box plots show the median,IQR (25th−75th percentile) and whiskers represent minima and maxima. h. Mutation of SlSGN3 in the hairy root line 7 results in an absent CS, or in a perturbed CS in the radial axis. Left panels = whole root section stained with fuchsin. Blue asterisks show the polar lignin cap in the exodermis is not affected.; right panels = magnified image of vascular cylinder and endodermis layer. Scale Bar = 50 µm. Results were consistent across three experiments. i. Expression patterns of two SlMYB36 homologs from the MYB36 phylogeny in individual cell-types from data in Kajala et al. . Legend on the left represents the Log2 maximum value across all conditions and legend on the right represent the Log2(x)/Median. j. Cross section of R. rhizogenes generated mutant allele myb36-b hairy root line 8 (slmyb36-b hr-8) for Solyc04g077260. Whole root cross section. Blue asterisks show the polar lignin cap in the exodermis is not affected. k. Increased magnification of the endodermis (From panel J – see corresponding orange and purple boxes). Results were consistent across three experiments Scale bar = 50 µm.
Extended Data Fig. 4
Extended Data Fig. 4. CRISPR-edited hairy root mutants for exodermal-enriched transcription factors.
Guide RNAs and edited mutations are found in Supplemental Table 1. For all panels: Root cross sections stained with Basic Fuchsin. a. Control = non-transformed hairy root. b. slmyc4 hairy root line 2 (Solyc08g005050). c. slbhlh071-1 hairy root line 9 (Solyc11g010340). d. slagl20 hairy root line 9 (Solyc01g093965). e. slwrk31 hairy root line 3 (Solyc05g007110). f. slmgp hairy root line 17 (Solyc01g099340). g. slmyb54 hairy root line 2 (Solyc10g081320). h. slblh10 hairy root line 16A (Solyc06g074120). i. slerf3 hairy root line 3 (Solyc06g082590). j. slshn1 hairy root line 5 (Solyc01g005630). k. slmyb107b hairy root line 6 (Solyc02g088190). l. slmyb54-1 (Solyc03g093890). m. slsant hairy root line 7 (Solyc10g080960). n. slmyb107a hairy root line 15 (Solyc02g079280). o. slathb5 hairy root line 8 (Solyc01g096320). p. slmyb68 hairy root line 7 (Solyc11g069030). q. slerf98 hairy root line 12 (Solyc05g050790). r. slnuc hairy root line 11 (Solyc09g074780). s. slmyb77 hairy root line 6 (Solyc04g079360). t. slmyb13 hairy root line 7 (Solyc08g008480). u. slnac041 hairy root line 8 (Solyc01g009860). All scale bars = 50 µm.
Extended Data Fig. 5
Extended Data Fig. 5. slscz and slexo1 overexpressor and mutant lines.
a. Control cross section stained with fuchsin. b. slscz hairy root line 4 (slscz-hr4) cross section stained with fuchsin. c. slscz hairy root line 5 (slscz-hr5) cross section stained with fuchsin. d. slscz hairy root line 12 (slscz-hr12) cross section stained with fuchsin. e. A. tumefaciens-transformed slscz-2 line cross section stained with fuchsin. f. slbrt-2 mutant (Kevei et al., ). g. OE-SlSCZ hairy root line 19 (OE-SlSCZ-hr19) cross section stained with fuchsin. h. OE-SlSCZ hairy root line 14 (OE-SlSCZ-hr14) cross section stained with fuchsin. i. Control cross section stained with fuchsin. j. slexo1 hairy root line 3 (slexo1-hr3) cross section stained with fuchsin. k. slexo1 hairy root line 6 (slexo1-hr6) cross section stained with fuchsin. l. slexo1 hairy root line 7 (slexo1-hr7) cross section stained with fuchsin. m. slexo1 hairy root line 10 (slexo1-hr10) cross section stained with fuchsin. n. OE-SlEXO1 hairy root line 29 (OE-SlEXO1-hr29) cross section stained with fuchsin. o. OE-SlEXO1 hairy root line 36 (OE-SlEXO1-hr36) cross section stained with fuchsin. p. Control cross section stained with fuchsin. q. A. tumefaciens-transformed slscz-4slexo1-2 double mutant line cross section stained with fuchsin. r. slsczslexo1 hairy root line 11 (slsczslexo1-hr11) double mutant cross section stained with fuchsin. All scale bars = 50 µm. s. Left panel: Relative expression of SlSCZ in OE-SlSCZ stable line and wild type (n= 6) (p-value=3.12e-11, one-way ANOVA). Middle panel: Relative expression of SlSCZ in OE-SlSCZ hairy root line 14 and wild type (n= 6) (Hairy root line with no vector) (p-value= 2.47e-05, one-way ANOVA). Right panel: Relative expression levels in OE-SlSCZ hairy root line 19 and wild type (Hairy root line with no vector) (n= 6) (p-value= 3.62e-05, one-way ANOVA) (Signif. codes: 0 ‘***’ 0.001 ‘**’ 0.01 ‘*’ 0.05). Error bars denote s.d. t. Left panel: Relative expression of SlEXO1 in OE-SlEXO1 stable line and wild type (n= 6) (p-value= 1.89e-11, one-way ANOVA). Middle panel: Relative expression of SlEXO1 in OE-SlEXO1 hairy root line 29 and wild type (Hairy root line with no vector) (n= 6) (p-value= 1.59e-07, one-way ANOVA). Right panel: Relative expression levels of OE-SlEXO1 hairy root line 36 wild type (Hairy root line with no vector) (n= 6) (p-value= 3.12e-05, one-way ANOVA) (Signif. codes: 0 ‘***’ 0.001 ‘**’ 0.01 ‘*’ 0.05). Error bars denote s.d.
Extended Data Fig. 6
Extended Data Fig. 6. Phenotypes of the aerial part of slexo1, slscz-1, OE-SlEXO1, OE-SlSCZ and slexo1-2slscz-3 plants.
a. Pictures of 4 weeks old wild-type, slexo1-1 and slscz-1 plants. b. Leaves of OE-SlEXO1 are smaller than wild-type leaves. Rule = 30 cm. c. Four-day old seedlings of Wild-type, slexo1-1, slscz-1, slscz-3slexo1-2, OE-SlEXO1, OE-SlSCZ. Scale bar = 2 cm. Ruler = 30cm.
Extended Data Fig. 7
Extended Data Fig. 7. The inner cortex cells in slexo1-1, slscz-1 and slscz-3slexo1-2 are partially suberized.
a. The slexo1-1, slscz-1 and slscz-3slexo1-2 mutants and OE-SlSCZ have inner cortical layers suberized relative to wild type. The OE-SlEXO1 lacks suberin in both the exodermis and inner cortex. Yellow = fluorol-yellow/suberin, Blue = Autofluorescence. ep = Epidermis, ex = Exodermis, ic = Inner cortex. Scale Bar = 50 µm. b. Ratio of suberin in inner cortex, in radial cross-section, was calculated as the number of suberized inner cortex layers observed divided by the total number of inner cortex layers in wild type and slexo1-1, slscz-1 and slscz-3slexo1-2 mutants roots and SlEXO1 and SlSCZ overexpressors. Statistical significance was determined by one-way ANOVA with a post-hoc Tukey HSD test. pvalue<0.05. Box plots show median, IQR (25th-75th percentile), and whiskers represent minima and maxima. Error bars s.d. c. Ratio of suberin in inner cortex, in radial cross-section, was calculated as the number of suberized inner cortex layers observed divided by the total number of inner cortex layers in wild type and slexo1-1, slscz-1 and slscz-3slexo1-2 mutants roots and SlEXO1 and SlSCZ overexpressors. Statistical significance was determined by one-way ANOVA with a post-hoc Tukey HSD test; pvalue<0.05. Box plots show median, IQR (25th-75th percentile), and whiskers represent minima and maxima. Error bars s.d.
Extended Data Fig. 8
Extended Data Fig. 8. SlEXO1 and SlSCZ1 are expressed in cortex and/or exodermis and meristematic region.
a. SlEXO1 transcriptional fusion (SlEXO1p::SlEXO1-NLSGFP). From left to right: Meristem, elongation, and maturation zones. SlEXO1 is expressed in the epidermis, exodermis, inner cortex, and endodermis in the maturation zone. GFP (Green) and autofluorescence (Blue). Scale Bar = 50 µm. White and orange arrowheads point out the CS autofluorescence and NLS-GFP respectively. b. SlEXO1 promoter fused to the SlEXO1 coding region and mCitrine to show the protein was not detected. White arrowhead points CS. Scale Bar = 50 µm c. SlSCZ transcriptional fusion (SlSCZp::SlSCZ-NLSGFP). From left to right: Meristem, elongation, and maturation. SlSCZ is expressed in the endodermis, cortex, and exodermis meristematic cells and the epidermis, exodermis, cortex, and endodermis in the maturation zone. Meristem images: Green= GFP. Blue = Calcofluor White. Elongation and maturation zone images: Green= GFP. Blue = autofluorescence. Scale Bar = 50 µm. White and orange arrowheads point to the CS autofluorescence and NLS-GFP respectively. d. SlSCZ promoter fused to the SlSCZ coding region and mCitrine demonstrates the protein is localized in the stem cell niche, the two inner cortical layers, and the exodermis. The SlSCZ protein was not detected at the elongation or maturation zone. Meristem images: Green= citrine. Blue = Calcofluor White. Elongation and maturation images: Green= citrine. Blue = autofluorescence. Images are captured from R. rhizogenes transformed roots. Scale Bar = 50 µm. White and orange arrowheads point to the CS autofluorescence and mCitrine respectively. e. Left panel: Annotated single cell clusters from tomato root displayed by an integrated uniform manifold approximation and projection (UMAP). Middle panel: UMAP with SlEXO1 expression. Right panel: UMAP with SlSCZ expression (data from Canto-Pastor et al., 2024).
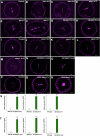
Extended Data Fig. 9
Extended Data Fig. 9. Ion content in slexo1-1, slscz-1, slmyb36-1 and wild-type.
Ion content in ppm (Parts per million) for As (Arsenic), B (Boron), Ca (Calcium), Cd (Cadmium), Co (Cobalt), Cu (Cupper), Fe (Iron), K (Potassium), Li (Lithium), Mg (Magnesium), Mn (Manganese), Mo (Molibdenum), Na (Sodium), Ni (Nikel), P (Phosphorous), Rb (Rubidium), S (Sulfur), Se (Selenium), Sr (Strontium), and Zn (Zinc). n=3-4. Statistical significance was determined by one-way ANOVA. Signif. codes: 0 ‘***’ 0.001 ‘**’ 0.01 ‘*’. Box plots show median, IQR (25th-75th percentile), and whiskers represent minima and maxima. Error bars s.d.
Extended Data Fig. 10
Extended Data Fig. 10. Model for exodermis and inner cortex differentiation.
Exodermis: SlSCZ genetically interacts with SlEXO1 in repressing symmetric lignification in the PLC pathway. Asterisk = genetic interaction. High levels of ectopic SlEXO1 repress PLC formation and suberization. A hypothetical Transcription factor (X) or Signaling Gene may control the expression of a laccases and/or lignin biosynthesis genes to form the PLC. In a second differentiation step, the transcription factor SlMYB92 (and likely others MYB TFs) activate the suberin biosynthetic pathway (Canto-Pastor et al, 2024). Inner Cortex I and II: SlSCZ and SlEXO1 either directly or indirectly repress X or Signaling Gene which controls PLC formation, suberization, and potentially exodermal specification.

References

    1. Enstone, D. E., Peterson, C. A. & Ma, F. Root endodermis and exodermis: structure, function, and responses to the environment. J. Plant Growth Regul.21, 335–351 (2002).
    1. Alassimone, J., Naseer, S. & Geldner, N. A developmental framework for endodermal differentiation and polarity. Proc. Natl Acad. Sci. USA107, 5214–5219 (2010). - PMC - PubMed
    1. Roppolo, D. et al. A novel protein family mediates Casparian strip formation in the endodermis. Nature473, 380–383 (2011). - PubMed
    1. Hosmani, P. S. et al. Dirigent domain-containing protein is part of the machinery required for formation of the lignin-based Casparian strip in the root. Proc. Natl Acad. Sci. USA110, 14498–14503 (2013). - PMC - PubMed
    1. Lee, Y., Rubio, M. C., Alassimone, J. & Geldner, N. A mechanism for localized lignin deposition in the endodermis. Cell153, 402–412 (2013). - PubMed

Publication types

MeSH terms

Associated data

LinkOut - more resources