. 2024 Dec 2;25(1):1168.
doi: 10.1186/s12864-024-11068-6.

Expression quantitative trait loci influence DNA damage-induced apoptosis in cancer

Affiliations

Expression quantitative trait loci influence DNA damage-induced apoptosis in cancer

Jessica Bigge et al. BMC Genomics. .

Abstract

Background: Genomic instability and evading apoptosis are two fundamental hallmarks of cancer and closely linked to DNA damage response (DDR). By analyzing expression quantitative trait loci (eQTL) upon cell stimulation (called exposure eQTL (e2QTL)) it is possible to identify context specific gene regulatory variants and connect them to oncological diseases based on genome-wide association studies (GWAS).

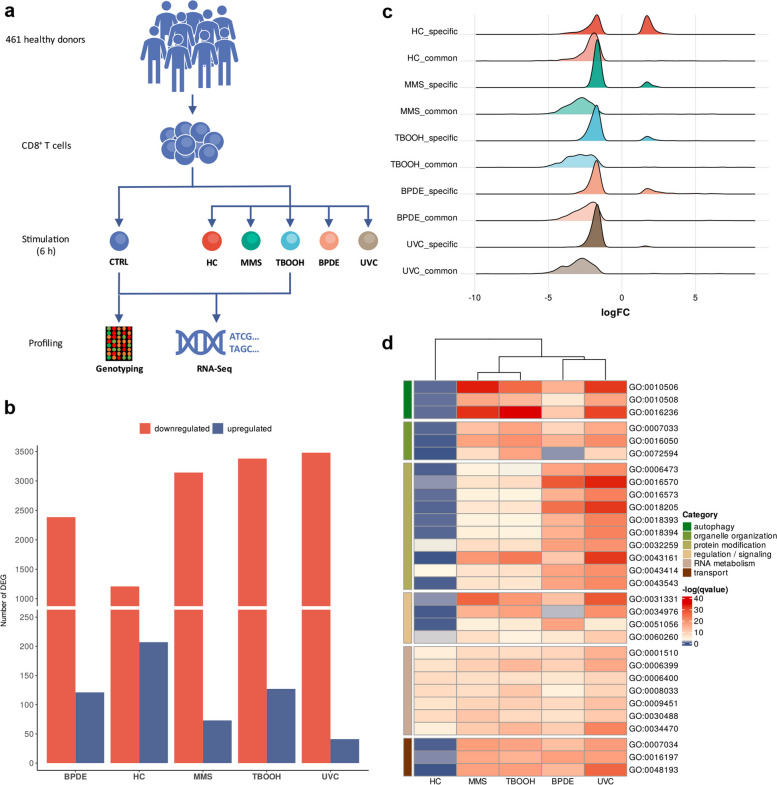
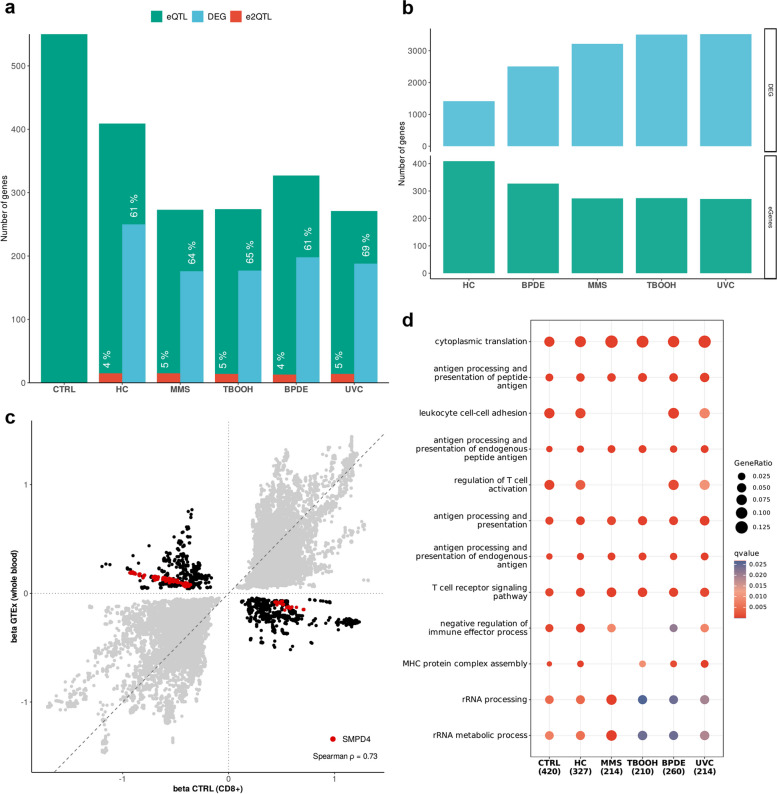
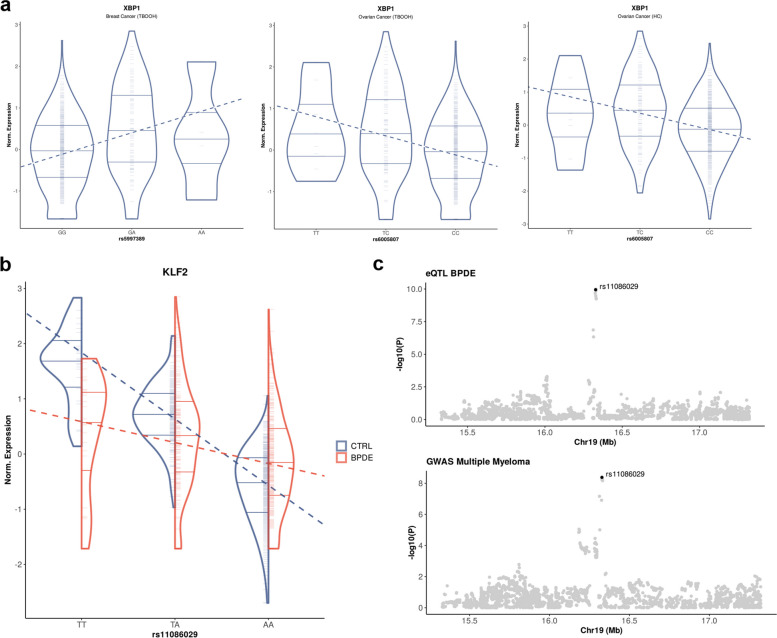
Results: We isolate CD8+ T cells from 461 healthy donors and stimulate them with high doses of 5 different carcinogens to identify regulatory mechanisms of DNA damage-induced apoptosis. Across all stimuli, we find 5,373 genes to be differentially expressed, with 85% to 99% of these genes being suppressed. While upregulated genes are specific to distinct stimuli, downregulated genes are shared across conditions but exhibit enrichment in biological processes depending on the DNA damage type. Analysis of eQTL reveals 654 regulated genes across conditions. Among them, 47 genes are significant e2QTL, representing a fraction of 4% to 5% per stimulus. To unveil disease relevant genetic variants, we compare eQTL and e2QTL with GWAS risk variants. We identify gene regulatory variants for KLF2, PIP4K2A, GPR160, RPS18, ARL17B and XBP1 that represent risk variants for oncological diseases.

Conclusion: Our study highlights the relevance of gene regulatory variants influencing DNA damage-induced apoptosis in cancer. The results provide new insights in cellular mechanisms and corresponding genes contributing to inter-individual effects in cancer development.

Keywords: Apoptosis; Cancer; DNA damage; GWAS; eQTL.


Conflict of interest statement

Declarations. Ethics approval and consent to participate: The study was approved by the ethics committee of the University of Marburg and complied with the Helsinki Declaration. All participants gave written informed consent. Consent for publication: Not applicable. Competing interests: The authors declare no competing interests.

Figures

Fig. 1
Fig. 1
Study setup and expression profiling of CD8+ T cells upon carcinogen treatment. a Overview of the study design. Blood samples from 461 healthy donors were used to isolate CD8+ T cells. Cells were either left untreated or stimulated with different carcinogens for 6 h. Expression analysis and genotype profiling were performed to identify regulatory variants. b Number of significantly downregulated (red) and upregulated (blue) genes (adj. p < 0.05 and abs(logFC) > 1.5) identified for each stimulus. c Distribution of the logFC for significant DEG (adj. p < 0.05 and abs(logFC) > 1.5) in each stimulus. Genes were classified as specific (significant only in one stimulus) and common genes (significant in two or more stimuli). d Clustered heatmap of significantly enriched GO terms for biological processes of downregulated genes. Hierarchical clustering was performed using complete-linkage clustering and Euclidean distances. BPDE—benzo(a)pyrene-7,8-diol-9,10-epoxide, HC—4-hydroxycyclophosphamide, MMS—Methyl-methanesulfonate, TBOOH—tert-butyl-hydroperoxide, UVC—ultraviolet radiation
Fig. 2
Fig. 2
Identification of eQTL and e2QTL in the context of DNA damage-induced apoptosis. a Number of eGenes with at least one significant eQTL separated by stimulus. The fraction of eGenes that are significant DEGs (blue) or significant e2QTL (red) is indicated. eQTL under unstimulated condition are referred to as control (CTRL). b Comparison of the number of significant DEGs (blue) and eGenes (green) for each stimulus. c Scatter plot of eQTL effect size beta for eQTL present in both GTEx whole blood and our untreated CD8+ T cell data (referred to as CTRL). eQTL with identical direction of effect size are shown in grey and eQTL with opposite effect size are shown in black. eQTL of SMPD4 are highlighted in red. d Enrichment analysis of eGenes for GO terms associated with biological processes separated by stimulus. The gene ratio is indicated by the size and the q-value by the color of dots. Numbers under each stimulus indicate the number of eGenes included in the analysis. eGenes under unstimulated condition are referred to as control (CTRL). BPDE—benzo(a)pyrene-7,8-diol-9,10-epoxide, HC—4-hydroxycyclophosphamide, MMS—Methyl-methanesulfonate, TBOOH—tert-butyl-hydroperoxide, UVC—ultraviolet radiation
Fig. 3
Fig. 3
Trait association of eQTL and e2QTL based on GWAS data. a Violin plots of the eQTL for XBP1 in breast cancer upon TBOOH treatment (1), ovarian cancer upon TBOOH treatment (2) and ovarian cancer upon HC treatment (3). Genomic variants on the x-axis represent GWAS lead variants for the corresponding trait. Individuals are indicated by small ticks and horizontal lines represent the median as well as the 25% and 75% quartiles in each violin. The dashed lines indicate the linear regression for the effect of the genotype on gene expression. b Violin plots of the e2QTL for KLF2 in untreated cells (CTRL, blue) and upon BPDE treatment (red). The genomic variant on the x-axis represents the GWAS lead variant for MM. c Regional association plots for common variants in our eQTL data upon BPDE treatment and the GWAS for MM. The lead variant of the MM GWAS is highlighted in black and annotated, respectively. BPDE—benzo(a)pyrene-7,8-diol-9,10-epoxide, HC—4-hydroxycyclophosphamide, MM – Multiple Myeloma, TBOOH—tert-butyl-hydroperoxide

Similar articles

References

    1. Harper JW, Elledge SJ. The DNA damage response: ten years after. Mol Cell. 2007;28:739–45. 10.1016/j.molcel.2007.11.015. - PubMed
    1. Jackson SP, Bartek J. The DNA-damage response in human biology and disease. Nature. 2009;461:1071–8. 10.1038/nature08467. - PMC - PubMed
    1. Ciccia A, Elledge SJ. The DNA damage response: making it safe to play with knives. Mol Cell. 2010;40:179–204. 10.1016/j.molcel.2010.09.019. - PMC - PubMed
    1. Hanahan D, Weinberg RA. Hallmarks of cancer: the next generation. Cell. 2011;144:646–74. 10.1016/j.cell.2011.02.013. - PubMed
    1. Bouwman P, Jonkers J. The effects of deregulated DNA damage signalling on cancer chemotherapy response and resistance. Nat Rev Cancer. 2012;12:587–98. 10.1038/nrc3342. - PubMed