. 2024 Dec 3;22(1):1095.
doi: 10.1186/s12967-024-05920-2.

Doxorubicin synergizes bortezomib-induced multiple myeloma cell death by inhibiting aggresome formation and augmenting endoplasmic reticulum/Golgi stress and apoptosis

Affiliations

Doxorubicin synergizes bortezomib-induced multiple myeloma cell death by inhibiting aggresome formation and augmenting endoplasmic reticulum/Golgi stress and apoptosis

Chang-Tze Ricky Yu et al. J Transl Med. .

Abstract

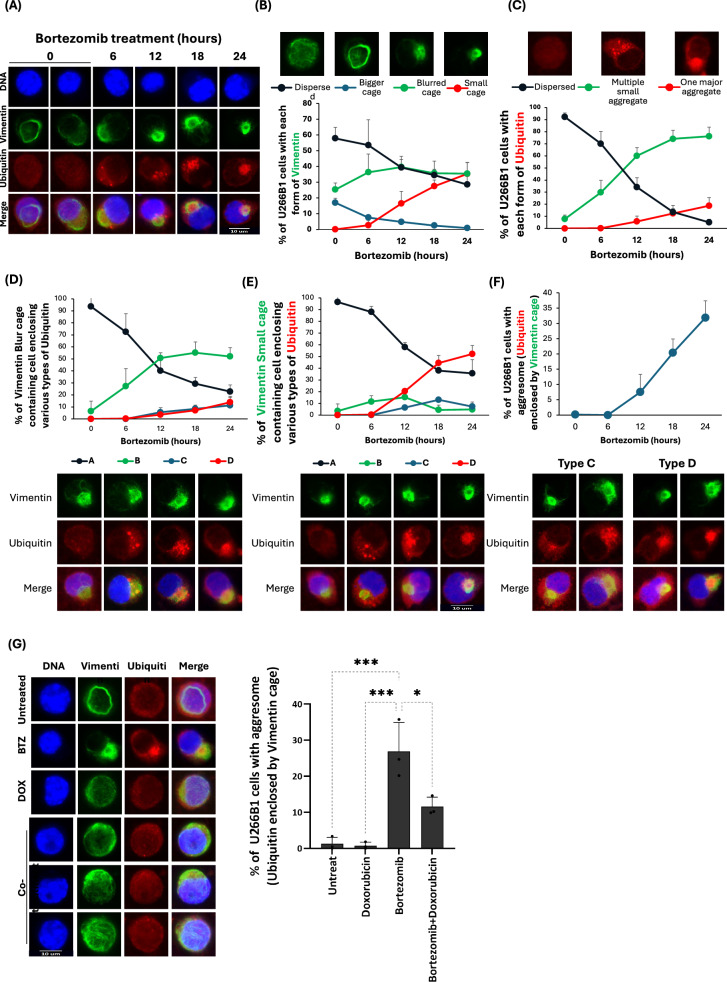
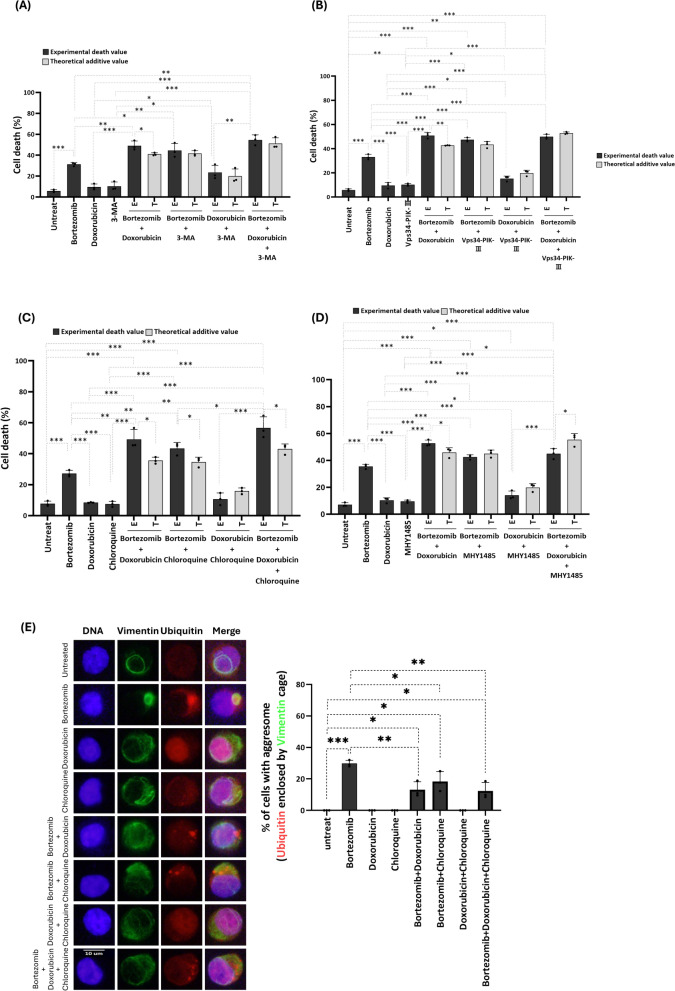
Background: Bortezomib is a standard treatment for multiple myeloma (MM), working by the accumulation of toxic misfolded proteins in cancer cells. However, a significant clinical challenge arises from the development of resistance to bortezomib in MM treatment. Aggresome, a subcellular structure enclosed within Vimentin, forms in response to proteasome inhibitors and sequesters misfolded proteins that are transported by histone deacetylase 6 (HDAC6) and Dynein for degradation via autophagy, thereby reducing bortezomib's cytotoxic effects. Therefore, in this study, we screened several anticancer agents to identify those that could synergize with bortezomib to enhance cell death and block aggresome formation in the MM cell line U266B1.

Methods: To enhance bortezomib's efficacy, we screened a range of anticancer compounds for their potential to promote cell death and inhibit aggresome formation in U266B1 MM cells. We utilized the trypan blue exclusion assay and immunofluorescence for evaluation, and explored the underlying mechanisms through Western blot analysis.

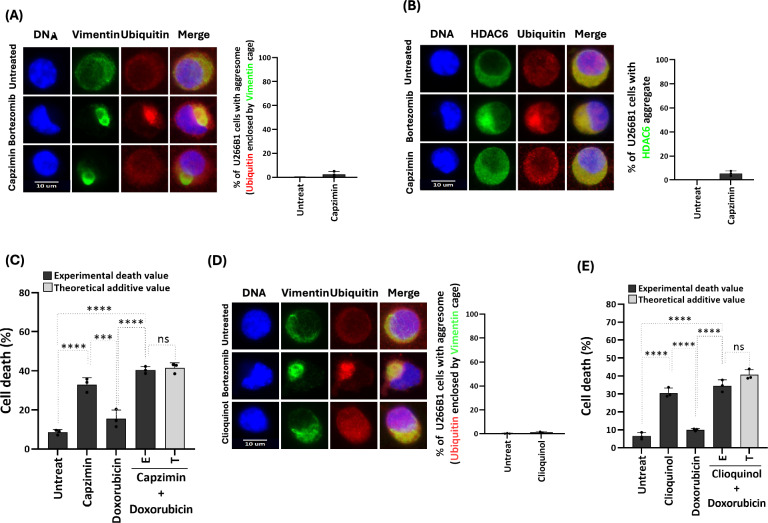
Results: Doxorubicin enhanced bortezomib-induced cytotoxicity while inhibiting aggresome formation. Mechanistic studies revealed that doxorubicin downregulated key aggresome components, including Vimentin, HDAC6, and Dynein, leading to accumulation of misfolded proteins and augmentation of proapoptotic and necroptotic pathways by intensifying endoplasmic reticulum (ER) and Golgi stress responses. Notably, doxorubicin did not enhance cell death triggered by proteasome inhibitors that do not induce aggresome formation. Furthermore, the combination of bortezomib and doxorubicin failed to produce synergy in the killing of MM cell lines that lacked aggresome-forming ability.

Conclusions: Doxorubicin enhances bortezomib-induced cell death in MM by inhibiting aggresome formation and amplifying ER/Golgi stress and apoptosis. This study highlights the potential therapeutic benefits of combining bortezomib with doxorubicin for MM treatment.

Keywords: Aggresome; Bortezomib; Doxorubicin; Golgi stress; Multiple myeloma.


Conflict of interest statement

Declarations. Ethics approval and consent to participate: Not applicable. Consent for publication: Not applicable. Competing interests: Chieh-Lin Jerry Teng received honorarium and consulting fees from Novartis, Roche, Pfizer, Takeda, Johnson and Johnson, Amgen, BMS Celgene, Kirin, TTY, and MSD. The other authors have no conflicts of interest.

Figures

Fig. 1
Fig. 1
Doxorubicin synergized with bortezomib to induce cell death in U266B1 cells. U266B1 cells were treated with either no compound, 6.25 nM Bortezomib, or one of the following compounds: 12.5 μg/ml Gemcitabine (A), 10 μM Alisertib (B), 10 μM Regorafenib (C), 20 μM EPZ015666 (D), 10 μM Lenalidomide (E), 10 μM Pomalidomide (F), 10 μM Dexamethasone (G), 1 μM Doxorubicin (H), or a combination of bortezomib with one of the listed compounds. After 24 h, trypan blue exclusion assays were conducted to assess cell death. At these concentrations, bortezomib induced 30–40% cell death, whereas each tested compound resulted in 10–20% cell death. The experimental death value (E) represents the observed cell death resulting from the combination treatment, whereas the theoretical additive value (T) represents the sum of cell death induced by each drug individually. Statistical significance was determined using one-way ANOVA followed by Tukey’s multiple comparison test, with p-values of < 0.05 (*), < 0.01 (**), < 0.001 (***), and < 0.0001 (****); ns indicates no significance. All experiments were performed independently three times
Fig. 2
Fig. 2
Doxorubicin blocks bortezomib-induced aggresome formation in U266B1 cells. AC Characterization of the formation of Vimentin cages and the aggregation of ubiquitinated misfolded proteins during aggresome formation. U266B1 cells were treated with 6.25 nM bortezomib for 0–24 h and analyzed by immunofluorescence to observe Vimentin and Ubiquitin (A). The percentage of cells with different forms of Vimentin (B) or Ubiquitin (C) was quantified and plotted. D, E Kinetics of Ubiquitin changes in cells with blurred or small Vimentin cages. U266B1 cells treated with 6.25 nM Bortezomib for 0–24 h were analyzed by immunofluorescence to observe Vimentin and Ubiquitin. The distribution of Ubiquitin in cells with blurred Vimentin cages (D) or small Vimentin cages (E) was quantified and plotted. Ubiquitin distribution was classified as: A, dispersed Ubiquitin; B, separated Ubiquitin particles; C, closely packed Ubiquitin particles; D, compact, clustered Ubiquitin. F Bortezomib stimulates aggresome formation in U266B1 cells. Cells were treated with 6.25 nM Bortezomib for 0–24 h, and immunofluorescence was used to observe Vimentin and Ubiquitin. Aggresomes were defined as Ubiquitin in type C or D, enclosed by blurred or small Vimentin cages. G Doxorubicin inhibits Bortezomib-induced aggresome formation. U266B1 cells were treated with no compound, 6.25 nM Bortezomib, 1 μΜ Doxorubicin, or the combination for 18 h, followed by immunofluorescence analysis for Vimentin and Ubiquitin. The percentage of cells with aggresomes, as defined in (F), was quantified and plotted. Statistical significance was determined by one-way ANOVA with Tukey’s multiple comparison test: *p < 0.05, ***p < 0.001. All experiments were performed independently three times. Scale bar: 10 μm
Fig. 3
Fig. 3
Doxorubicin downregulates Vimentin and various aggresome-promoting factors. U266B1 cells were treated with 6.25 nM bortezomib or a combination of 6.25 nM bortezomib and 1 μΜ doxorubicin, followed by Western blot analysis to assess the protein levels of key aggresome components, including Vimentin (a structural component of the aggresome), aggresome-promoting factors such as misfolded protein recognition proteins, motor proteins involved in misfolded protein transport, and aggresome clearance factors (A). The relative protein levels were quantified and plotted, with statistical significance indicated (B). Statistical significance was determined using t-tests, with *p < 0.05, **p < 0.01, and ***p < 0.001. All experiments were performed independently three times
Fig. 4
Fig. 4
Cotreatment with doxorubicin increases misfolded protein accumulation, enhances ER/Golgi stress responses and promotes apoptosis/necroptosis in bortezomib-treated cells. A Cotreatment with doxorubicin increases the level of ubiquitinated proteins in bortezomib-treated cells. U266B1 cells exposed to bortezomib or the combination of bortezomib and doxorubicin were analyzed for misfolded protein levels by Western blot using anti-ubiquitin antibodies. The relative protein levels were quantified and plotted with statistical significance. B Cotreatment with doxorubicin elevates the protein levels of factors that promote ER stress-dependent apoptosis in bortezomib-treated cells. U266B1 cells exposed to bortezomib or the combination were analyzed by Western blot for the levels of ER stress response regulators, including IRE1, pIRE-S724, GRP78, CHOP, ATF3, and ATF4. The relative protein levels were plotted with statistical significance. C Cotreatment with doxorubicin increases the protein levels of factors involved in Golgi stress-dependent apoptosis in bortezomib-treated cells. Western blot analysis was performed on U266B1 cells treated with bortezomib or the combination, focusing on Golgi stress response regulators such as ARF4, CREB3, ETS1, ETS2, and HSP47. The relative protein levels were quantified and plotted. D Cotreatment with doxorubicin enhances the levels of proapoptotic factors in Bortezomib-treated cells. U266B1 cells were analyzed by Western blot for proapoptotic factors such as Bad, pBad (S112), Bax, Bik, Bim, BID, Bak, and Puma. The relative protein levels were plotted with statistical significance. E Cotreatment with doxorubicin increases the levels of active caspases in bortezomib-treated cells. Western blot analysis was performed on U266B1 cells exposed to Bortezomib or the combination, measuring the levels of the proform and cleaved active forms of caspases 3, 6, 7, 9, and PARP. The relative protein levels were plotted with statistical significance. F Cotreatment with doxorubicin elevates the protein level of RIPK1, a key factor promoting necroptosis, in Bortezomib-treated cells. U266B1 cells were analyzed by Western blot for necroptosis regulators, including RIPK1, RIPK2, and RIPK3. The relative protein levels were quantified and plotted with statistical significance. Statistical significance was determined using t-tests, with *p < 0.05, **p < 0.01, and ***p < 0.001. All experiments were performed independently three times
Fig. 5
Fig. 5
Doxorubicin does not synergize with cell mortality triggered by proteasome inhibitors lacking aggresome-inducing activity. A Capzimin does not stimulate aggresome formation. U266B1 cells treated with no compound or 5 μΜ Capzimin for 24 h, which resulted in ~ 30% cell death, were analyzed for aggresome formation using immunofluorescence. The percentage of cells with aggresomes (Ubiquitin aggregates enclosed by Vimentin cages, as defined previously) was counted and plotted. 6.25 nM bortezomib was used as a positive control. B Confirmation of Capzimin’s inability to stimulate aggresome formation. U266B1 cells treated with no compound or 5 μΜ Capzimin for 24 h were analyzed by immunofluorescence using antibodies against Ubiquitin and HDAC6, which is responsible for recognizing and transporting misfolded proteins to the aggresome. The percentage of Capzimin-treated cells with HDAC6 aggregates was counted and plotted. 6.25 nM Bortezomib was used as a positive control, where Ubiquitin and HDAC6 colocalized, confirming HDAC6's role in recognizing and binding ubiquitinated misfolded proteins. C Capzimin does not synergize with Doxorubicin to enhance cell death. U266B1 cells treated with no chemical, 5 μΜ Capzimin, or Capzimin plus 1 μΜ doxorubicin for 24 h were analyzed for cell death using the trypan blue exclusion assay. The experimental death value (E) represents the observed cell death from the combined treatment, whereas the theoretical additive value (T) represents the sum of cell death induced by each drug alone. D Clioquinol does not stimulate aggresome formation. U266B1 cells treated with no compound, 6.25 nM bortezomib, or 25 μΜ Clioquinol for 24 h, which resulted in ~ 30% cell death, were analyzed for aggresome formation by immunofluorescence. The percentage of cells with aggresomes was counted and plotted. E Clioquinol does not synergize with Doxorubicin to enhance cell death. U266B1 cells treated with no chemical, 25 μΜ Clioquinol, or Clioquinol plus 1 μΜ doxorubicin for 24 h were analyzed for cell death using the trypan blue exclusion assay. The experimental death value (E) represents the observed cell death from the combined treatment, whereas the theoretical additive value (T) represents the sum of cell death induced by each drug alone. *** and **** indicate statistical significance based on one-way ANOVA with Tukey’s multiple comparison test with p < 0.001 and p < 0.0001, respectively. Ns indicates no significance. All experiments were performed independently three times. Scale bar: 10 μm
Fig. 6
Fig. 6
Doxorubicin does not synergize with bortezomib-induced cell mortality in multiple myeloma (MM) cells lacking aggresome-forming activity. A Aggresome formation status in several MM cell lines. U266B1, RPMI-8226, and NCI-H929 cells were treated with 6.25 nM bortezomib (U266B1 and RPMI-8226) or 1.5 nM Bortezomib (NCI-H929) for 18 h. The lower bortezomib dose in NCI-H929 cells was used owing to the high sensitivity of these cells to 6.25 nM bortezomib. Immunofluorescence was performed to detect aggresome formation, and the percentage of cells with Ubiquitin aggregates enclosed by a Vimentin cage was quantified and plotted. B Differential expression of Vimentin and HDAC6 in the three MM cell lines. U266B1, RPMI-8226, and NCI-H929 cells were analyzed by Western blot to determine the protein levels of Vimentin and HDAC6. The relative protein levels were quantified and plotted with statistical significance. C Differential sensitivity of the three cell lines to bortezomib. U266B1, RPMI-8226, and NCI-H929 cells were treated with 6.25 nM bortezomib for 24 h, and cell mortality was determined using the trypan blue exclusion assay. D Combined treatment with bortezomib and doxorubicin did not produce synergistic cell death in RPMI-8226 or NCI-H929 cells. RPMI-8226 (I) and NCI-H929 (II) cells were treated with 2.5 nM and 1.5 nM bortezomib, respectively, 0.5 μM and 0.25 μM doxorubicin, or the combination for 24 h, followed by an analysis of cell death using the trypan blue exclusion assay. Under these conditions, ~ 40% cell mortality was observed with bortezomib and ~ 20% with doxorubicin in both cell lines. The experimental death value (E) represents the observed cell death induced by the combined treatment, whereas the theoretical additive value (T) represents the sum of the cell death induced by each drug alone. Statistical analysis: B and C were analyzed using a t-test with **p < 0.01 and ***p < 0.001; (D) was analyzed using one-way ANOVA with Tukey’s multiple comparison test, with *p < 0.05 and **p < 0.01. ns indicates no significance. All experiments were performed independently three times. Scale bar: 10 μm
Fig. 7
Fig. 7
Autophagy inhibitors do not further enhance the drug synergy between bortezomib and doxorubicin. AD U266B1 cells were treated with either no compound, 6.25 nM bortezomib, 1 μM doxorubicin, or one of the following autophagy inhibitors: 2 mM 3-MA (A), 1 μM Vps34-PIK-III (B), 20 μM Chloroquine (C), or 2.5 μM MHY1485 (D), or combinations of two or three compounds. After 24 h, trypan blue exclusion assays were performed to assess cell death. The experimental death value (E) represents the observed cell death induced by the combined treatment, whereas the theoretical additive value (T) represents the sum of cell death induced by each drug individually. E Chloroquine inhibits bortezomib-induced aggresome formation but does not further enhance doxorubicin-mediated inhibition of aggresome formation. U266B1 cells treated with no compound, 6.25 nM Bortezomib, 1 μM Doxorubicin, 20 μM Chloroquine, or combinations of two or three compounds were analyzed for aggresome formation. The percentage of cells with aggresomes was counted and plotted. Statistical significance was determined by t-tests, with *p < 0.05, **p < 0.01, and ***p < 0.001. All experiments were performed independently three times. Scale bar: 10 μm

References

    1. Gomes CM. Protein misfolding in disease and small molecule therapies. Curr Top Med Chem. 2012;12(22):2460–9. - PubMed
    1. Winklhofer KF, Tatzelt J, Haass C. The two faces of protein misfolding: gain- and loss-of-function in neurodegenerative diseases. EMBO J. 2008;27(2):336–49. - PMC - PubMed
    1. Coyne LP, Chen XJ. Consequences of inner mitochondrial membrane protein misfolding. Mitochondrion. 2019;49:46–55. - PMC - PubMed
    1. Cheng B, Li Y, Ma L, Wang Z, Petersen RB, Zheng L, et al. Interaction between amyloidogenic proteins and biomembranes in protein misfolding diseases: mechanisms, contributors, and therapy. Biochim Biophys Acta Biomembr. 2018;1860(9):1876–88. - PubMed
    1. Liang G, Lian C, Huang D, Gao W, Liang A, Peng Y, et al. Endoplasmic reticulum stress-unfolding protein response-apoptosis cascade causes chondrodysplasia in a col2a1 pGly1170Ser mutated mouse model. PLoS ONE. 2014;9(1): e86894. - PMC - PubMed

MeSH terms

LinkOut - more resources