. 2024 Dec 2;39(46):e292.
doi: 10.3346/jkms.2024.39.e292.

Global, Regional, and National Trends in Liver Disease-Related Mortality Across 112 Countries From 1990 to 2021, With Projections to 2050: Comprehensive Analysis of the WHO Mortality Database

Affiliations

Global, Regional, and National Trends in Liver Disease-Related Mortality Across 112 Countries From 1990 to 2021, With Projections to 2050: Comprehensive Analysis of the WHO Mortality Database

Jong Woo Hahn et al. J Korean Med Sci. .

Abstract

Background: Liver disease causes over two million deaths annually worldwide, comprising approximately 4% of all global fatalities. We aimed to analyze liver disease-related mortality trends from 1990 to 2021 using the World Health Organization (WHO) Mortality Database and forecast global liver disease-related mortality rates up to 2050.

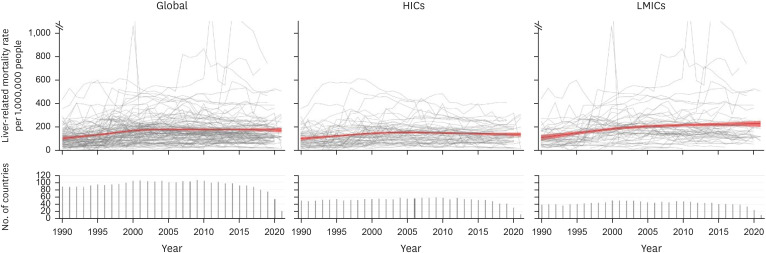
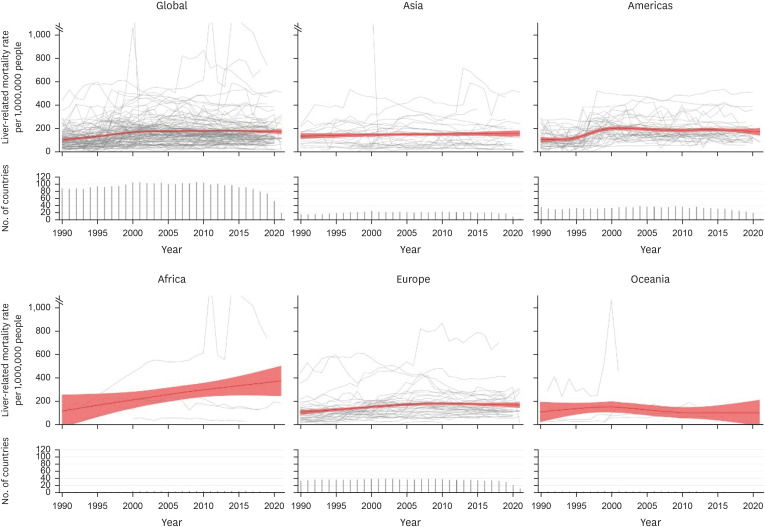
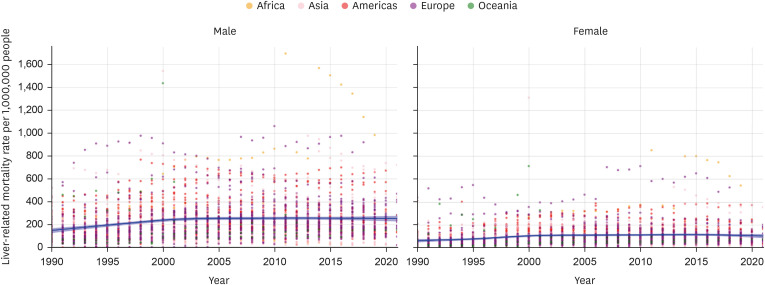
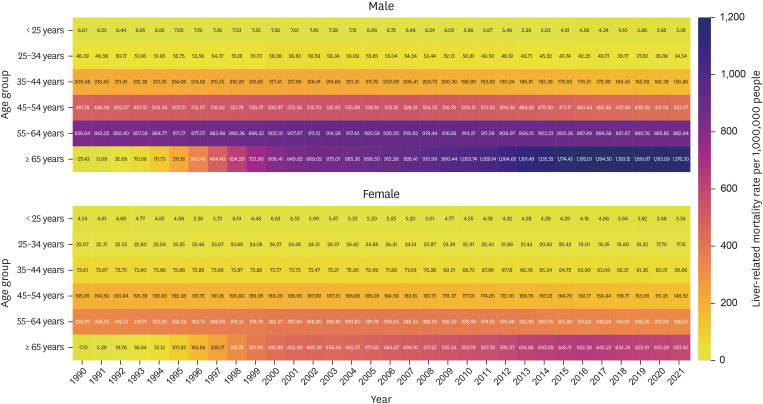
Methods: This study examined age-standardized liver disease-related death rates from 1990 to 2021, employing data from the WHO Mortality Database across 112 countries across five continents. The rates over time were calculated using a locally weighted scatter plot smoother curve, with weights assigned based on the population of each country. Furthermore, this study projected liver disease-related mortality rates up to 2050 using a Bayesian age-period-cohort (BAPC) model. Additionally, a decomposition analysis was conducted to discern influencing factors such as population growth, aging, and epidemiological changes.

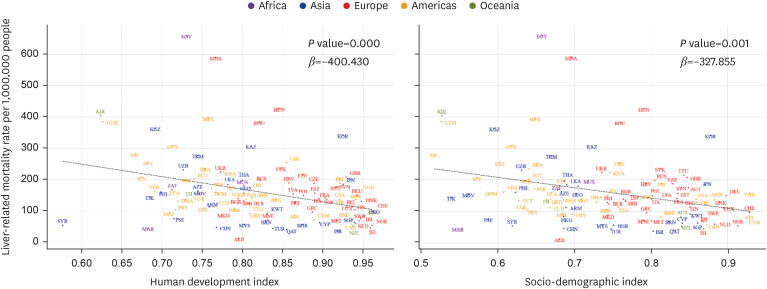
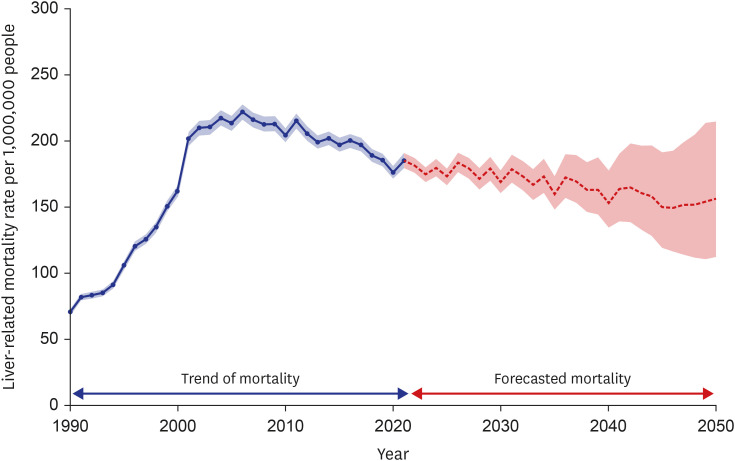
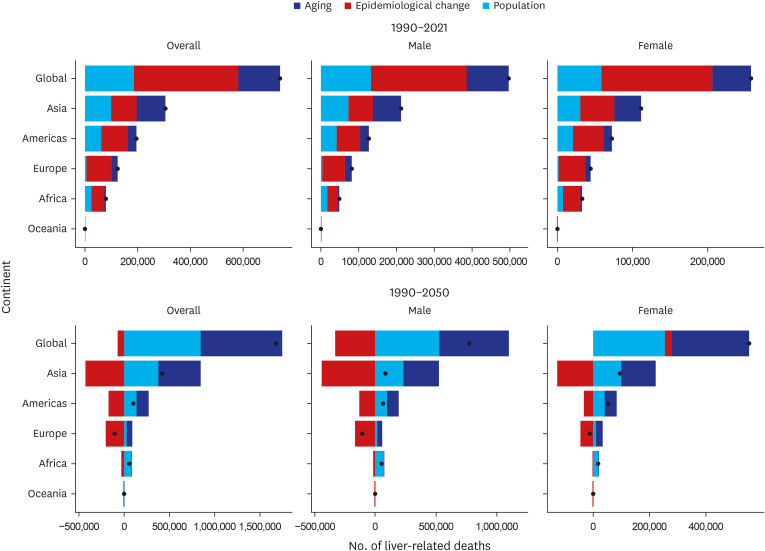
Results: The estimated global age-standardized liver disease-related mortality rates surged significantly from 1990 to 2021 across 112 countries, rising from 103.4 deaths per 1,000,000 people (95% confidence interval [CI], 88.16, 118.74) in 1990 to 173.0 deaths per 1,000,000 people (95% CI, 155.15, 190.95) in 2021. This upward trend was particularly pronounced in low- and middle-income countries, in Africa, and in populations aged 65 years and older. Moreover, age-standardized liver disease-related mortality rates were correlated with a lower Human Development Index (P < 0.001) and sociodemographic index (P = 0.001). According to the BAPC model, the projected trend indicated a sustained and substantial decline in liver disease-related mortality rates, with an estimated decrease from 185.08 deaths per 1,000,000 people (95% CI, 179.79, 190.63) in 2021 to 156.29 (112.32, 214.77) in 2050. From 1990 to 2021, age-standardized liver disease-related deaths surged primarily due to epidemiological changes, whereas from 1990 to 2050, the impact of population aging and growth became the primary contributing factors to the overall increase.

Conclusion: Global age-standardized liver disease-related mortality has increased significantly and continues to emerge as a crucial global public health issue. Further investigation into liver disease-related mortality rates in Africa is needed, and updating policies is necessary to effectively manage the global burden of liver disease.

Keywords: Global Trend; Liver Disease; Mortality; Prediction Model; WHO Mortality Database.


Conflict of interest statement

The authors have no potential conflicts of interest to disclose.

Figures

Fig. 1
Fig. 1. Age-standardized liver-related mortality rates for the global, HICs, and LMICs population among 112 countries for the years 1990–2021. The LOESS mortality rates with 95% confidence levels, weighted by country population, are shown in red. HICs included 59 countries, including Anguilla, Antigua and Barbuda, Aruba, Australia, Austria, Bahamas, Bahrain, Barbados, Belgium, Bermuda, British Virgin Islands, Brunei Darussalam, Canada, Cayman Islands, Chile, Croatia, Cyprus, Czech Republic, Denmark, Estonia, Finland, France, Germany, Greece, Guyana, Hong Kong SAR, Hungary, Iceland, Ireland, Israel, Italy, Japan, Kuwait, Latvia, Lithuania, Luxembourg, Malta, Netherlands, New Zealand, Norway, Panama, Poland, Portugal, Puerto Rico, Qatar, Republic of Korea, Romania, Saint Kitts and Nevis, Singapore, Slovakia, Slovenia, Spain, Sweden, Switzerland, Trinidad and Tobago, United Kingdom, United States of America, Uruguay, and Virgin Islands (USA). LMICs included 53 countries, including Albania, Argentina, Armenia, Azerbaijan, Belarus, Belize, Brazil, Bulgaria, China, Colombia, Costa Rica, Cuba, Dominica, Dominican Republic, Ecuador, Egypt, El Salvador, Fiji, Georgia, Grenada, Guatemala, Jamaica, Kazakhstan, Kiribati, Kyrgyzstan, Malaysia, Maldives, Mauritius, Mexico, Montenegro, Morocco, Nicaragua, North Macedonia, Occupied Palestinian Territory, Paraguay, Peru, Philippines, Republic of Moldova, Russian Federation, Saint Lucia, Saint Vincent and the Grenadines, Serbia, South Africa, Sri Lanka, Suriname, Syrian Arab Republic, Tajikistan, Thailand, Turkey, Turkmenistan, Ukraine, Uzbekistan, and Venezuela.
HIC = high-income country, LMIC = low- and middle-income country, LOESS = locally weighted scatterplot smoother.
Fig. 2
Fig. 2. Age-standardized liver-related mortality rates across the globe and five continents among 112 countries. The LOESS mortality rates with 95% confidence levels, weighted by country population, are shown in red. Africa includes 4 countries: Egypt, Mauritius, Morocco, and South Africa. Asia includes 27 countries: Armenia, Azerbaijan, Bahrain, Brunei, Darussalam, China, Cyprus, Georgia, Hong Kong SAR, Israel, Japan, Kazakhstan, Kuwait, Kyrgyzstan, Malaysia, Maldives, Occupied Palestinian Territory, Philippines, Qatar, Republic of Korea, Singapore, Sri Lanka, Syrian Arab Republic, Tajikistan, Thailand, Turkey, Turkmenistan, and Uzbekistan. Americas includes the 39 countries, including Anguilla, Antigua and Barbuda, Argentina, Aruba, Bahamas, Barbados, Belize, Bermuda, Brazil, British Virgin Islands, Canada, Cayman Islands, Chile, Colombia, Costa Rica, Cuba, Dominica, Dominican Republic, Ecuador, El Salvador, Grenada, Guatemala, Guyana, Jamaica, Mexico, Nicaragua, Panama, Paraguay, Peru, Puerto Rico, Saint Kitts and Nevis, Saint Lucia, Saint Vincent and Grenadines, Suriname, Trinidad and Tobago, United States of America, Virgin Islands (USA), Uruguay, and Venezuela. Europe includes 38 countries: Albania, Austria, Belgium, Bulgaria, Croatia, the Czech Republic, Denmark, Estonia, Finland, France, Germany, Greece, Hungary, Iceland, Ireland, Italy, Latvia, Lithuania, Luxembourg, Malta, Montenegro, Netherlands, North Macedonia, Norway, Poland, Portugal, the Republic of Moldova, Romania, Russian Federation, Serbia, Slovakia, Slovenia, Spain, Sweden, Switzerland, Ukraine, and the United Kingdom. Oceania includes 4 countries: including Australia, Fiji, Kiribati, and New Zealand.
LOESS = locally weighted scatterplot smoother.
Fig. 3
Fig. 3. Age-standardized liver-related mortality rates for the global population by sex among 112 countries, 1990–2021. The LOESS mortality rates with 95% confidence levels, weighted by country population, are shown in blue. Africa includes 4 countries: Egypt, Mauritius, Morocco, and South Africa. Asia includes 27 countries: Armenia, Azerbaijan, Bahrain, Brunei, Darussalam, China, Cyprus, Georgia, Hong Kong SAR, Israel, Japan, Kazakhstan, Kuwait, Kyrgyzstan, Malaysia, Maldives, Occupied Palestinian Territory, Philippines, Qatar, Republic of Korea, Singapore, Sri Lanka, Syrian Arab Republic, Tajikistan, Thailand, Turkey, Turkmenistan, and Uzbekistan. Americas includes the 39 countries, including Anguilla, Antigua and Barbuda, Argentina, Aruba, Bahamas, Barbados, Belize, Bermuda, Brazil, British Virgin Islands, Canada, Cayman Islands, Chile, Colombia, Costa Rica, Cuba, Dominica, Dominican Republic, Ecuador, El Salvador, Grenada, Guatemala, Guyana, Jamaica, Mexico, Nicaragua, Panama, Paraguay, Peru, Puerto Rico, Saint Kitts and Nevis, Saint Lucia, Saint Vincent and Grenadines, Suriname, Trinidad and Tobago, United States of America, Virgin Islands (USA), Uruguay, and Venezuela. Europe includes 38 countries: Albania, Austria, Belgium, Bulgaria, Croatia, the Czech Republic, Denmark, Estonia, Finland, France, Germany, Greece, Hungary, Iceland, Ireland, Italy, Latvia, Lithuania, Luxembourg, Malta, Montenegro, Netherlands, North Macedonia, Norway, Poland, Portugal, the Republic of Moldova, Romania, Russian Federation, Serbia, Slovakia, Slovenia, Spain, Sweden, Switzerland, Ukraine, and the United Kingdom. Oceania includes 4 countries: including Australia, Fiji, Kiribati, and New Zealand.
LOESS = locally weighted scatterplot smoother.
Fig. 4
Fig. 4. LOESS smoothed liver-related mortality rates by sex and age group among 112 countries, 1990–2021.
LOESS = locally weighted scatter plot smoother.
Fig. 5
Fig. 5. Correlation between age-standardized liver-related mortality rates and Human Development Index, Socio-demographic Index, and Gender Gap Index.
Fig. 6
Fig. 6. Projections in age-standardized liver-related mortality rates from 1990 to 2050 by Bayesian age-period-cohort models. The dashed line represents the Bayesian age-period-cohort value for forecasted mortality, whereas the shaded area represents the 95% credible intervals.
Fig. 7
Fig. 7. Changes in the number of liver-related deaths associated with aging, epidemiological change, and population from 1990 to 2021 and 1990 to 2050 by sex and income level. The dots represent the integrated outcomes of the three factors: aging, epidemiological change, and population.

References

    1. Devarbhavi H, Asrani SK, Arab JP, Nartey YA, Pose E, Kamath PS. Global burden of liver disease: 2023 update. J Hepatol. 2023;79(2):516–537. - PubMed
    1. Younossi ZM, Wong G, Anstee QM, Henry L. The global burden of liver disease. Clin Gastroenterol Hepatol. 2023;21(8):1978–1991. - PubMed
    1. Ayyala-Somayajula D, Dodge JL, Farias A, Terrault N, Lee BP. Healthcare affordability and effects on mortality among adults with liver disease from 2004 to 2018 in the United States. J Hepatol. 2023;79(2):329–339. - PMC - PubMed
    1. Easterbrook P, Luhmann N, Newman M, Walsh N, Lesi O, Doherty M. New WHO guidance for country validation of viral hepatitis B and C elimination. Lancet Gastroenterol Hepatol. 2021;6(10):778–780. - PubMed
    1. GBD 2019 Hepatitis B Collaborators. Global, regional, and national burden of hepatitis B, 1990–2019: a systematic analysis for the Global Burden of Disease Study 2019. Lancet Gastroenterol Hepatol. 2022;7(9):796–829. - PMC - PubMed