. 2024 Dec 2;22(4):15593258241303646.
doi: 10.1177/15593258241303646. eCollection 2024 Oct-Dec.

Valproic Acid Inhibits Endoplasmic Reticulum Stress and Reduces Ferroptosis After Traumatic Brain Injury

Affiliations

Valproic Acid Inhibits Endoplasmic Reticulum Stress and Reduces Ferroptosis After Traumatic Brain Injury

Jie Chen et al. Dose Response. .

Abstract

Backgound: Traumatic brain injury (TBI) is a severe neurological disorders, which invloving complicated molecular mechanisms, such as endoplasmic reticulum (ER) stress and ferroptosis. , However, the mechanism underlying TBI remains unclear.

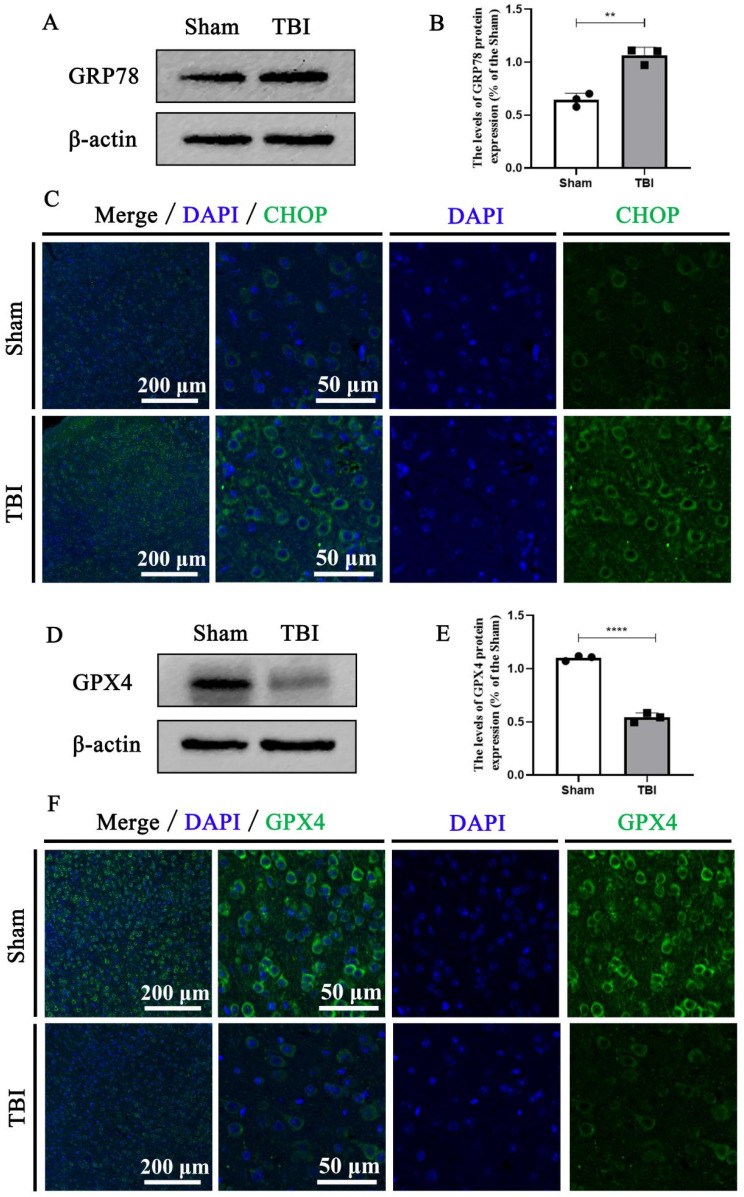
Objectives: The Objective was to determine the effect of VPA on ER stress and ferroptosis, and affirm the relationship between ER stress and ferroptosis. Methods: The expression levels of GRP78, ATF6, CHOP and GPX4 in brain tissues were detected via western blot, histological staining, and immunofluorescence. The effect of VPA on ER stress and ferroptosis on OS cellswas evaluated in vitro and in vivo.

Results: In our study, we found that VPA suppressed ER stress after TBI by inhibiting the GRP78-ATF6-CHOP signaling pathway, which ameliorated ferroptosis by reversing the reduction of the ferroptosis protein GPX4. Furthermore, tissue defects, bleeding, and iron accumulation also reduced. Moreover, 4-phenylbutyric acid was used to further confirm our assumption.

Conclusion: VPA plays a neuroprotective role by inhibiting ER stress levels and subsequently inhibiting ferroptosis.

Keywords: endoplasmic reticulum; ferroptosis; traumatic brain injury; valproic acid.


Conflict of interest statement

The author(s) declared no potential conflicts of interest with respect to the research, authorship, and/or publication of this article.

Figures

Figure 1.
Figure 1.
Experimental scheme for VPA administration after TBI. (A) Time diagram of brain injury, drug administration, and experimental detection in C57BL/6 male mice. VPA, valproic acid; 4-PBA, 4-Phenylbutyric Acid; TBI, traumatic brain injury. (B) Schematic diagram of TBI modeling operation.
Figure 2.
Figure 2.
VPA treatment alleviates nerve damage and inhibits iron accumulation during the acute phase of TBI. (A) Representative images of Hematoxylin-Eosin (HE) staining of the brain tissues at 3 dpi (10 × ), scale bar = 100 μm. (B) Representative images of Nissl staining of the brain tissues (10 × ) at 3 dpi, scale bar = 100 μm. (C) Representative images of Prussian Blue Iron Staining of the brain tissues (40 × ); arrows indicate the occurrence of iron-accumulation at 3 dpi, scale bar = 50 μm. (D) Quantitative analysis of the number of nissl bodies in (B), n = 3;TBI group vs VPA group: ***P < 0.001, TBI group vs 4-PBA group: **P < 0.01.
Figure 3.
Figure 3.
Relative activation of ER stress and upregulated expression of ferroptosis-related proteins after TBI. (A) Representative western blotting images of GRP78 expression level at 3 dpi. (B) Quantification of GRP78 expression in (A), n = 3, sham group vs TBI group: **P < 0.01. (C) Representative immunofluorescence staining images of CHOP (green) expression level at 3 dpi, scale bar = 50 μm or 200 μm. (D) Representative western blotting images of GPX4 expression level at 3 dpi. (E) Quantification of GPX4 expression in (D), n = 3, sham group vs TBI group: ****P < 0.0001. (F) Representative immunofluorescence staining images of GRP78 (green) expression level at 3 dpi, scale bar = 50 μm or 200 μm.
Figure 4.
Figure 4.
VPA attenuated the activation of ER stress after TBI by downregulating the expression of GRP78, ATF6, and CHOP proteins. (A) Representative western blotting images of ATF6, GRP78 and CHOP expression level in the 3 days post-TBI. (B) Quantification of ATF6 expression in (A), n = 3, sham group vs TBI group: ***P < 0.001; TBI group vs VPA group:*P < 0.05; TBI group vs 4-PBA group: **P < 0.01. (C) Quantification of GRP78 expression in (A), n = 4, sham group vs TBI group: ***P < 0.001; TBI group vs VPA group: *P < 0.05; TBI group vs 4-PBA group: **P < 0.01. (D) Quantification of CHOP expression in (A), n = 3, sham group vs TBI group: ***P < 0.001; TBI group vs VPA group: ***P < 0.001; TBI group vs 4-PBA group: ****P < 0.0001. (E) Representative immunofluorescence staining images of CHOP (green) expression level in the 3 days post-TBI, scale bar = 50 μm or 200 μm.
Figure 5.
Figure 5.
VPA inhibited the relative activation of ferroptosis after TBI. (A) Representative western blotting images of GPX4 expression level in the 3 days post-TBI. (B) Quantification of GPX4 expression in (A), n = 5, sham group vs TBI group: ****P < 0.0001; TBI group vs VPA group: ***P < 0.001; TBI group vs 4-PBA group: *P < 0.05. (C) Representative immunofluorescence staining images of GPX4 (green) expression level in the 3 days post-TBI, scale bar = 50 μm or 200 μm.
Figure 6.
Figure 6.
VPA suppressed TBHP-induced ER stress and ferroptosis levels in SH-SY5Y cells. (A) Representative western blotting images of GRP78, ATF6, CHOP and GPX4 expression level in the SH-SY5Y cell. (B) Quantification of GRP78 expression in (A), n = 4, con group vs TBHP group: ***P < 0.001; TBHP group vs VPA group: *P < 0.05. (C) Quantification of ATF6 expression in (A), n = 3, con group vs TBHP group: **P < 0.01; TBHP group vs VPA group: **P < 0.01. (D) Quantification of CHOP expression in (A), n = 3, con group vs TBHP group: **P < 0.01; TBHP group vs VPA group:*P < 0.01. (E) Quantification of GPX4 expression in (A), n = 3, con group vs TBHP group: ***P < 0.001; TBHP group vs VPA group: **P < 0.01. (F) Representative immunofluorescence staining images of CHOP (green) expression level in SH-SY5Y cell, scale bar = 60 μm. (G) Representative immunofluorescence staining images of GPX4 (green) expression level in the HT-22 cell, scale bar = 60 μm.
Figure 7.
Figure 7.
Inhibition of ER stress activity levels reserved the upregulated expression of ferroptosis induced by erastin in HT-22 cell lines. (A) Representative western blotting images of GPX4 expression level in the HT-22 cell. (B) Quantification of GPX4 expression in (A), n = 3, con group vs Erastin group: **P < 0.01; Erastin group vs VPA group: *P < 0.05; Erastin group vs 4-PBA group: *P < 0.05. (C) Representative immunofluorescence staining images of GPX4 (green) expression level in the HT-22 cell, scale bar = 60 μm.
Figure 8.
Figure 8.
Graphical abstract of the mechanisms of VPA on ER stress and ferroptosis after TBI.

Similar articles

Cited by

References

    1. Dewan MC, Rattani A, Gupta S, et al. Estimating the global incidence of traumatic brain injury. J Neurosurg. 2018;5:1-18. doi:10.3171/2017.10.JNS17352 - DOI - PubMed
    1. Mayer CL, Huber BR, Peskind E. Traumatic brain injury, neuroinflammation, and post-traumatic headaches. Headache. 2013;53(9):1523-1530. doi:10.1111/head.12173 - DOI - PMC - PubMed
    1. Katz PS, Sulzer JK, Impastato RA, Teng SX, Rogers EK, Molina PE. Endocannabinoid degradation inhibition improves neurobehavioral function, blood-brain barrier integrity, and neuroinflammation following mild traumatic brain injury. J Neurotrauma. 2015;32(5):297-306. doi:10.1089/neu.2014.3508 - DOI - PMC - PubMed
    1. Ma MW, Wang J, Zhang Q, et al. NADPH oxidase in brain injury and neurodegenerative disorders. Mol Neurodegener. 2017;12(1):7. doi:10.1186/s13024-017-0150-7 - DOI - PMC - PubMed
    1. Xu Z, Lv XA, Dai Q, Ge YQ, Xu J. Acute upregulation of neuronal mitochondrial type-1 cannabinoid receptor and it's role in metabolic defects and neuronal apoptosis after TBI. Mol Brain. 2016;9(1):75. doi:10.1186/s13041-016-0257-8 - DOI - PMC - PubMed

LinkOut - more resources