. 2025 Jan 8;6(1):55-72.
doi: 10.1158/2643-3230.BCD-23-0258.

CD33-CD123 IF-THEN Gating Reduces Toxicity while Enhancing the Specificity and Memory Phenotype of AML-Targeting CAR-T Cells

Affiliations

CD33-CD123 IF-THEN Gating Reduces Toxicity while Enhancing the Specificity and Memory Phenotype of AML-Targeting CAR-T Cells

Samy Jambon et al. Blood Cancer Discov. .

Abstract

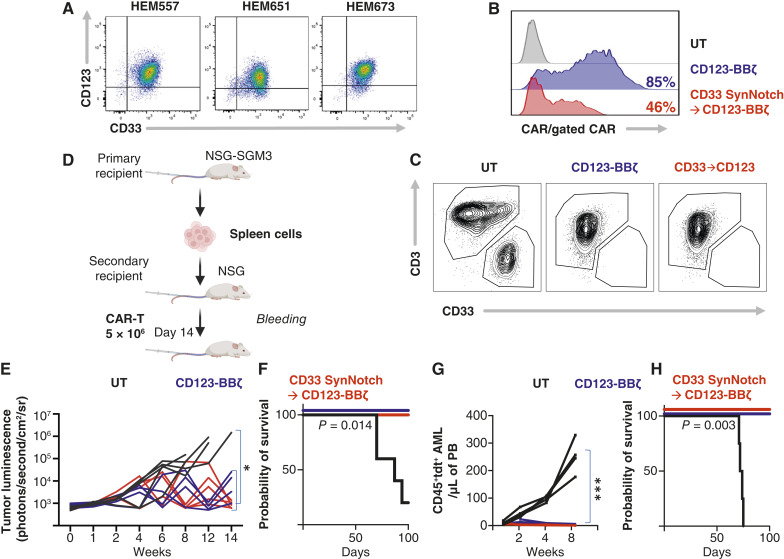
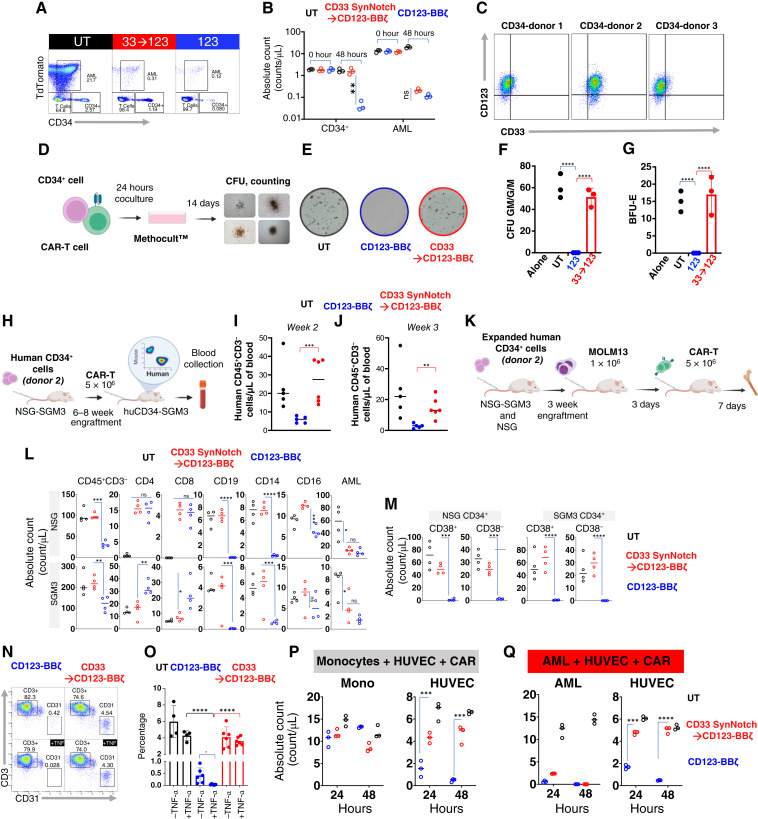
Our study demonstrates the use of "IF-THEN" SynNotch-gated CAR-T cells targeting CD33 and CD123 in AML reduces off-tumor toxicity. This strategy enhances T-cell phenotype, improves expansion, preserves HSPCs, and mitigates cytokine release syndrome-addressing critical limitations of existing AML CAR-T therapies.


Conflict of interest statement

B.L. Wood reports personal fees from Amgen outside the submitted work, and reports that his laboratory performs contract research testing to support clinical trials for the following biopharma companies: Novartis, Amgen, BioSight, Wugen, and Beam. A.S. Wayne reports other support from Kite, a Gilead company, outside the submitted work. M.A. Pulsipher reports personal fees from CARGO Therapeutics, Garuda, Autolus, Pfizer, Novartis, GentiBio, bluebird bio, Vertex, Medexus, and Equillium and nonfinancial support from Adaptive and Miltenyi outside the submitted work. Y.-M. Kim reports nonfinancial support and other support from OncoSynergy outside the submitted work. C. Parekh reports a patent for BCL11B Overexpression to Enhance Human Thymopoiesis and T-cell Function, PCT/US20/39414 (PCT application filed, June 24, 2020) pending and licensed to Pluto Immunotherapeutics Inc.; ownership of Amgen stock by his spouse; ownership of equity in Pluto Immunotherapeutics Inc.; and receiving royalty payments from Pluto for technology licensed to Pluto. B. Moghimi reports grants from Hyundai Hope On Wheels Foundation, Couples Against Leukemia Foundation, St. Baldrick’s Foundation, CureSearch for Children’s Cancer Foundation, The Saban Research Institute at Children’s Hospital Los Angeles, and University of Southern California during the conduct of the study. No disclosures were reported by the other authors.

Figures

Figure 1.
Figure 1.
AML can be targeted using SynNotch CAR-T cells. A, Primary human T cells were engineered with CD33-sensing SynNotch with genetic circuit encoding for CD123 CAR. B, Growth kinetics of GFP+ AML cell lines (MOLM13, THP1, and KG1) cocultured with indicated T cells. Untransduced T (UT) cells were used as control. C, Cytokine levels were measured by ELISA in the supernatants of T cells expressing the specified constructs after 48 hours of coculture with the MOML13 AML cell line at a 1:1 E:T ratio. D–I, NSG mice were injected with 1 million luciferase-expressing MOLM13 or KG1 cells and, a week later, with 10 million of the indicated T cells. Surviving mice were followed for a minimum of 100 days after tumor inoculation. D and E, Quantified bioluminescence intensity of the mice. F and G, Mouse survival plotted by Kaplan–Meier graph. H and I, Human CD3 T-cell counts in peripheral blood (PB) 2 weeks after CAR-T infusion. B, At least two independent experiments. Data are means ± SEM. D and E, UT (n = 5 and 3), CD123 (n = 5 and 4), and CD33→CD123 (n = 5 and 4). Statistics were calculated using the unpaired Mann–Whitney t test (F and G) and Student t test (C, H, and I) *, P ≤ 0.05; **, P ≤ 0.01; ***, P ≤ 0.001; ****, P ≤ 0.0001. GFP, green fluorescent protein.
Figure 2.
Figure 2.
CD33→CD123 SynNotch-gated CAR-T cells are effective against patient-derived AML disease. A, Color dot plot measuring CD123 and CD33 expression on three AML PDX samples. B, A representative histogram shows CAR expression on CAR-T cells engineered from patient with AML samples, detected with His-tagged CD123 for the CD123 CAR and His-tagged CD33 for the CD33→CD123 uniframe CAR. C, Representative contour plot of AML PDX sample cocultured with indicated patient’s autologous T cells. D, PDX AML samples were passaged in NSG-SGM3 before implantation into NSG mice and treatment with CAR-T cells. E, Spaghetti plot shows the bioluminescence of individual PDX1Luc+ mice treated with the indicated T cells. F, Mouse survival plotted by Kaplan–Meier graph from (E). G, AML detected in the peripheral blood (PB) of PDX2Tdtomato+ mice treated with the indicated T cells, assessed by flow cytometry. H, Mouse survival plotted by Kaplan–Meier graph from (G). Statistics were calculated using two-way ANOVA (E and G) and unpaired Mann–Whitney t test (F and H). E and G, UT (n = 5 and 4), CD123 (n = 4 and 5), and CD33→CD123 (n = 4 and 5). *, P ≤ 0.05; **, P ≤ 0.01; ***, P ≤ 0.001. UT, untransduced T cell.
Figure 3.
Figure 3.
CD33→CD123 SynNotch-gated CAR-T cells exhibit favorable phenotype. A, Representative histogram of basal NFAT reporter activation in Jurkat cells transduced with the specified CAR at an MOI of 60 per cell, sorted for CD123 CAR or CD33 SynNotch, and selected with drugs for NFAT reporter. B, Summary data representing two individual donors’ antigen-independent expansion kinetics of indicated T cells (IL-2 only). C, Gating strategy for immunophenotyping T cells. D, Pseudocolor plot showing the immunophenotype of sorted CAR-T cells engineered from a single donor. E, Proportions of TN/SCM and TEM CD4+ and CD8+ T cells from three donors, engineered to express the specified CAR 14 days after CD3/CD28 Dynabead stimulation. F, Histogram showing the expression of exhaustion markers in T cells from (E). G, Cumulative analysis of exhaustion marker expression in T cells from (E). Statistics were calculated using two-way ANOVA (B) and Mann–Whitney U tests (E). *, P ≤ 0.05; **, P ≤ 0.01; ***, P ≤ 0.001. ns, not significant; TEMRA, terminal effector memory T cells; UT, untransduced T cell.
Figure 4.
Figure 4.
SynNotch-gated CAR T cells remain in a memory state during chronic tumor exposure. A, Summary plot of longitudinal expansion kinetics for indicated T cells in coculture with AML cell lines (MOLM13 and THP1). Cell count was documented using flow cytometry every 4 days, fold increase was calculated to baseline, and fresh AML was added after dilution at a 1:1 E:T ratio. B, Phenotypic evolvement for CD4+ and CD8+ T cells for indicated T cells experimented similar to (A). C, Residual AML disease during repetitive tumor exposure measured using flow cytometry from (B). D, CD123 and CD33 antigen density per cell measured using flow cytometry. E, Enriched gene sets in indicated T cells after a 48-hour coculture with the MOLM13 AML. F, Spaghetti plot representing individual bioluminescence intensity of MOML13Luc+ mice treated with indicated T cells at a lower dose of 5 million T cells/mouse. G, Absolute count of human CD3 T-cell counts in peripheral blood of mice in (F). H, Pooled TN/SCM, and TCM frequency in peripheral blood of mice treated in (F) and Supplementary Fig. S9A (1 million T cells/mouse). Statistics were calculated using two-way ANOVA (A, C, F, and G), Mann–Whitney U, and stepdown Holm–Šidák tests (B and H). G and H, Statistics compared CD123 versus CD33→CD123 group. F, UT (n = 4), CD123 (n = 4), and CD33→CD123 (n = 4). *, P ≤ 0.05; **, P ≤ 0.01; ***, P ≤ 0.001; ****, P ≤ 0.0001. CTRL, control; DN, down; PBMC, peripeheral blood mononuclear cell; STIM, stimulated; UNSTIM, unstimulated; UT, untransduced T cell.
Figure 5.
Figure 5.
The expression of CD123 CAR through a SynNotch circuit remains below the threshold for eliminating stem cells. A, Mean fluorescent intensity (MFI) plot representing the CD33 and CD123 expression on our patient’s AML blast and their concurrent normal HSPCs compared with the negative control (CTR). B, Kinetics of Jurkatmcherry+ cells expressing truncated CD123 only (CD33) cocultured with indicated T cells at low 1:1 and high 10:1 E:T ratios, monitored using the IncuCyte platform. C, Histograms representing CD33 expression on Jurkat cells with Tet-inducible CD33 expression, various AML cell lines, and Jurkat cells forced expressing truncated CD33. D, Histograms representing CD123 CAR expression through CD33 SynNotch receptor in coculture (E:T of 5:1) with Jurkat cells from (C). E and F, Representative pseudocolor plot and summary data from three normal BM donors showing the remaining CD34+ cells 48 hours after coculture with the indicated T cells at an exaggerated 20:1 ratio. G, Schematics of AML coculture with indicated T cells followed by addition of HSPCs at 18, 24, and 36 hours of AML exposure. H and I, Histogram and summary data (three T-cell donors) representing kinetics of CD123 CAR expression on indicated T cells in coculture with MOLM13 AML at E:T of 1:2. J and K, Pseudocolor plot and summary data representing coculture experiments in which CD34+ HSPCs were added to T cells from (J) at indicated decay time points, and the live HSPC population was measured 48 hours later. L and M, Histogram and summary data representing the expression of CD33 and CD123 on monocytes and HSPCs from three normal donors compared with MOLM13 AML. N, Schematics of Monocytes and AML coculture with indicated T cells followed by addition of HSPCs (three different donors) at 18, 24, and 36 hours of AML exposure. O, Representative color plot showing the CD123 CAR expression constitutively or through CD33 SynNotch in coculture with monocytes or AML as in (P). P, Plots representing individual CD123 CAR+ T-cell count in coculture with monocytes (Mono) or AML at 18, 24, and 36 hours. Q, Plots representing coculture experiments in which CD34+ HSPCs were added to CAR-T cells from the top at 18, 24, and 36 circuit CAR decay, and the live HSPC population was measured 48 hours later. Statistics were calculated using the Student t test (A, F, and M), Mann–Whitney U test (P and Q), and two-way ANOVA with the multiple paired t test (I and K). *, P ≤ 0.05; **, P ≤ 0.01; ***, P ≤ 0.001; ****, P ≤ 0.0001. Dox, doxycycline; ns, not significant; UT, untransduced T cell.
Figure 6.
Figure 6.
CD123 CAR expressed through a SynNotch circuit reduces the risk for hematopoietic toxicity. A and B, Pseudocolor flow cytometry dot plot (48 hours) and the summary data (three normal BM donors) representing the experiment in which indicated T cells were simultaneously cocultured with AML and HSPCs at an exaggerated CAR:AML:HSPC ratio of 20:5:1. C, Pseudocolor flow cytometry dot plot demonstrating CD33 and CD123 expression on peripherally mobilized stem cells. D, Experimental design for colony-forming unit (CFU) assay. Indicated T cells were cocultured with human CD34+ cells (donor 2) at a 1:1 E:T ratio for 24 hours before plating those stem cells on MethoCult for 14 days for the CFU assay. E, Snapshot image of CFU field representing colonies devolved from human CD34+ after coculture with indicated T cells. F and G, Summary bar graph representing CFU and BFU (burst-forming units) counts from CD34+ cells cocultured with three T-cell donors. H, Experimental design of humanized NSG-SGM3 AML CAR toxicity. Six- to eight-week-old NSG-SGM3 were transplanted with human CD34+ stem cells, followed by intravenous injection of indicated T cells at 12 weeks. I and J, Bar graph demonstrating individual mice blood counts 2 and 3 weeks after receiving indicated T cells. K–M, humanized NSG or NSG-SGM3 AML CAR toxicity study: 6–8-week-old NSG or NSG-SGM3 mice were transplanted with expanded human CD34+ stem cells, followed by AML injection in week 3. The indicated T cells were administered 3 days later, and BM was assessed 7 days after by flow cytometry staining. L–M, Individual absolute counts of gated BM populations of lymphocyte subsets (L) and CD34+ cells (M). Please see Supplementary Figs. S16A and S17A for the full gating schemes. N and O, Representative plot (left) and quantification of flow cytometry assay of HUVEC cells (CD31+) cocultured for 48 hours with the indicated T cells (CD3+) at a 20:1 ratio, with or without TNF-α. P and Q, Plots showing absolute cell counts at 48 hours from cocultures of HUVEC with monocytes or AML with the indicated T cells from three healthy donors. Statistics were calculated using ANOVA and post hoc analysis using the Student t test (B, F, G, I, J, L, M, and O), two-way ANOVA with the multiple paired t test (P and Q). I and J, UT (n = 5), CD123 (n = 5), and CD33→CD123 (n = 6). L and M, UT (n = 4), CD123 (n = 4), and CD33→CD123 (n = 4). *, P ≤ 0.05; **, P ≤ 0.01; ***, P ≤ 0.001; ****, P ≤ 0.0001. Mono, monocyte; UT, untransduced T cell.
Figure 7.
Figure 7.
CD33→CD123 CAR-T does not cause systemic cytokine release syndrome. A, Experimental design for humanized NSG-SGM3 AML CAR-T CRS toxicity: 6–8-week-old NSG-SGM3 mice were transplanted with CD34+ stem cells, followed by MOLM13 AML injection. After 6–8 weeks, mice received the indicated T cells and were sacrificed 7 days later. B, Plot representing individual mouse weight loss from (A) 7 days after CAR-T infusion. C, Summary bar graphs representing human (h) and mouse (m) cytokines measured in blood using ELISA. D, Pooled t-distributed stochastic neighbor embedding (t-SNE) plot displays of scRNA-seq data from human (left) and mouse (right) CD45+ cells isolated from the spleens of five humanized AML mice treated with CD123 (n = 2) or CD33→CD123 (n = 3), as shown in (A). Distinct clusters of splenic human and mouse cells, identified at peak CRS, were annotated with biomarkers from the Partek Flow platform (Supplementary Data S1) and labeled accordingly using CellMarker. E, Ingenuity Pathway Analysis of splenic cell transcriptome from mice in (D): network and canonical pathway analyses were performed for genes showing significant changes in splenic cells of humanized SGM3 AML mice treated with CD123 versus CD33→CD123. These analyses were conducted separately for the human B cells and mouse myeloid clusters. Additional network analysis data are presented in Supplementary Fig. S21C and S21D. Statistics were calculated using the Student t test (B and C). *, P ≤ 0.05; **, P ≤ 0.01; ***, P ≤ 0.001. pDC, plasmacytoid dendritic cell; UT, untransduced T cell.

References

    1. Global Burden of Disease Cancer Collaboration; Fitzmaurice C, Abate D, Abbasi N, Abbastabar H, Abd-Allah F, Abdel-Rahman O, et al. Global, regional, and national cancer incidence, mortality, years of Life lost, years lived with disability, and disability-adjusted life-years for 29 cancer groups, 1990–2017. JAMA Oncol 2019;5:1749–68. - PMC - PubMed
    1. Perna F, Berman SH, Soni RK, Mansilla-Soto J, Eyquem J, Hamieh M, et al. Integrating proteomics and transcriptomics for systematic combinatorial chimeric antigen receptor therapy of AML. Cancer Cell 2017;32:506–19.e5. - PMC - PubMed
    1. Perna F, Berman S, Mansilla-Soto J, Hamieh M, Juthani R, Soni R, et al. Probing the AML surfaceome for chimeric antigen receptor (CAR) targets. Blood 2016;128:526.
    1. Haubner S, Perna F, Köhnke T, Schmidt C, Berman S, Augsberger C, et al. Coexpression profile of leukemic stem cell markers for combinatorial targeted therapy in AML. Leukemia 2019;33:64–74. - PMC - PubMed
    1. Thol F, Schlenk RF. Gemtuzumab ozogamicin in acute myeloid leukemia revisited. Expert Opin Biol Ther 2014;14:1185–95. - PubMed

MeSH terms

Substances