Review
. 2025 Jan;21(1):e14397.
doi: 10.1002/alz.14397. Epub 2024 Dec 3.

Plasma p-tau immunoassays in clinical research for Alzheimer's disease

Affiliations
Review

Plasma p-tau immunoassays in clinical research for Alzheimer's disease

Charlotte E Teunissen et al. Alzheimers Dement. 2025 Jan.

Abstract

The revised biomarker framework for diagnosis and staging of Alzheimer's disease (AD) relies on amyloid beta (Aβ) and tau pathologies as core markers, and markers for adjacent pathophysiology, such as neurodegeneration and inflammation. Many of the core fluid biomarkers are phosphorylated tau (p-tau) fragments, with p-tau217 showing a prominent association with Aβ and tau. While positron emission tomography (PET) imaging is well established, plasma p-tau assays are newer and likely to reduce the use of expensive, and less accessible cerebrospinal fluid and PET imaging tests, thereby promoting wider access to AD screening. There is a need for greater understanding of how the various plasma p-tau species reflect different pathological processes of AD and how different immunoassays perform. This review surveys the available immunoassays and highlights their strengths and limitations in different contexts of use. Assays need to be standardized to maximize their impact on AD clinical research, and patient diagnosis and management. HIGHLIGHTS: Different plasma phosphorylated tau (p-tau) species reflect different pathological processes of Alzheimer's disease (AD), with p-tau231 showing the greatest association with the earliest increases in brain amyloid beta (Aβ) accumulation, while p-tau217 shows greater association with both brain Aβ and early tau pathology, and other p-tau and tau fragment species show greater association with later stages of brain tau pathology. Plasma p-tau217 has proven to be an excellent biomarker for AD pathology due to its close association with both brain Aβ and tau pathology, as well as its large dynamic range. Many different assays with varying performance exist for the same p-tau species, with mass spectrometry assays performing uniformly well, and several immunoassays achieving comparable performance. "Round robin" head-to-head studies have been performed to compare different assays for several key plasma biomarkers, including p-tau181 and p-tau217, but additional head-to-head studies are needed, especially for new analytes and for measuring performance in diverse populations. Plasma immunoassays have the potential to increase accessibility of early diagnostic testing for a broad population, including diverse historically under-represented and under-served populations, due to the potential to be implemented globally, including in primary care settings; however, further research is needed to validate the optimal cutoffs for each assay for real-world clinical usage. Eventually, clinical implementation of a two-step workflow may allow standalone use of plasma testing in certain contexts, minimizing the need for confirmation with costly and less accessible cerebrospinal fluid/positron emission tomography testing.

Keywords: Alzheimer's disease; phosphorylated tau assays; plasma immunoassays; tau biomarkers.


Conflict of interest statement

Rachel Kolster and Gallen Triana‐Baltzer are employees of Janssen Research & Development, LLC. Hartmuth C. Kolb was an employee of Janssen Research & Development, LLC at the time of submission of this paper. Shorena Janelidze is supported by grants from the Swedish Alzheimer Foundation, Stiftelsen för Gamla Tjänarinnor, and Greta och Johan Kocks Stiftelser. Charlotte E. Teunissen has received grants from the European Commission (Marie Curie International Training Network, grant agreement No 860197 [MIRIADE]), JPND, Health∼Holland, the Dutch Research Council (ZonMW), Alzheimer Drug Discovery Foundation, The Selfridges Group Foundation, Alzheimer Netherlands, and the Alzheimer's Association; is an associate editor at Alzheimer's Research & Therapy and Neurology: Neuroimmunology & Neuroinflammation and an advisor for Medidact; has a collaboration contract with ADx Neurosciences and Quanterix; and performed contract research for AC‐Immune, Axon Neurosciences, Biogen, Brainstorm Therapeutics, Celgene, EIP Pharma, Eisai, PeopleBio, Roche, Toyama, and Vivoryon. Charlotte E. Teunissen is a recipient of ABOARD, which is a public–private partnership (PPP) receiving funding from ZonMW (#73305095007) and Health∼Holland, Topsector Life Sciences & Health (PPP allowance; #LSHM20106). More than 30 partners participate in ABOARD. ABOARD also receives funding from Edwin Bouw Fonds and Gieskes‐Strijbisfonds. Henrik Zetterberg has served on scientific advisory boards and/or as a consultant for Abbvie, Alector, ALZPath, Annexon, Apellis, Artery Therapeutics, AZTherapies, CogRx, Denali, Eisai, Nervgen, Novo Nordisk, Pinteon Therapeutics, Red Abbey Labs, reMYND, Passage Bio, Roche, Samumed, Siemens Healthineers, Triplet Therapeutics, and Wave; has given lectures in symposia sponsored by Cellectricon, Fujirebio, Alzecure, Biogen, and Roche; and is a co‐founder of Brain Biomarker Solutions in Gothenburg AB (BBS), which is a part of the GU Ventures Incubator Program (outside submitted work). He is a Wallenberg Scholar supported by grants from the Swedish Research Council (#2018‐02532); the European Research Council (#681712); Swedish State Support for Clinical Research (#ALFGBG‐720931); the Alzheimer Drug Discovery Foundation, USA (#201809‐2016862); the Alzheimer's disease Strategic Fund and the Alzheimer's Association (#ADSF‐21‐831376‐C, #ADSF‐21‐831381‐C, and #ADSF‐21‐831377‐C); the Olav Thon Foundation; the Erling‐Persson Family Foundation, Stiftelsen för Gamla Tjänarinnor, Hjärnfonden, Sweden (#FO2019‐0228); the European Union's Horizon 2020 research and innovation programme under the Marie Skłodowska‐Curie grant agreement No 860197 (MIRIADE); and the UK Dementia Research Institute at UCL. Author disclosures are available in the supporting information.

Figures

FIGURE 1
FIGURE 1
A, ATN biomarker profiles. B, Temporal ordering of biomarker abnormalities in AD progression. A, amyloid; AD, Alzheimer's disease; CSF, cerebrospinal fluid; N, neurodegeneration; NfL, neurofilament light; NFTs, neurofibrillary tangles; PET, positron emission tomography; p‐tau, phosphorylated tau; T, tau; t‐tau, total tau.
FIGURE 2
FIGURE 2
Schematic diagram depicting tau phosphorylation sites (2N4R isoform) and the immunoassays that target each site.
FIGURE 3
FIGURE 3
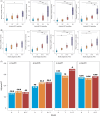
Comparison of plasma phospho‐tau epitopes quantified by targeted MS. A, Association of plasma p‐tau181, p‐tau205, p‐tau217, and p‐tau231 with Aβ PET. Box plots of the z scores in the levels of plasma p‐tau species quantified by MS in participants classified in quartiles according to their Aβ PET uptake (Q1 = [–Inf, 1.29]; Q2 = [1.29, 1.7]; Q3 = [1.7, 2.45]; Q4 = [2.45, Inf]; n = 51). The reference group was Q1. The box plots depict the median (horizontal bar) and 25th to 75th percentiles (hinges), and whiskers indicate 10th and 90th percentiles. Statistical analysis across groups was performed using age‐adjusted and sex‐adjusted ANOVA (two‐sided), and Tukey contrasts were used to account for multiple comparisons (* P < 0.05, ** P < 0.01, *** P < 0.001). Exact significant P values: p‐tau181 PQ1 versus Q4 = 0.0118; p‐tau205 PQ1 versus Q4 < 0.001, PQ2 versus Q4 < 0.001, PQ3 versus Q4 = 0.0015; p‐tau217 PQ1 versus Q4 < 0.001, PQ2 versus Q4 < 0.001, PQ3 versus Q4 < 0.001; p‐tau231 PQ1 versus Q4 < 0.001, PQ2 versus Q4 = 0.0029, PQ3 versus Q4 = 0.0095. B, Association of plasma p‐tau181, p‐tau205, p‐tau217, and p‐tau231 with tau PET. Box plots of the z scores in the levels of plasma p‐tau181, p‐tau205, p‐tau217, and p‐tau231 quantified by MS in participants according to regional spreading of tau classified by Braak stages (n = 51). The reference group was Braak 0. The box plots depict the median (horizontal bar) and 25th to 75th percentiles (hinges), and whiskers indicate 10th and 90th percentiles. Statistical analysis across groups was performed using age‐adjusted and sex‐adjusted ANOVA (two‐sided), and Tukey contrasts were used to account for multiple comparisons (* P < 0.05, ** P < 0.01, *** P < 0.001). Exact significant P values: p‐tau205 P0 versus V–VI < 0.001, PI–II versus V–VI < 0.001, PIII–IV versus V–VI = 0.0119; p‐tau217 P0 versus V–VI < 0.001, P0 versus III–IV = 0.0082, PI–II versus V–VI < 0.001, PIII–IV versus V–VI = 0.0468; p‐tau231 P0 versus V–VI < 0.001, P0 versus III–IV = 0.050. C, Aβ and/or tau PET regression models for plasma p‐tau181, p‐tau205, p‐tau217, or p‐tau231 quantified by targeted MS. R2 and AIC are indicated for the different regression models, using only amyloid PET signal (A: indexed by global amyloid PET SUVR), only tau PET signal (T: indexed by global tau PET SUVR) or both amyloid and tau (A+T). The panel shows adjusted R2 for age and sex (inside the bars), together with AIC (above the bars) for each model (n = 51). A, amyloid; Aβ, amyloid beta; AIC, Akaike information criterion; ANOVA, analysis of variance; MS, mass spectrometry; PET, positron emission tomography; p‐tau, phosphorylated tau; SUVR, standardized uptake value ratio; T, tau.
FIGURE 4
FIGURE 4
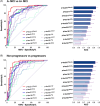
Head‐to‐head comparisons of assays for multiple different epitopes. ROC curve analysis for prediction of abnormal CSF Aβ42/40 status and progression to AD dementia (ADD). ROC curve analysis for differentiating (A) MCI participants with abnormal CSF Aβ42/40 from those with normal CSF Aβ42/40 and (B) MCI patients who progressed to ADD during follow‐up from those who did not (stable MCI patients and MCI patients who progressed to other types of dementia). The Wash U assays are MS, while the others are immunoassays. Aβ, amyloid beta; AD, Alzheimer's disease; AUC, area under the curve; CSF, cerebrospinal fluid; MCI, mild cognitive impairment; MS, mass spectrometry; p‐tau, phosphorylated tau; ROC, receiver operating characteristic.
FIGURE 5
FIGURE 5
Association between longitudinal plasma biomarker changes and longitudinal cognitive decline and brain atrophy. The association between longitudinal plasma biomarkers and MMSE (A), mPACC (B), and cortical thickness of typical AD signature regions (C) in Aβ‐positive (by CSF Aβ42/40) cognitively unimpaired participants. The x axis shows time from first plasma biomarker samples. The model trajectories, shown as the mean slope and the mean ± 2 SD with 95% CI (shaded area), were plotted from linear mixed effects models with the interaction between time and standardized plasma biomarker slopes (derived from subject‐level linear regression models) as an independent variable adjusting for age and sex; associations with cognition were also adjusted for years of education. Two‐sided P values were corrected for multiple comparisons using Benjamini–Hochberg FDR. Aβ, amyloid beta; AD, Alzheimer's disease; CI, confidence interval; CSF, cerebrospinal fluid; GFAP, glial fibrillary acidic protein; MMSE, Mini‐Mental State Examination; mPACC, modified Preclinical Alzheimer's Cognitive Composite; NfL, neurofilament light; p‐tau, phosphorylated tau; SD, standard deviation.
FIGURE 6
FIGURE 6
Association of plasma p‐tau biomarkers with Aβ PET and tau PET. Scatterplots show the association between plasma p‐tau181, p‐tau217, p‐tau231, and summary measures of Aβ PET and tau PET in the TRIAD study. Brain images show the voxelwise associations of plasma p‐tau181, p‐tau217, and p‐tau231 with [18F] AZD4694 SUVR and [18F]MK6240 SUVR. Aβ, amyloid beta; PET, positron emission tomography; p‐tau, phosphorylated tau; ROI, region of interest; SUVR, standardized uptake volume ratio.

References

    1. Jack CR Jr, Bennett DA, Blennow K, et al. A/T/N: an unbiased descriptive classification scheme for Alzheimer disease biomarkers. Neurology. 2016;87:539‐547. doi:10.1212/WNL.0000000000002923 - DOI - PMC - PubMed
    1. Jack CR Jr, Andrews JS, Beach TG, et al. Revised criteria for diagnosis and staging of Alzheimer's disease: alzheimer's Association Workgroup. Alzheimers Dement. 2024;20(8):5143‐5169. doi:10.1002/alz.13859 - DOI - PMC - PubMed
    1. Dubois B, Hampel H, Feldman HH, et al. Preclinical Alzheimer's disease: definition, natural history, and diagnostic criteria. Alzheimers Dement. 2016;12:292‐323. doi:10.1016/j.jalz.2016.02.002 - DOI - PMC - PubMed
    1. Jack CR Jr, Bennett DA, Blennow K, et al. NIA‐AA Research Framework: toward a biological definition of Alzheimer's disease. Alzheimers Dement. 2018;14:535‐562. doi:10.1016/j.jalz.2018.02.018 - DOI - PMC - PubMed
    1. Cummings J. The National Institute on Aging‐Alzheimer's Association Framework on Alzheimer's disease: application to clinical trials. Alzheimers Dement. 2019;15:172‐178. doi:10.1016/j.jalz.2018.05.006 - DOI - PMC - PubMed