Tau pathway-based gene analysis on PET identifies CLU and FYN in a Korean cohort
- PMID: 39625110
- PMCID: PMC11848168
- DOI: 10.1002/alz.14416
Tau pathway-based gene analysis on PET identifies CLU and FYN in a Korean cohort
Abstract
Introduction: The influence of genetic variation on tau protein aggregation, a key factor in Alzheimer's disease (AD), remains not fully understood. We aimed to identify novel genes associated with brain tau deposition using pathway-based candidate gene association analysis in a Korean cohort.
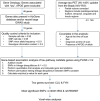
Methods: We analyzed data for 146 older adults from the well-established Korean AD continuum cohort (Korean Brain Aging Study for the Early Diagnosis and Prediction of Alzheimer's Disease; KBASE). Fifteen candidate genes related to both tau pathways and AD were selected. Association analyses were performed using PLINK: A tool set for whole-genome association and population-based linkage analyses (PLINK) on tau deposition measured by 18F-AV-1451 positron emission tomography (PET) scans, with additional voxel-wise analysis conducted using Statistical Parametric Mapping 12 (SPM12).
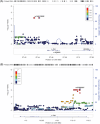
Results: CLU and FYN were significantly associated with tau deposition, with the most significant single-nucleotide polymorphisms (SNPs) being rs149413552 and rs57650567, respectively. These SNPs were linked to increased tau across key brain regions and showed additive effects with apolipoprotein E (APOE) ε4.
Discussion: CLU and FYN may play specific roles in tau pathophysiology, offering potential targets for biomarkers and therapies.
Highlights: Gene-based analysis identified CLU and FYN as associated with tau deposition on positron emission tomography (PET). CLU rs149413552 and FYN rs57650567 were associated with brain tau deposition. rs149413552 and rs57650567 were associated with structural brain atrophy. CLU rs149413552 was associated with immediate verbal memory. CLU and FYN may play specific roles in tau pathophysiology.
Keywords: CLU; FYN; GWAS; Korean adults; tau pathway; tau‐PET.
© 2024 The Author(s). Alzheimer's & Dementia published by Wiley Periodicals LLC on behalf of Alzheimer's Association.
Conflict of interest statement
A.J.S. has received support from Avid Radiopharmaceuticals, a subsidiary of Eli Lilly (in‐kind contribution of positron emission tomography [PET] tracer precursor), and participated in scientific advisory boards (Bayer Oncology, Eisai, Novo Nordisk, and Siemens Medical Solutions USA, Inc) and an observational study monitoring board (Multi‐Ethnic Study of Atherosclerosis (MESA), National Institute of Health (NIH) National Heart, Lung, and Blood Institute (NHLBI)), as well as several other National Institute of Aging (NIA) External Advisory Committees. He also serves as Editor‐in‐Chief of
Figures


References
-
- Wang Y, Mandelkow E. Tau in physiology and pathology. Nat Rev Neurosci. 2016;17:5‐21. - PubMed
MeSH terms
Substances
Grants and funding
- T32 AG071444/AG/NIA NIH HHS/United States
- R01 AG019771/AG/NIA NIH HHS/United States
- R01 LM012535/GF/NIH HHS/United States
- HI18C0630/Korean Government, Ministry of Science and ICT (KR)
- R01 LM013463/GF/NIH HHS/United States
- U01 AG072177/GF/NIH HHS/United States
- U19 AG024904/AG/NIA NIH HHS/United States
- U01 AG24904/GF/NIH HHS/United States
- RS-2022-00165636/Seoul National University (KR)
- R01 AG068193/GF/NIH HHS/United States
- RS-2023-KH136195/Seoul National University (KR)
- P30 AG072976/AG/NIA NIH HHS/United States
- RS-2024-00339665/Korea Dementia Research Center (KR)
- NRF-2014M3C7A1046042/Korean Government, Ministry of Science and ICT (KR)
- R01 LM013463/LM/NLM NIH HHS/United States
- U01 AG072177/AG/NIA NIH HHS/United States
- P30 AG010133/AG/NIA NIH HHS/United States
- U19 AG074879/AG/NIA NIH HHS/United States
- U01AG072177/Foundation for the National Institutes of Health
- U01 AG024904/AG/NIA NIH HHS/United States
- P30 AG072976/GF/NIH HHS/United States
- T32 AG071444/GF/NIH HHS/United States
- U01 AG068057/AG/NIA NIH HHS/United States
- P30 AG010133/GF/NIH HHS/United States
- U01 AG068057/GF/NIH HHS/United States
- R01 AG057739/GF/NIH HHS/United States
- R01 AG019771/GF/NIH HHS/United States
- U01AG072177/GF/NIH HHS/United States
- U19 AG024904/GF/NIH HHS/United States
- U19 AG074879/GF/NIH HHS/United States
- HI19C0149/Korean Government, Ministry of Science and ICT (KR)
- R01 AG057739/AG/NIA NIH HHS/United States
- R01 AG068193/AG/NIA NIH HHS/United States
- R01 LM012535/LM/NLM NIH HHS/United States
LinkOut - more resources
Full Text Sources
Medical
Research Materials
Miscellaneous

