. 2024 Dec 2;65(14):8.
doi: 10.1167/iovs.65.14.8.

Sequence and Detectability of Changes in Macular Ganglion Cell Layer Thickness and Perfusion Density in Early Glaucoma

Affiliations

Sequence and Detectability of Changes in Macular Ganglion Cell Layer Thickness and Perfusion Density in Early Glaucoma

Ryo Tomita et al. Invest Ophthalmol Vis Sci. .

Abstract

Purpose: To investigate whether macular perfusion density (PD) changes measured over time by optical coherence tomography angiography (OCTA) are detectable before progressive macular ganglion cell layer (GCL) thinning in early glaucoma.

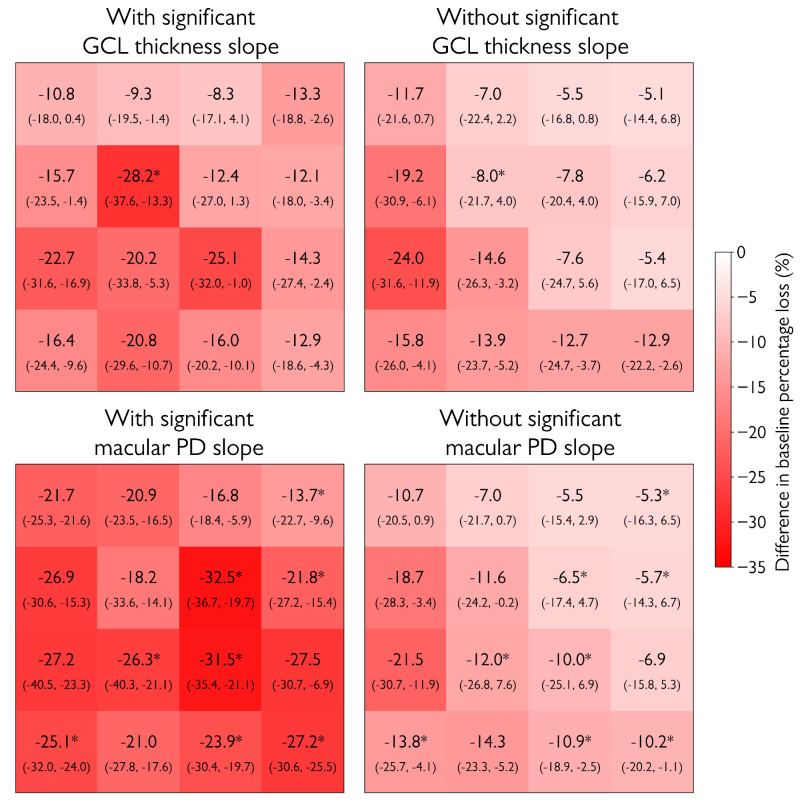
Methods: This prospective longitudinal cohort study involved patients with early open-angle glaucoma and healthy subjects imaged by OCT and OCTA every 4 months. GCL thickness and macular PD were evaluated in 16 tiles in the macula. We estimated baseline percentage losses of GCL thickness or macular PD in glaucoma patients with age-corrected normative values derived from the healthy subjects. Additionally, the threshold slope separating glaucoma patients from healthy subjects with 90% specificity was used to determine the number of patients with steeper slopes than the threshold slope.

Results: Eighty patients with glaucoma and 42 healthy subjects were included. In eight tiles (50%), patients with a significant macular PD slope had a significantly greater baseline percentage loss of GCL thickness relative to macular PD compared to patients without a significant macular PD slope. Furthermore, in 15 tiles (94%), a greater baseline percentage loss of GCL thickness relative to PD was significantly correlated with faster PD slopes. In contrast, only one tile (6%) showed these significant trends for GCL slopes. The number of patients with faster GCL slopes than threshold slopes was significantly larger than patients with faster PD slopes in 12 tiles (75%).

Conclusions: A decrease in GCL thickness precedes a measurable decrease in macular PD. Early glaucomatous progression is more frequently detectable with changes in GCL thickness compared to macular PD.


Conflict of interest statement

Disclosure: R. Tomita, None; C.A. Smith, None; O.M. Dyachok, None; G.P. Sharpe, None; P.E. Rafuse, None; L.M. Shuba, None; M.T. Nicolela, Heidelberg Engineering (F); B.C. Chauhan, Heidelberg Engineering (F)

Figures

Figure 1.
Figure 1.
Schematic diagram showing the analyzed tiles in this study. The blue outer square indicates the area measured by OCT, which outputs GCL thickness for each of the 8 × 8 tiles. The red square indicates the area measured by OCTA. The black inner square indicates the 16 (4 × 4) tiles, fully overlapped by OCT and OCTA, which were analyzed in this study. Each tile represents an area of 3° × 3°. The tile numbers in the analysis are indicated.
Figure 2.
Figure 2.
Differences in baseline percentage loss of GCL thickness and macular PD in the glaucoma patient. Differences were calculated by subtracting the baseline percentage loss of GCL thickness from the baseline percentage loss of macular PD. Numbers represent medians of the difference; quartiles are shown in parentheses.
Figure 3.
Figure 3.
Differences in baseline percentage loss among glaucoma patients with (top left) and without (top right) significant GCL thickness slopes and with (bottom left) and without (bottom right) significant macular PD slopes during the follow-up. Numbers represent median (interquartile range) differences in baseline percentage loss. *Tiles in which differences in the baseline percentage loss among glaucoma patients with and without significant slopes were statistically significant.
Figure 4.
Figure 4.
Scatterplots of GCL thickness slopes and differences in baseline percentage loss in glaucoma patients. The dots indicate differences in baseline percentage loss calculated by subtracting GCL thickness loss from macular PD loss (horizontal axis) and GCL thickness slope during the follow-up period (vertical axis) for each glaucoma patient. The darker the point, the greater the overlap of glaucoma patients. There was a significant correlation between GCL thickness slope and the difference in baseline percentage in only Tile 12. Spearman's correlation coefficient is indicated by r.
Figure 5.
Figure 5.
Scatterplots of macular PD slopes and differences in baseline percentage loss in glaucoma patients. The dots indicate difference in baseline percentage loss calculated by subtracting the GCL thickness loss from the macular PD loss (horizontal axis) and macular PD slope during the follow-up period (vertical axis) for each glaucoma patient. The darker the point, the greater the overlap of glaucoma patients. There were significant correlations between macular PD slope and difference in baseline percentage loss in all tiles except Tile 13.
Figure 6.
Figure 6.
Number and percentage of glaucoma patients with steeper GCL thickness (left) and steeper macular PD (right) slopes than the respective values that distinguish glaucoma patients from healthy subjects with 90% specificity. In each tile, more glaucoma patients had steeper GCL thickness slopes compared to macular PD slopes. *Tiles with statistically significant differences.

References

    1. Jia Y, Tan O, Tokayer J, et al. .. Split-spectrum amplitude-decorrelation angiography with optical coherence tomography. Opt Express. 2012; 20: 4710–4725. - PMC - PubMed
    1. WuDunn D, Takusagawa HL, Sit AJ, et al. .. OCT angiography for the diagnosis of glaucoma: a report by the American Academy of Ophthalmology. Ophthalmology. 2021; 128: 1222–1235. - PubMed
    1. Hou H, Moghimi S, Zangwill LM, et al. .. Macula vessel density and thickness in early primary open-angle glaucoma. Am J Ophthalmol. 2019; 199: 120–132. - PMC - PubMed
    1. Wan KH, Lam AKN, Leung CK.. Optical coherence tomography angiography compared with optical coherence tomography macular measurements for detection of glaucoma. JAMA Ophthalmol. 2018; 136: 866–874. - PMC - PubMed
    1. Smith CA, West ME, Sharpe GP, et al. .. Asymmetry analysis of macular optical coherence tomography angiography in patients with glaucoma and healthy subjects. Br J Ophthalmol. 2020; 104: 1724–1729. - PubMed

LinkOut - more resources