. 2024 Dec 3:12:RP91663.
doi: 10.7554/eLife.91663.

Sympathetic motor neuron dysfunction is a missing link in age-associated sympathetic overactivity

Affiliations

Sympathetic motor neuron dysfunction is a missing link in age-associated sympathetic overactivity

Lizbeth de La Cruz et al. Elife. .

Abstract

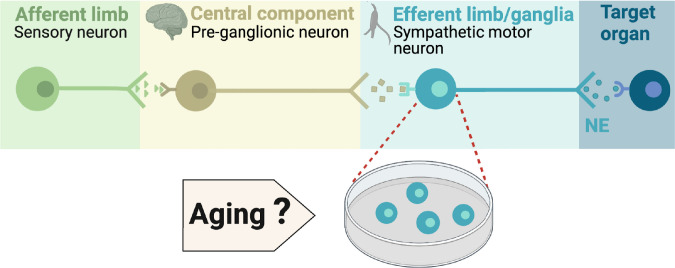
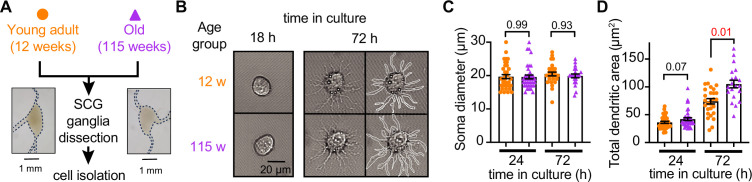
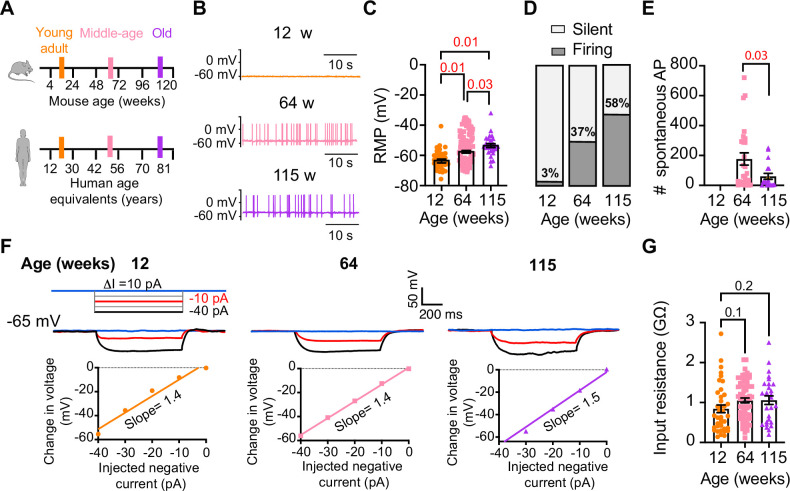
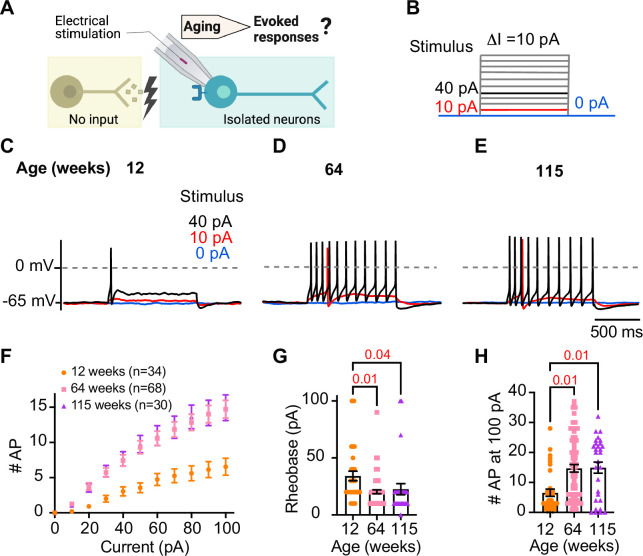
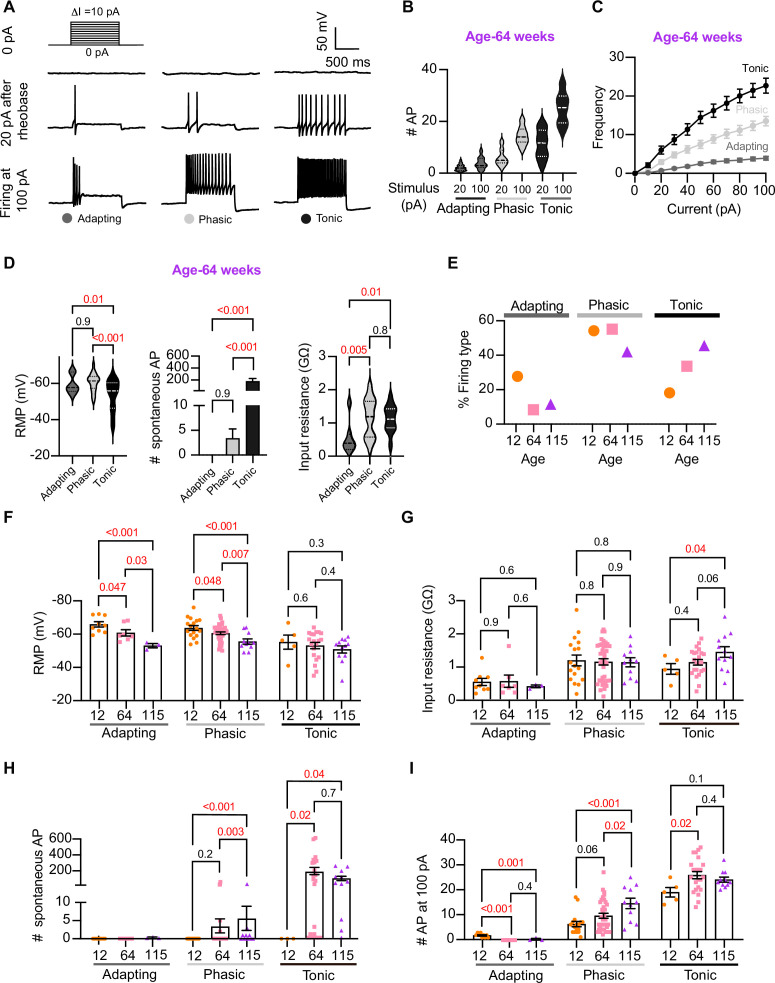
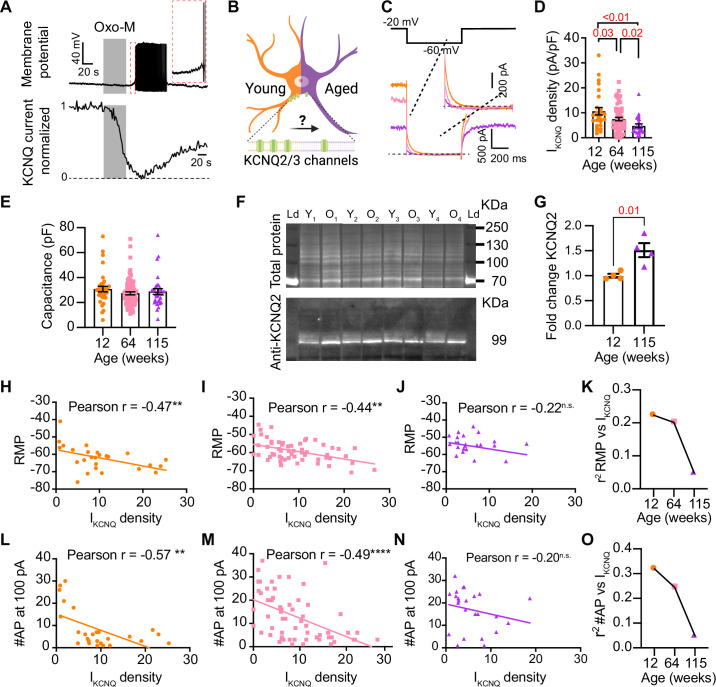
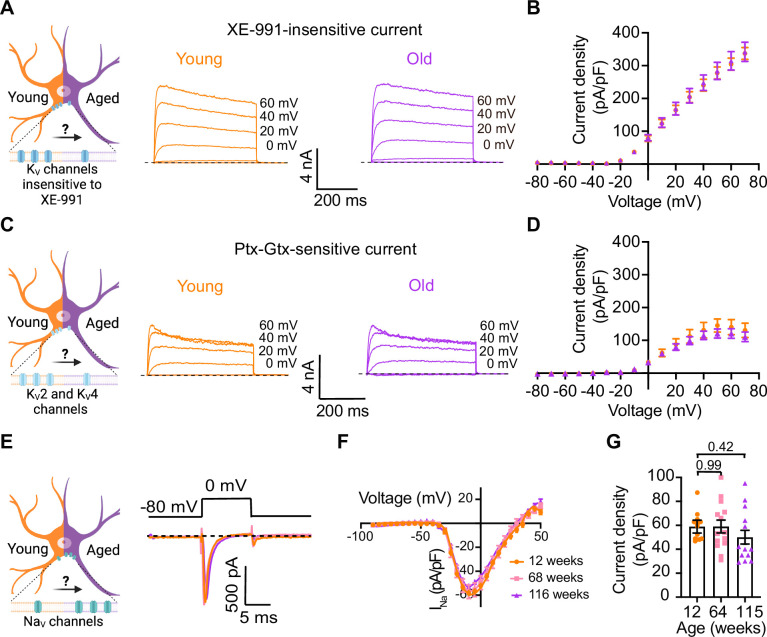
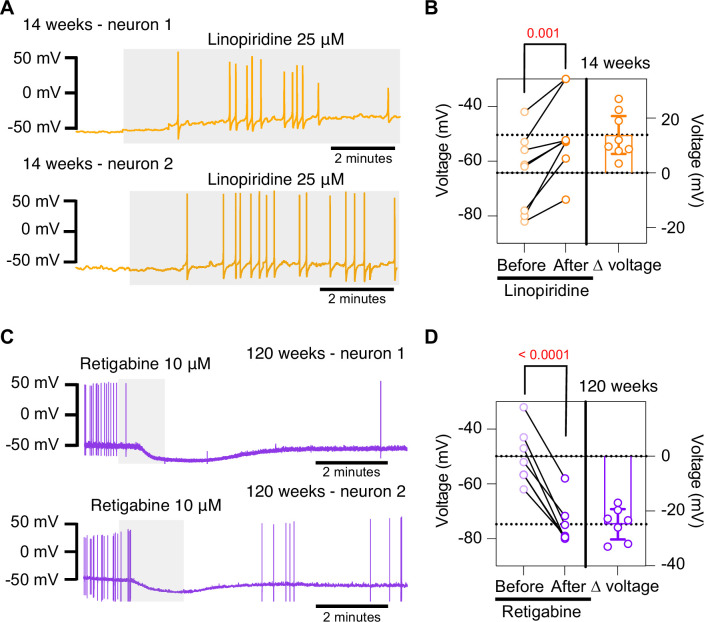
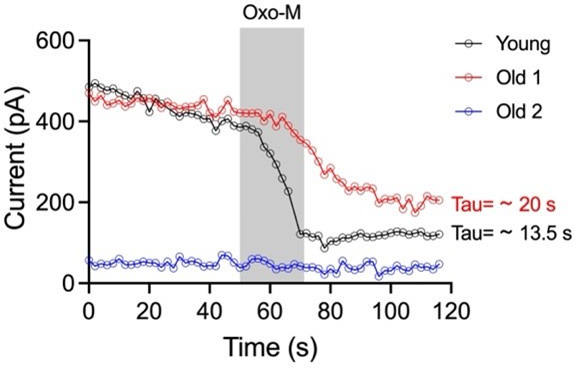
Overactivity of the sympathetic nervous system is a hallmark of aging. The cellular mechanisms behind this overactivity remain poorly understood, with most attention paid to likely central nervous system components. In this work, we hypothesized that aging also affects the function of motor neurons in the peripheral sympathetic ganglia. To test this hypothesis, we compared the electrophysiological responses and ion-channel activity of neurons isolated from the superior cervical ganglia of young (12 weeks), middle-aged (64 weeks), and old (115 weeks) mice. These approaches showed that aging does impact the intrinsic properties of sympathetic motor neurons, increasing spontaneous and evoked firing responses. A reduction of M current emerged as a major contributor to age-related hyperexcitability. Thus, it is essential to consider the effect of aging on motor components of the sympathetic reflex as a crucial part of the mechanism involved in sympathetic overactivity.

Keywords: KCNQ current; cell biology; cellular aging; intercellular communication; mouse; neuronal hyper-excitability; neuroscience; organ dysfunction; sympathetic nervous system.


Conflict of interest statement

Ld, DB, CM, OV No competing interests declared

Figures

Figure 1.
Figure 1.. Components of the sympathetic reflex.
Schematic of the components of the sympathetic autonomic reflex: Sensory neurons send information to the central component (pre-ganglionic neurons), where information is processed. Then, sympathetic motor neurons receive information from pre-ganglionic neurons to transmit it to the target organ. This research was focused on evaluating the age-related changes in the function of sympathetic motor neurons.
Figure 2.
Figure 2.. Sympathetic motor neurons from old mice are healthy in culture.
(A) Diagram of the experimental approach: Sympathetic motor neurons were isolated from the superior cervical ganglia (SCG) of 12- and 115-week-old mice. The ganglia did not show morphological differences between ages. (B) Differential interference contrast images of sympathetic motor neurons in culture for 18 hr and 72 hr. Right images at 72 hr outline the dendritic area measured. w, weeks. (C) Comparison of soma diameter between neurons isolated from 12 or 115 weeks of age at two time points in culture. Orange circles showed single cells from 12-week-old mice while purple triangles show single cells from 115-week-old mice. (D) Comparison of the total dendritic area as a proxy for neurite regeneration in culture. Data points are from N = 3 animals, n = 38 cells, from 12 weeks old, and N = 3 animals, n = 39 cells, from 115 weeks old. Error bars represent SEM. p-Values are shown at the top of the graphs. Red values indicate p-values<0.05 while black values indicate p-values>0.05.
Figure 3.
Figure 3.. Sympathetic motor neurons from old mice fire action potentials spontaneously.
(A) Schematic of ages in mice, and equivalent in humans, that were used to compare the functional responses of sympathetic motor neurons. (B) Representative membrane potential recordings of spontaneous activity from neurons isolated from 12-, 64-, and 115-week-old mice. (C) Comparison of the resting membrane potential (RMP) between different ages. (D) Comparison of the percentage of silent and firing neurons between different ages. (E) Comparison of the number of action potentials (APs) fired spontaneously in 1 min between different ages. (F) Top: representative passive responses to hyperpolarizing stimuli from neurons isolated from 12-, 64-, and 115-week-old mice. Blue traces correspond to 0 pA injection, red traces to –10 pA, and black traces to –40 pA. Bottom: voltage–current relationship of top recordings. (G) Comparison of the input resistance between different ages. Data points are from N = 4 animals, n = 35 cells, from 12 weeks old, N = 6 animals, n = 65 cells, from 64 weeks old, and N = 4 animals, n = 32 cells, from 115 weeks old. Error bars represent SEM. p-Values are shown at the top of the graphs. Red p-values indicate p-values<0.05, while black p-values indicate p-values>0.05.
Figure 4.
Figure 4.. Sympathetic motor neurons from old mice are more responsive to electrical stimulation.
(A) In the context of the sympathetic reflex, motor neurons increase their firing frequency in response to inputs from the sympathetic nuclei in the brain. In this study, motor neuron responses were measured using electrical stimulation at different ages. (B) Stimulation protocol to mimic preganglionic input. (C–E) Representative voltage responses of sympathetic motor neurons from 12- (C), 64- (D), and 115-week-old mice (E). Blue, red, and black traces are in response to 0, 10, and 40 pA current injection, respectively. The dotted line shows 0 mV as reference. (F). Comparison of stimulation–response curves of the number of action potentials (APs) vs. injected current between different ages. (G) Comparison of the minimum current injected that elicited at least one AP (Rheobase) between different ages. (H) Comparison of the number of APs fired at the maximum stimulus (100 pA) between different ages. Data were collected from N = 4 animals, n = 34 cells, from 12 weeks old, N = 6 animals, n = 68 cells, from 64 weeks old, and N = 4 animals, n = 30 cells, from 115 weeks old. Error bars represent SEM. p-Values are shown at the top of the graphs.
Figure 5.
Figure 5.. Analysis of neuronal subpopulations.
Aging shifts neuronal population toward tonic firing. (A) Representative recordings from three different neurons illustrate the variability in the response to show the method used to classify cells by their firing pattern as adapting (left), phasic (center), or tonic (right). Responses to stimulation of 0 (top), 20 pA above the rheobase (middle), and 100 pA (bottom). The classification was based on the response 20 pA above the rheobase. (B) Comparison of the number of action potentials (APs) elicited by current injections of 20 pA more than rheobase or 100 pA between classes. Data are from 64-week-old mice. (C) Comparison of the stimulus–frequency curves between classes. Data are from 64-week-old mice. (D) Comparison of RMP, (left), number of spontaneous APs (middle), and input resistance (right) between classes. All data are from 64-week-old mice. (E) Comparison of the percentage of neuronal firing subtypes between different ages. (F) Comparison of the RMP between ages and divided into neuronal subpopulations. (G) Comparison of the input resistance between ages and divided into neuronal subpopulations. (H) Comparison of the number of spontaneous APs between ages and neuronal subpopulations. (I) Comparison of the number of APs in response to maximum stimulation (100 pA) between ages and neuronal subpopulations. Data points for the adapting subpopulation are nine cells from 12 weeks old, seven from 64 weeks old, and three from 115 weeks old. Data points for the phasic subpopulation are 17 cells from 12 weeks old, 38 from 64 weeks old, and 11 cells from 115 weeks old. Data points for the tonic subpopulation are 5 cells from 12 weeks old, 23 from 64 weeks old, and 11 cells from 115 weeks old. Data points are also from a total of four 12-week-old mice, six 64-week-old mice, and four 115-week-old mice. Error bars represent SEM. Red values indicate p-values<0.05, while black values indicate p-values>0.05.
Figure 6.
Figure 6.. Sympathetic motor neurons from old mice show a KCNQ current reduction.
(A) Recordings illustrating relevance of KCNQ current for controlling membrane potential and firing in sympathetic motor neurons. Top: voltage response to inhibition of KCNQ channels with 10 μM Oxo-M; bottom: normalized KCNQ current recording in response to oxo-M in the same cell after going whole cell. (B) Schematic representation of the hypothesis that aged cells show a reduced activity of KCNQ channels. (C) KCNQ current recordings from neurons isolated from mice of different ages (orange 12 weeks old, pink 64 weeks old, and purple 115 weeks old) in response to a voltage step (top). Inset shows an expanded view of the current tail. (D) Comparison of KCNQ current density between different ages. Data points are from N = 5 animals, n = 27 cells, from 12 weeks old, N = 8 animals, n = 62 cells, from 64 weeks old, and N = 5 animals, n = 24 cells, from 115 weeks old. (E) Comparison of capacitance between ages. (F) Blot stained for total and KCNQ2 protein collected from superior cervical ganglia from 12- and 115-week-old mice. (G) Comparison of fold change of KCNQ2 abundance relative to total protein between ages (n = 4 blots from different mice). (H–J) Linear correlation between RMP and KCNQ current density in 12-week-old (H), 64-week-old (I), and 115-week-old mice (J). (K) Comparison of the determination coefficient for the RMP and KCNQ current between ages. (LN) Linear correlation between the number of action potentials (APs) at 100 pA and KCNQ current density in 12-week-old (L), 64-week-old (M), and 115-week-old mice (N). (O) Comparison of the determination coefficient for the maximum #AP and KCNQ current between ages. Data points are from N = 4 animals, n = 26 cells, from 12 weeks old, N = 6 animals, n = 58 cells, from 64 weeks old, and N = 4 animals, n = 24 cells, from 115 weeks old. Error bars represent SEM.
Figure 7.
Figure 7.. Sympathetic motor neurons from old mice did not show changes in sodium currents or XE-991-insensitive potassium currents.
(A) Left: schematic of the hypothesis that KV channels insensitive to XE-991 are reduced in aged cells. Right: family of outward currents in the presence of KCNQ channel blocker, 100 nM XE-991, in 12-week-old and 115-week-old mice. Text at the right of each current trace corresponds to the voltage used to elicit that current. (B) Current–voltage relationship of the steady-state KV currents insensitive to XE-991 from cells isolated from 12-week-old and 115-week-old mice. Data points of KV currents are from N = 3 animals, n = 9 cells, from 12 weeks old, and N = 3 animals, n = 8 cells, from 115 weeks old. (C) Left: schematic of the hypothesis that KV2 (Guangxitoxin-1E sensitive, Gtx) and KV4 (phrixotoxin-1 sensitive, Ptx) channels are reduced in aged cells. Right: family of Ptx- and Gtx-sensitive outward currents in 12-week-old and 115-week-old mice. Text at the right of each current trace corresponds to the voltage used to elicit that current. (D) Current–voltage relationship of the steady-state KV currents sensitive to Ptx- and Gtx from cells isolated from 12-week-old and 115-week-old mice. Data points of KV2 and KV4 currents are from N = 3 animals, n = 12 cells, from 12 weeks old, and N = 3 animals, n = 8 cells, from 115 weeks old. (E) Left: schematic of the hypothesis that NaV channels sensitive to TTX are increased in aged cells. Right: representative sodium current recordings from neurons isolated from mice of different ages (orange, 12 weeks old; pink, 64 weeks old; and purple, 115 weeks old) in response to a voltage step (top). (F) Current–voltage relationship of the peak sodium current for different ages. (G) Comparison of sodium current density between different ages. Data points of NaV currents are from N = 3 animals, n = 12 cells, from 12 weeks old, N = 3 animals, n = 14 cells, from 64 weeks old, and N = 3 animals, n = 13 cells, from 115 weeks old. Error bars represent SEM. p-Values are shown at the top of the graphs.
Figure 8.
Figure 8.. Pharmacological inhibition and activation of KCNQ channels mimic the age-dependent phenotype.
(A) Membrane potential recordings from two young neurons treated with 25 μM linopirdine during the time illustrated by the light gray box. No holding current was applied. (B) Left: summary of the resting membrane potential measured before (light orange) and after (dark orange) the application of linopirdine. Right: summary of the depolarization produced by linopirdine calculated by subtracting the post-drug voltage from the pre-drug voltage (ΔV). Data points are from N = 2 animals, n = 8 cells, 14-week-old mice. (C) Membrane potential recordings from two aged neurons treated with 10 μM retigabine during the time illustrated by the light gray box. No holding current was applied. (D) Left: summary of the resting membrane potential measured before (light purple) and after (dark purple) the application of retigabine. Right: summary of the hyperpolarization produced by retigabine calculated by subtracting the post-drug voltage from the pre-drug voltage (ΔV). Data points are from N = 2 animals, n = 7 cells, 120-week-old mice. Error bars represent 95% CI. p-Values are shown at the top of the graphs.
Author response image 1.

Update of

References

    1. Akin EJ, Alsaloum M, Higerd GP, Liu S, Zhao P, Dib-Hajj FB, Waxman SG, Dib-Hajj SD. Paclitaxel increases axonal localization and vesicular trafficking of Nav1.7. Brain. 2021;144:1727–1737. doi: 10.1093/brain/awab113. - DOI - PMC - PubMed
    1. Alexander SPH, Mathie A, Peters JA, Veale EL, Striessnig J, Kelly E, Armstrong JF, Faccenda E, Harding SD, Pawson AJ, Sharman JL, Southan C, Davies JA, CGTP Collaborators The concise guide to pharmacology 2019/20: Ion channels. British Journal of Pharmacology. 2019;176 Suppl 1:S142–S228. doi: 10.1111/bph.14749. - DOI - PMC - PubMed
    1. Andrews TJ, Cowen T. In vivo infusion of NGF induces the organotypic regrowth of perivascular nerves following their atrophy in aged rats. The Journal of Neuroscience. 1994;14:3048–3058. doi: 10.1523/JNEUROSCI.14-05-03048.1994. - DOI - PMC - PubMed
    1. Andrews TJ, Thrasivoulou C, Nesbit W, Cowen T. Target-specific differences in the dendritic morphology and neuropeptide content of neurons in the rat SCG during development and aging. The Journal of Comparative Neurology. 1996;368:33–44. doi: 10.1002/(SICI)1096-9861(19960422)368:13.0.CO;2-L. - DOI - PubMed
    1. Balasubramanian P, Branen L, Sivasubramanian MK, Monteiro R, Subramanian M. Aging is associated with glial senescence in the brainstem - implications for age-related sympathetic overactivity. Aging. 2021;13:13460–13473. doi: 10.18632/aging.203111. - DOI - PMC - PubMed

MeSH terms