. 2025 May;398(5):5955-5967.
doi: 10.1007/s00210-024-03608-4. Epub 2024 Dec 3.

Oxyresveratrol and/or Dapagliflozin Attenuate Doxorubicin-Induced Nephrotoxicity via Modulation of PPAR-γ/Nrf-2/HO-1, NF-κB/TNF-α/Keap-1, and Bcl-2/Caspase-3/ATG-5 signaling pathways in rats

Affiliations

Oxyresveratrol and/or Dapagliflozin Attenuate Doxorubicin-Induced Nephrotoxicity via Modulation of PPAR-γ/Nrf-2/HO-1, NF-κB/TNF-α/Keap-1, and Bcl-2/Caspase-3/ATG-5 signaling pathways in rats

Waleed S M El-Sawy et al. Naunyn Schmiedebergs Arch Pharmacol. 2025 May.

Abstract

Purpose: Among the most undesirable effects that lead to the restriction of doxorubicin (DOX) use in chemotherapy is kidney damage. This research aimed to assess the possible defenses against DOX-induced nephrotoxicity offered by oxyresveratrol (ORES) and/or dapagliflozin (DAPA).

Methods: Five groups of eight male Swiss albino rats each were created from a total of sixty-four. One intravenous injection of DOX (10 mg/kg) was given into the tail vein on the fourteenth day of the experiment; in the meantime, ORES (80 mg/kg) and DAPA (10 mg/kg) were given orally 14 days prior to the DOX injection and 2 days following the DOX injection.

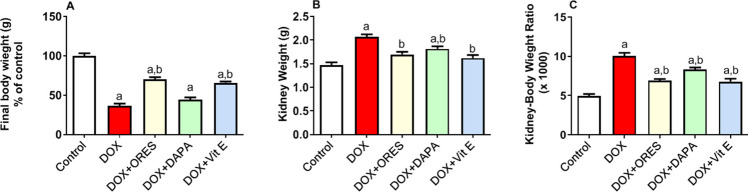
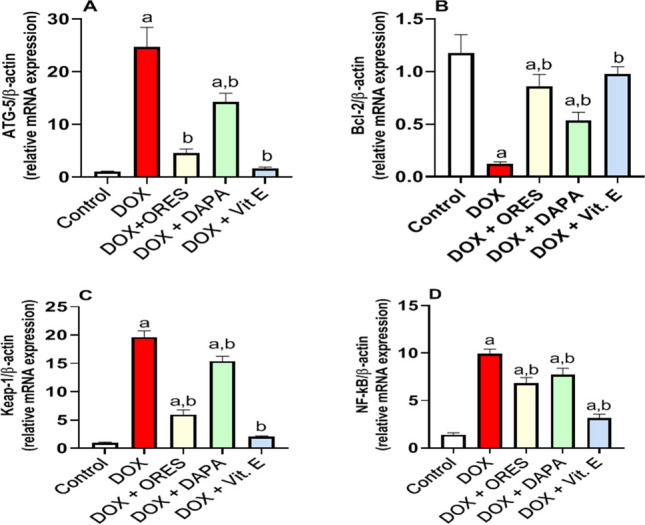
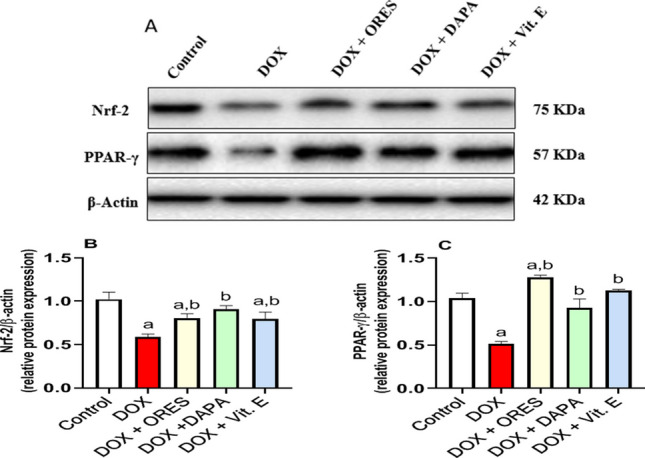
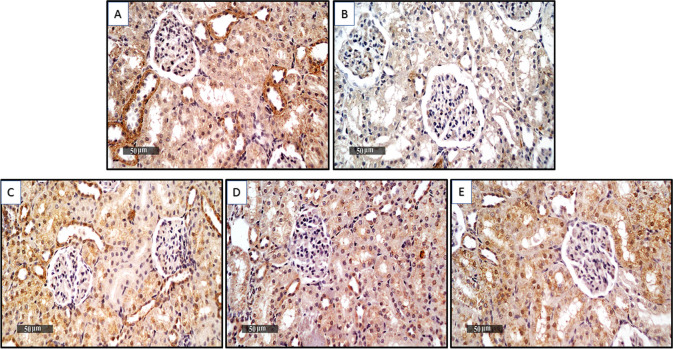
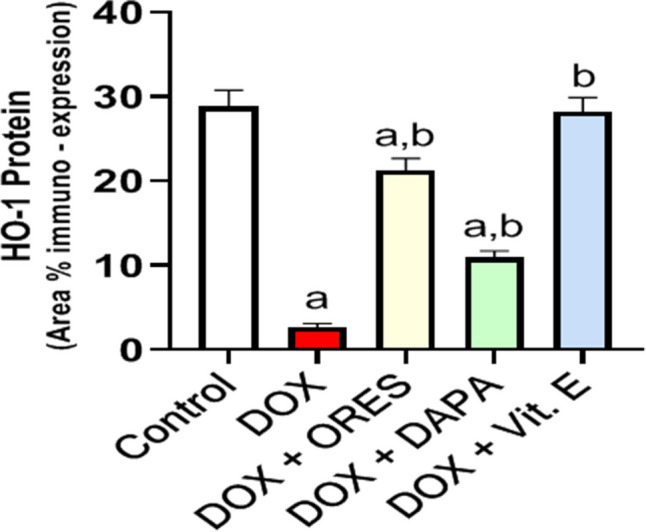
Results: In rats given DOX, ORES and/or DAPA both successfully reduced the kidney weight, kidney/bodyweight ratio, and blood levels of creatinine, uric acid, and urea. They also increased final body weight and albumin serum levels. Additionally, lower serum concentrations of TNF-α and IL-6 were noted, along with a lower kidney content of caspase-3. Furthermore, the expression of the Bcl-2 gene was upregulated, as were the Nrf-2, PPAR-γ, and HO-1 proteins, and there was a downregulation of the ATG-5, Keap-1, and NF-κB renal gene expression. These findings support a decrease in oxidative stress and relief of histopathological alterations.

Conclusion: The current study's findings suggest that ORES and/or DAPA pretreatment could be a viable therapeutic approach to ameliorate DOX-induced nephrotoxicity.

Keywords: Chemotherapy; Dapagliflozin; Doxorubicin; Nephrotoxicity; Oxyresveratrol.


Conflict of interest statement

Declarations. Competing interests: The authors declare no competing interests. Ethical approval: The National Institutes of Health’s Guidelines for the Use and Care of Laboratory Animals (NIH Publications No. 8023, amended 1978) and the ethical standards for using animals in research were followed when conducting the study. Permission No. AZ/AS/PHREC/35/2023 was granted by the Ethics Council of the Faculty of Pharmacy at Al-Azhar University, Assiut Branch, Egypt, for the research projects.

Figures

Fig. 1
Fig. 1
Effects of ORES, DAPA, and Vit. E administration on kidney weight (B), kidney-to body weight ratio (C), and final body weight (A) in rats given DOX The data were displayed as means ± SEM. Using one-way ANOVA and Tukey's test for multiple comparisons across groups at p < 0.05, the results were shown to be: a Significantly different from the control saline group; b Significantly different from the DOX-administered group.
Fig. 2
Fig. 2
Impact of ORES, DAPA, and Vit. E therapy on renal gene expression levels in rats administered DOX A representative graph of gene expression level analysis shows ATG-5 mRNA (A), Bcl-2 mRNA (B), Keap-1 mRNA (C), and NF-kB mRNA (D). The data were displayed as means ± SEM. Using one-way ANOVA and Tukey's test for multiple comparisons across groups at p < 0.05, the results were shown to be:a Significantly different from the control saline group; b Significantly different from the DOX-administered group
Fig. 3
Fig. 3
Effect of ORES, DAPA, and Vit. E treatment on renal protein expression levels in DOX-administered rats The upper two panels display the level of Nrf-2 and PPAR-γ protein expression statistical analysis (B and C), respectively, while the upper panel displays the representative gel of the corresponding protein analysis normalized to β-actin (A). The data were displayed as means ± SEM. Using one-way ANOVA and Tukey's test for multiple comparisons across groups at p < 0.05, the results were shown to be: a Significantly different from the control saline group; Significantly different from the DOX-administered group
Fig. 4
Fig. 4
Effect of ORES, DAPA, and Vit. E administration on kidney tissue histological results in rats administered DOX Kidney segments stained with H & E X 400 in photomicrographs. (A) Normal control samples, intact tubular epithelium (black arrow). (B) DOX-administered rats, cytoplasmic vacuolization (red arrow), interstitial mononuclear inflammatory cell infiltrate (arrow head). (C) DOX + ORES-treated rats, intact tubular segments (black arrow), tubular degenerative changes (red arrow), inflammatory cell infiltrates (arrow head). (D) DOX + DAPA-treated rats, tubular degenerative changes (red arrow), inflammatory cell infiltrates (arrow head). (E) DOX + Vit. E-treated rats, intact tubular segments (black arrow), sporadic occasional degenerative changes (red arrow).
Fig. 5
Fig. 5
Effect of ORES, DAPA, and Vit. E treatment on HO-1 immunohistochemistry staining level in rats given DOX The DOX sections demonstrated a significant decrease in the expression level of HO-1 protein (Figure 5(B)), while the DOX + ORES, DOX + DAPA, and DOX + Vit. E sections demonstrated a significant increase in the expression levels of HO-1 (Figure 5(C, D, and E)). The normal control section displayed the expression level of prevalent HO-1 protein (Figure 5 (A))
Fig. 6
Fig. 6
Effect of treatment with ORES, DAPA, and Vit. E on quantitative immune-expression analysis of HO-1 protein level in DOX-administered rats A graph of the quantitative immune-expression level analysis shows the HO-1 protein statistical analysis. The data were displayed as means ± SEM. Using one-way ANOVA and Tukey's test for multiple comparisons across groups at p < 0.05, the results were shown to be: a Significantly different from the control saline group; b Significantly different from the DOX-administered group

References

    1. Abdel-Wahab AF, Bamagous GA, Al-Harizy RM, ElSawy NA, Shahzad N, Ibrahim IA, Al Ghamdi SS (2018) Renal protective effect of SGLT2 inhibitor dapagliflozin alone and in combination with irbesartan in a rat model of diabetic nephropathy. Biomed Pharmacother 103:59–66. 10.1016/j.biopha.2018.03.176 - PubMed
    1. Aboonabi A, Aboonabi A (2020) Anthocyanins reduce inflammation and improve glucose and lipid metabolism associated with inhibiting nuclear factor-kappab activation and increasing PPAR-γ gene expression in metabolic syndrome subjects. Free Radic Biol Med 150:30–39. 10.1016/j.freeradbiomed.2020.02.004 - PubMed
    1. Ali N, AlAsmari AF, Imam F, Ahmed MZ, Alqahtani F, Alharbi M, Alswayyed M, AlAsmari F, AlAsmari M, Alshammari A, Fantoukh OI, Alanazi MM (2021) Protective effect of diosmin against doxorubicin-induced nephrotoxicity. Saudi J Biol Sci 28:4375–4383. 10.1016/j.sjbs.2021.04.030 - PMC - PubMed
    1. Aydin S (2015) A short history, principles, and types of ELISA, and our laboratory experience with peptide/protein analyses using ELISA. Peptides 72:4–15. 10.1016/j.peptides.2015.04.012 - PubMed
    1. Basak P, Sadhukhan P, Sarkar P, Sil PC (2017) Perspectives of the Nrf-2 signaling pathway in cancer progression and therapy. Toxicol Rep 4:306–318. 10.1016/j.toxrep.2017.06.002 - PMC - PubMed

MeSH terms

Substances