. 2024 Dec 3;81(1):476.
doi: 10.1007/s00018-024-05512-9.

Potential compensatory mechanisms preserving cardiac function in myotubular myopathy

Affiliations

Potential compensatory mechanisms preserving cardiac function in myotubular myopathy

Alix Simon et al. Cell Mol Life Sci. .

Abstract

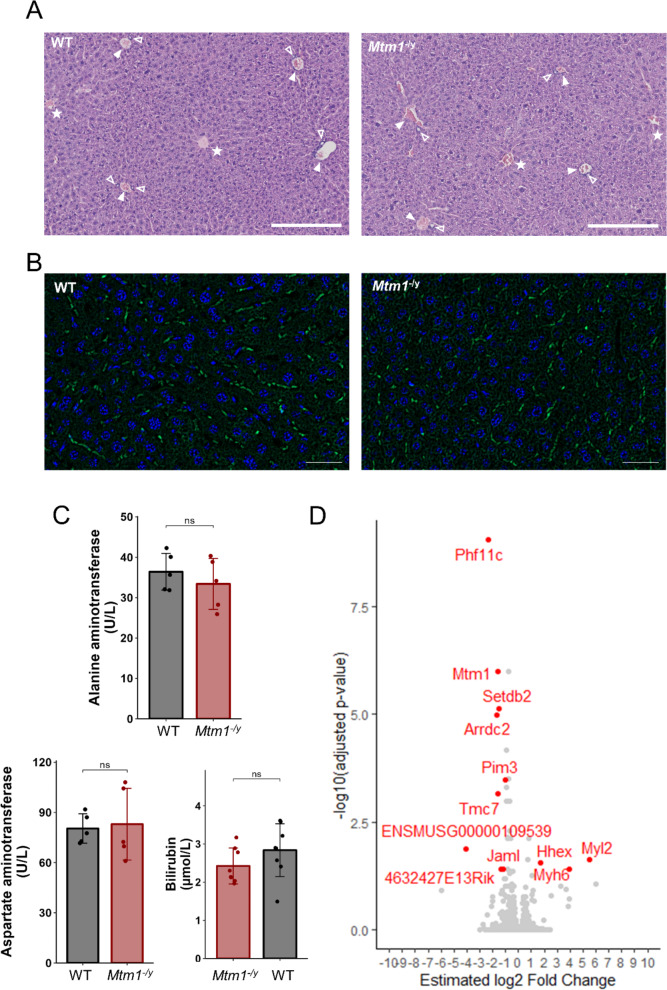
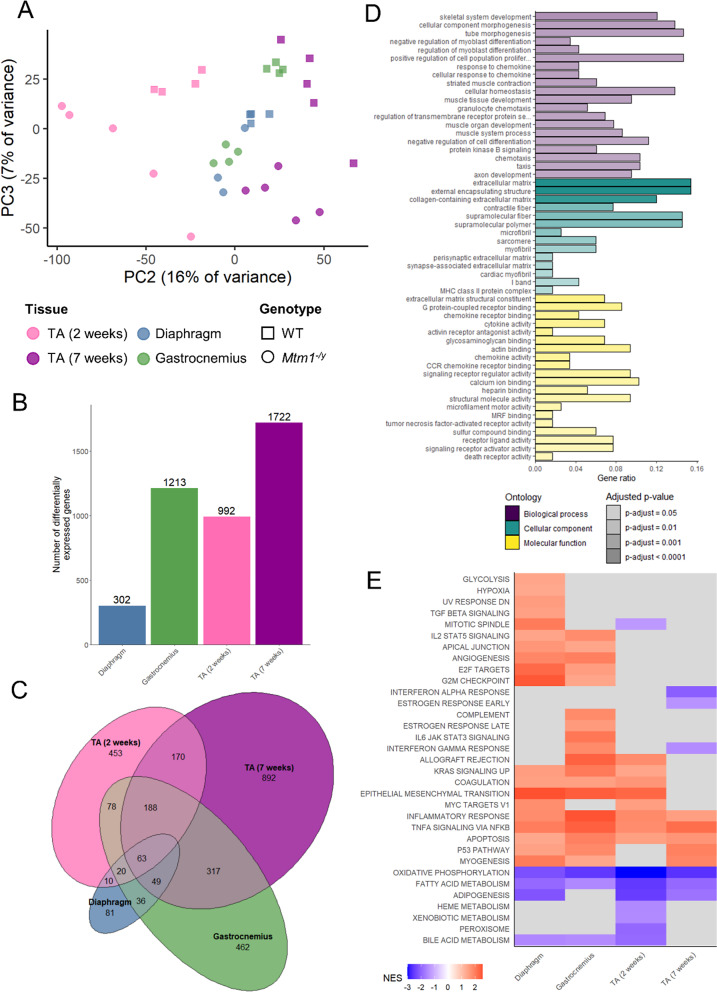
X-Linked myotubular myopathy (XLMTM) is characterized by severe skeletal muscle weakness and reduced life expectancy. The pathomechanism and the impact of non-muscular defects affecting survival, such as liver dysfunction, are poorly understood. Here, we investigated organ-specific effects of XLMTM using the Mtm1-/y mouse model. We performed RNA-sequencing to identify a common mechanism in different skeletal muscles, and to explore potential phenotypes and compensatory mechanisms in the heart and the liver. The cardiac and hepatic function and structural integrity were assessed both in vivo and in vitro. Our findings revealed no defects in liver function or morphology. A disease signature common to several skeletal muscles highlighted dysregulation of muscle development, inflammation, cell adhesion and oxidative phosphorylation as key pathomechanisms. The heart displayed only mild functional alterations without obvious structural defects. Transcriptomic analyses revealed an opposite dysregulation of mitochondrial function, cell adhesion and beta integrin trafficking pathways in cardiac muscle compared to skeletal muscles. Despite this dysregulation, biochemical and cellular experiments demonstrated that these pathways were strongly affected in skeletal muscle and normal in cardiac muscle. Moreover, biomarkers reflecting the molecular activity of MTM1, such as PtdIns3P and dynamin 2 levels, were increased in the skeletal muscles but not in cardiac muscle. Overall, these data suggest a compensatory mechanism preserving cardiac function, pointing to potential therapeutic targets to cure the severe skeletal muscle defects in XLMTM.

Keywords: Centronuclear myopathy; Dynamin; Integrin; Myotubularin; Omics; Phosphoinositides.


Conflict of interest statement

Declarations. Ethics approval: All procedures involving animals followed the European directive 2010/63/EU of September 22, 2010, and ethical approval was granted by the Ethics Committee of the French ministry for Research (APAFIS#4469-2016031110589922, APAFIS #35398-2022021019049942). Competing interests: The authors have no relevant financial or non-financial interests to disclose.

Figures

Fig. 1
Fig. 1
The effect of XLMTM on gene expression is highly organ-specific. Exploratory data analysis and differential gene expression analysis of RNA-seq data of liver, heart, diaphragm and gastrocnemius samples taken from WT and Mtm1−/y mice at 5 weeks. A Principal component analysis, principal components 1 and 2 are shown. B Unsupervised hierarchical clustering based on sample-to-sample similarity. C Bar plot showing the number of DEGs between WT and Mtm1−/y samples for each tissue. D Venn diagram illustrating the number of common and specific DEGs across tissues
Fig. 2
Fig. 2
The Mtm1−/y mouse model shows no liver defects. A Representative liver histology of WT and Mtm1−/y mice (H&E). Stars indicate central veins, full arrows indicate portal veins, and empty arrows indicate bile ducts. Scale bars 250 μm. B Representative immunofluorescent staining images of BSEP (green) and nuclei (DAPI, blue) in liver of WT and Mtm1−/y mice. Scale bars 50 μm. C Bar charts showing levels of alanine aminotransferase (top) and aspartate aminotransferase (bottom left) and bilirubin (bottom right) in serum of WT and Mtm1−/y mice. Student’s t-test: ns: P > 0.05. D Volcano plot showing the 12 DEGs in liver
Fig. 3
Fig. 3
Comparison of 3 skeletal muscles reveals a common disease signature. Exploratory data analysis and differential gene expression analysis of RNA-seq data of several skeletal muscles: diaphragm and gastrocnemius samples (5 weeks) and TA samples (2 and 7 weeks) taken from WT and Mtm1−/y mice. A Principal component analysis, principal components 2 and 3 are shown. B Bar plot showing the number of DEGs between WT and Mtm1−/ysamples for each muscle. C Proportional Venn diagram illustrating the number of common and specific DEGs across muscles. D Most significant GO terms obtained from over-representation analysis of the 132 DEGs common to all muscles. E GSEA results of the “Hallmarks” gene sets obtained from the mouse collection of the Molecular Signature Database in the skeletal muscles. Red and blue respectively indicate statistically significant positive and negative normalized enrichment scores (NES)
Fig. 4
Fig. 4
Myogenic development is impaired in the skeletal muscles of Mtm1−/ymice. A Myh3 transcript relative expression. B Representative immunofluorescent staining images of the embryonic myosin (MYH3, green) and WGA (pink) in the tibialis anterior and the gastrocnemius (left), and MYH3 signal intensity quantification (right). Scale bars 50 μm. C Mstn transcript relative expression. D Fst transcript relative expression. For panels A, C, and D, transcript expression levels were obtained by RT-qPCR from tibialis anterior (2 weeks and 7 weeks), gastrocnemius and diaphragm (5 weeks) Mtm1−/y and WT samples, and are shown as relative expression compared to the average of the WT. ns P > 0.05, *P < 0.05, **P < 0.01, ***P < 0.001
Fig. 5
Fig. 5
The Mtm1−/y mouse heart shows no structural defects but is affected at the transcriptomic level. A Representative heart histology of WT and Mtm1−/y mice (H&E). Scale bars 100 μm. B Representative heart electron microscopy of WT and Mtm1−/y mice (H&E). Scale bars 2 μm. C PCA plot of heart samples, PC1 and PC4 are shown. D Volcano plot showing the 68 DEGs in heart. E Subset of the GSEA results based on Molecular Signature Database Hallmarks, Reactome pathways, and GO terms gene sets in cardiac and skeletal muscles. Red and blue respectively indicate statistically significant positive and negative normalized enrichment scores (NES)
Fig. 6
Fig. 6
Investigation of the pathways inversely dysregulated in the heart compared to the skeletal muscles. A ROS quantification with DHE assay in tibialis anterior (TA), gastrocnemius and heart. Representative fluorescent images (left) and ROS signal intensity quantification (right). Same scale for all images, scale bar 20 μm. B Protein level of SOD2 in TA, diaphragm, gastrocnemius and heart of WT and Mtm1−/y mice (n = 6) obtained by western blotting with standardization by Ponceau red staining. The fold difference from the average of the WT is shown. C Representative immunofluorescent staining images of laminin (left) and signal intensity quantification in a 2 μm-wide pericellular region (right) in tibialis anterior (TA), gastrocnemius and heart. Same scale for all images, scale bar 20 μm. D Representative immunofluorescent staining images of integrin β1 in TA and heart. Arrows indicate examples of fibers showing abnormal localization of integrin β1. Scale bars 20 μm. E Quantification of fibers with abnormal integrin β1 localization in TA and heart (n = 4). Mtm1−/y and WT littermates samples were taken at 7 weeks for all panels. Student’s t-test: ns P > 0.05, *P < 0.05, **P < 0.01, ***P < 0.001
Fig. 7
Fig. 7
Investigation of PtdIns3P and DNM2 levels in the heart and TA. A PtdIns3P level in Mtm1−/y TA and heart as the fold difference from the average of the WT at 7 weeks. B Protein level of DNM2 in tibialis anterior (TA) and heart of WT and Mtm1−/y mice (n = 6) obtained by western blotting with standardization by Ponceau red staining in Mtm1−/y and WT mice at 7 weeks, represented as the fold difference from the average of the WT. Student’s t-test: *P < 0.05, **P < 0.01, ***P < 0.001

References

    1. Laporte J, Hu LJ, Kretz C et al (1996) A gene mutated in X-linked myotubular myopathy defines a new putative tyrosine phosphatase family conserved in yeast. Nat Genet 13:175–182. 10.1038/ng0696-175 - PubMed
    1. Gómez-Oca R, Cowling BS, Laporte J (2021) Common pathogenic mechanisms in Centronuclear and myotubular myopathies and latest treatment advances. Int J Mol Sci 22:11377. 10.3390/ijms222111377 - PMC - PubMed
    1. Lionello VM, Nicot A-S, Sartori M et al (2019) Amphiphysin 2 modulation rescues myotubular myopathy and prevents focal adhesion defects in mice. Sci Transl Med 11:eaav1866. 10.1126/scitranslmed.aav1866 - PubMed
    1. Ketel K, Krauss M, Nicot A-S et al (2016) A phosphoinositide conversion mechanism for exit from endosomes. Nature 529:408–412. 10.1038/nature16516 - PubMed
    1. Graham RJ, Muntoni F, Hughes I et al (2020) Mortality and respiratory support in X-linked myotubular myopathy: a RECENSUS retrospective analysis. Arch Dis Child 105:332–338. 10.1136/archdischild-2019-317910 - PMC - PubMed

MeSH terms