. 2025 Feb 6;34(2):234-245.
doi: 10.1158/1055-9965.EPI-24-1247.

Evaluation of Multiple Breast Cancer Polygenic Risk Score Panels in Women of Latin American Heritage

Affiliations

Evaluation of Multiple Breast Cancer Polygenic Risk Score Panels in Women of Latin American Heritage

Xiaosong Huang et al. Cancer Epidemiol Biomarkers Prev. .

Abstract

Background: A substantial portion of the genetic predisposition for breast cancer is explained by multiple common genetic variants of relatively small effect. A subset of these variants, which have been identified mostly in individuals of European (EUR) and Asian ancestries, have been combined to construct a polygenic risk score (PRS) to predict breast cancer risk, but the prediction accuracy of existing PRSs in Hispanic/Latinx individuals (H/L) remain relatively low. We assessed the performance of several existing PRS panels with and without addition of H/L-specific variants among self-reported H/L women.

Methods: PRS performance was evaluated using multivariable logistic regression and the area under the ROC curve.

Results: Both EUR and Asian PRSs performed worse in H/L samples compared with original reports. The best EUR PRS performed better than the best Asian PRS in pooled H/L samples. EUR PRSs had decreased performance with increasing Indigenous American (IA) ancestry, while Asian PRSs had increased performance with increasing IA ancestry. The addition of two H/L SNPs increased performance for all PRSs, most notably in the samples with high IA ancestry, and did not impact the performance of PRSs in individuals with lower IA ancestry.

Conclusions: A single PRS that incorporates risk variants relevant to the multiple ancestral components of individuals from Latin America, instead of a set of ancestry-specific panels, could be used in clinical practice.

Impact: The results highlight the importance of population-specific discovery and suggest a straightforward approach to integrate ancestry-specific variants into PRSs for clinical application.


Conflict of interest statement

E.M. John reports grants from the NIH during the conduct of the study. L.H. Kushi reports grants from the NIH during the conduct of the study. L. Fejerman reports grants from the NIH and Precision Medicine Initiative Office of the Governor during the conduct of the study and grants from Gilead Corporation outside the submitted work. No disclosures were reported by the other authors.

Figures
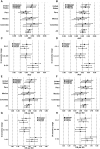
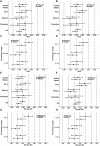
Figure 1.
Figure 1.
Association between PRSs from three EUR SNP panels (and modified panels with addition of two H/L SNPs) and breast cancer risk in H/L samples stratified by countries or IA genetic ancestry. Area under the ROC curve (AUC) or OR were calculated according to Statistical analyses in Materials and Methods. A, AUC of EUR PRS panels tested in H/L samples stratified by countries, (B) AUC of EUR PRS panels modified with addition of two H/L SNPs tested in H/L samples stratified by countries, (C) AUC of EUR PRS panels tested in H/L samples stratified by IA ancestry ranges, (D) AUC of EUR PRS panels modified with addition of two H/L SNPs tested in H/L samples stratified by IA ancestry ranges, (E) OR of EUR PRS panels tested in H/L samples stratified by countries, (F) OR of EUR PRS panels modified with addition of two H/L SNPs tested in H/L samples stratified by countries, (G) OR of EUR PRS panels tested in H/L samples stratified by IA ancestry ranges, and (H) OR of EUR PRS panels modified with addition of two H/L SNPs tested in H/L samples stratified by IA ancestry ranges. Error bars represent the 95% CI.
Figure 2.
Figure 2.
Association between PRSs from tested PRS panels with overall breast cancer risk in H/L samples relative to the middle quantile (40%–60%). A, the three EUR PRS panels, (B) the three PRS panels modified from EUR panels (with addition of two H/L SNPs), (C) the two Asian PRS panels, and (D) the two PRS panels modified from Asian panels (with addition of two H/L SNPs). Error bars represent the 95% CI.
Figure 3.
Figure 3.
Calibration of PRSs from tested PRS panels. The graph depicts the predicted vs. observed proportions of cases within each decile of the log-normalized PRS. Calibration plots for (A, B, and C) the three EUR PRS panels and the three PRS panels modified from the EUR panels (with addition of two H/L SNPs), and plots for (D and E) the two Asian PRS panels and the two PRS panels modified from Asian panels (with addition of two H/L SNPs). Error bars represent the 95% CI.
Figure 4.
Figure 4.
Association between PRSs from two Asian SNP panels (and modified panels with addition of two H/L SNPs) and breast cancer risk in H/L samples stratified by countries or IA genetic ancestry. Area under the ROC curve (AUC) or OR were calculated according to Statistical analyses in Materials and Methods. A, AUC of Asian PRS panels tested in H/L samples stratified by countries, (B) AUC of Asian PRS panels modified with addition of two H/L SNPs tested in H/L samples stratified by countries, (C) AUC of Asian PRS panels tested in H/L samples stratified by IA ancestry ranges, (D) AUC of Asian PRS panels modified with addition of two H/L SNPs tested in H/L samples stratified by IA ancestry ranges, (E) OR of Asian PRS panels tested in H/L samples stratified by countries, (F) OR of Asian PRS panels modified with addition of two H/L SNPs tested in H/L samples stratified by countries, (G) OR of Asian PRS panels tested in H/L samples stratified by IA ancestry ranges, and (H) OR of Asian PRS panels modified with addition of two H/L SNPs tested in H/L samples stratified by IA ancestry ranges. Error bars represent the 95% CI.

References

    1. Sedeta E, Sung H, Laversanne M, Bray F, Jemal A. Recent mortality patterns and time trends for the major cancers in 47 countries worldwide. Cancer Epidemiol Biomarkers Prev 2023;32:894–905. - PubMed
    1. Mucci LA, Hjelmborg JB, Harris JR, Czene K, Havelick DJ, Scheike T, et al. . Familial risk and heritability of cancer among twins in Nordic countries. JAMA 2016;315:68–76. - PMC - PubMed
    1. Mavaddat N, Pharoah PDP, Michailidou K, Tyrer J, Brook MN, Bolla MK, et al. . Prediction of breast cancer risk based on profiling with common genetic variants. J Natl Cancer Inst 2015;107:djv036. - PMC - PubMed
    1. Mavaddat N, Michailidou K, Dennis J, Lush M, Fachal L, Lee A, et al. . Polygenic risk scores for prediction of breast cancer and breast cancer subtypes. Am J Hum Genet 2019;104:21–34. - PMC - PubMed
    1. Adedokun B, Du Z, Gao G, Ahearn TU, Lunetta KL, Zirpoli G, et al. . Cross-ancestry GWAS meta-analysis identifies six breast cancer loci in African and European ancestry women. Nat Commun 2021;12:4198. - PMC - PubMed