. 2024 Dec 3;135(3):e183409.
doi: 10.1172/JCI183409.

Vascular smooth muscle cell PRDM16 regulates circadian variation in blood pressure

Affiliations

Vascular smooth muscle cell PRDM16 regulates circadian variation in blood pressure

Zhenguo Wang et al. J Clin Invest. .

Abstract

Disruptions of blood pressure (BP) circadian variation are closely associated with an increased risk of cardiovascular disease. Thus, gaining insights into the molecular mechanisms of BP circadian variation is essential for comprehending BP regulation. Human genetic analyses suggest that PR domain-containing protein 16 (PRDM16), a transcription factor highly expressed in vascular smooth muscle cells (VSMCs), is significantly associated with BP-related traits. However, the roles of PRDM16 in BP regulation are largely unknown. Here, we demonstrate that BP in VSMC-specific Prdm16-KO (Prdm16SMKO) mice was significantly lower than that in control mice during the active period, resulting in aberrant BP circadian variation. Mesenteric artery rings from Prdm16SMKO mice showed a reduced response to phenylephrine. Mechanistically, we identified adrenergic receptor α 1d (Adra1d) as a transcriptional target of PRDM16. Notably, PRDM16 exhibited a remarkable circadian expression pattern and regulated the expression of clock genes, particularly Npas2, which is crucial for BP circadian variation regulation. Consequently, PRDM16 deficiency in VSMCs caused disrupted BP circadian variation through a reduced response to adrenergic signaling and clock gene regulation. Our findings provide insights into the intricate molecular pathways that govern circadian fluctuations in BP.

Keywords: Cardiovascular disease; Hypertension; Vascular biology.


Conflict of interest statement

Conflict of interest: The authors have declared that no conflict of interest exists.

Figures

Figure 1
Figure 1. Predominant expression of PRDM16 in VSMCs and its gene-level associations with common variants.
(A and B) Uniform manifold approximation and projection (UMAP) results showing higher expression of Prdm16 in smooth muscle cells (SMCs) compared with other cell populations in the aorta and artery by scRNA-Seq analysis of mouse aorta (GEO GSE193265, a total of 22,980 cells were included in this analysis) (A) and human carotid artery (GEO GSE155468 and GEO GSE155512 were integrated for analysis, a total of 15,685 cells were included in this analysis) (B). Fibro, fibroblasts; EC, endothelial cells; Mϕ, macrophages; NK, NK cells; B, B cells; T, T cells. (C) Circular plot shows gene-level phenotypic associations for PRDM16. Data were sourced from the Common Metabolic Diseases Knowledge Portal (https://t2d.hugeamp.org/gene.html?gene=PRDM16), focusing on the “Common Variants Association Table” and “HuGE Scores Table” for group categorization. The data ancestry includes African American or Afro-Caribbean, African unspecified, Asian, European, Greater Middle Eastern, Hispanic or Latin American, and Sub-Saharan African. After filtering out phenotypes with sample sizes of 100,000 or fewer and keeping the cardiometabolic disease–related traits, 59 phenotypes across 5 groups were obtained. The circular plot organizes groups alphabetically and phenotypes within each group by P value. The y axis represents –log10-transformed P values for standardized comparison. A generally accepted threshold for significance of MAGMA results is P ≤ 2.5 × 10⁻⁶ (dashed red circle). The blue color represents the sample size. MI, myocardial infarction; MAP, mean arterial pressure; HF, heart failure; CRP, plasma C-reactive protein; CADinNonT2D, coronary artery disease in individuals without type 2 diabetes; CK, creatine kinase; HR, heart rate; BS, random glucose; HBA1C, hemoglobin A1C; BSandFG, random and fasting glucose; FG, fasting glucose; BSadjFastingTime, random glucose adj fasting time; T2DadjBMI, type 2 diabetes adj BMI; FGadjBMI, fasting glucose adj BMI; T2D, type 2 diabetes; FIadjBMI, fasting insulin adj BMI; HBA1CadjBMI, HBA1C adj BMI; FI, fasting insulin; CHOL, total cholesterol; nonHDL, non-HDL cholesterol; TG, triglycerides; ApoA, serum apolipoprotein A; ApoB, serum apolipoprotein B; TGnonT2D, triglyceride levels in individuals without type 2 diabetes; TGtoHDL, triglyceride-to-HDL ratio; Urage, serum urate; NaExcretion, urinary sodium excretion; UA, urinary albumin; eGFRcreat, serum creatinine; UPCR, urinary potassium-to-creatinine ratio; eGFRcreateNoDiabetes, eGFRcreat in individuals without diabetes; USPR, urinary sodium-to-potassium ratio; eGFRcreateInDiabetes, eGFRcreat in individuals with diabetes; eGFRcreat_med_DeclineAdjDM, eGFRcreat median annual decline adj diabetes status; eGFRcreat_med_DeclineAdjBL, eGFRcreat median annual decline adj baseline; KExcretion, urinary potassium excretion; UACR, urinary albumin-to-creatinine ratio; BUN, blood urea nitrogen; USCR, urinary sodium-to-creatinine ratio; eGFRcys, serum cystatin C; eGFRcreatRapid3, eGFRcreat decline, Rapid3 definition; CKD, chronic kidney disease; toastSAO, toast small artery occlusion; toastLAA, toast large artery atherosclerosis; toastCE, toast cardio-aortic embolism.
Figure 2
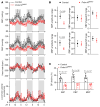
Figure 2. Loss of function of PRDM16 in VSMCs results in nondipping BP.
(A) Radio telemetric measurements of SBP, DBP, HR, and locomotor activity in 16-week-old Prdm16SMKO mice and control mice housed under normal conditions (12-hour light/12-hour dark cycle, 20°C–23°C) with free access to regular chow and water. ZT0 indicates lights on; ZT12 indicates lights off. Gray shadows indicate the nighttime. n = 6. (B) Characterization of SBP and DBP cycles, including amplitude range, wavelength range, and phase-shift range, were determined. n = 6. (C) Declines of SBP, DBP, and mean BP (MBP) in the resting phase relative to the active phase were analyzed. n = 6. Data in AC are presented as the mean ± SEM. P values were determined by 2-tailed Student’s t test.
Figure 3
Figure 3. PRDM16 deficiency leads to a reduced contractile response to PE in mesenteric arteries.
The first-order branches of superior mesenteric arteries were dissected from 10- to 12-week-old male Prdm16SMKO mice and control mice. The vessels were cut into approximately 3 mm long rings, and wire myography was performed to determine the contraction force. (A) Aortic contraction induced by 60 mM KCl. (BE) Concentration response curves were plotted for PE (B), 5-HT (C), PGF2α (D), and U46619 (E). (F and G) The vessels were first stimulated with U46619 to induce contraction, followed by treatment with Ach (F) and SNP (G), and concentration response curves were plotted. n = 6 mice per group. Data are presented as the mean ± SEM. P values were determined by 2-way ANOVA followed by Holm-Šidák multiple-comparison test.
Figure 4
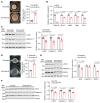
Figure 4. PRDM16 transcriptionally regulates Adra1d expression and adrenoceptor signaling.
(A) The abdominal aorta was isolated from 12-week-old male Prdm16SMKO mice and control mice, and mRNA expression levels of Prdm16 and adrenoceptor α 1a family members, including Adra1a, Adra1b, and Adra1d, were determined by qPCR. n = 5 control mice, n = 6 Prdm16SMKO mice. (B) The thoracic aorta was isolated from 12-week-old male Prdm16SMKO mice and control mice, and MLC20 phosphorylation levels (p-MLC) induced by PE for 3 minutes were determined by Western blotting. Each lane represents pooled lysates from 1–2 mice. MW, molecular weight. (C) Primary VSMCs isolated from rat thoracic aortas were transfected with control siRNA (siCtrl) (10 nM) or siPrdm16 (10 nM) for 48 hours, and relative expression levels of Adra1d were determined by qPCR. n = 6. (D) Representative Western blot gels showing decreased MLC20 phosphorylation levels in cultured VSMCs upon Prdm16 KD by shRNA. n = 4. (E) IGV tracks of PRDM16 ChIP-Seq in primary mouse fibroblasts showing that the Adra1d promoter region contains PRDM16-binding peaks. (F) ChIP-qPCR analysis showing PRDM16 binding to the promoter region of Adra1d in primary mouse VSMCs. n = 3. (G) Luciferase assay in NIH/3T3 cells transfected with Adra1d promoter–driven luciferase reporters and PRDM16 expression plasmids. n = 4. Data are presented as the mean ± SEM. P values were determined by 2-tailed Student’s t test.
Figure 5
Figure 5. PRDM16 is essential for VSMC contractility.
(AC) Primary VSMCs isolated from rat thoracic aortas were infected with lentivirus carrying shRNA (A and C) or transfected with control siRNA (siCtrl) (10 nM) or siPrdm16 (10 nM) (B) for 48 hours. Cells with stable shRNA expression were selected by puromycin. (A) Representative images of the collagen-based contraction assay and quantitative analysis. n = 4. Scale bars: 0.5 cm. (B) Relative expression levels of contractile genes were determined by qPCR. n = 3. (C) Relative protein expression levels were determined by Western blotting; representative gels are shown. n = 6. (D) Representative image of collagen-based contraction assay of cultured VSMCs isolated from rat mesenteric arteries upon Prdm16 KD by shRNA. n = 3. Scale bars: 0.5 cm. (E) Relative protein expression levels in cultured VSMCs isolated from rat mesenteric arteries were determined by Western blotting upon Prdm16 KD by shRNA. n = 3. (F) Expression of contractile markers in the medial layer of thoracic aorta were determined by Western blotting. n = 5. Data are presented as the mean ± SEM. P values were determined by 2-tailed Student’s t test.
Figure 6
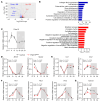
Figure 6. PRDM16 is involved in circadian rhythm regulation.
(A) Volcano plot of the DEGs in thoracic aortas from Prdm16SMKO and control mice (n = 3). Upregulated DEGs are highlighted in red; downregulated DEGs are highlighted in blue. (B) The DEGs were analyzed for GO biological process (GO_BP) enrichment using the Database for Annotation, Visualization, and Integrated Discovery (DAVID), and the top 10 significantly enriched terms are shown. Red bars and blue bars indicate GO_BP results from upregulated DEGs and downregulated DEGs, respectively. (C) Thoracic aortas from 10-week-old male C57/BL6J mice were harvested at 4-hour intervals over a 24-hour period. Prdm16 mRNA expression was determined by qPCR. ZT0 indicates lights on; ZT12 indicates lights off. n = 6 per time point. (DG) The thoracic aortas from 10-week-old male Prdm16SMKO mice and control mice were harvested at 6-hour intervals over a 24-hour period. mRNA expression of canonical clock genes, including (D) Bmal1 and Npas2, (E) Cry1 and Cry2, and (F) Per1, Per2, and Per3, and the (G) PRDM16 transcriptional target gene Adra1d, were determined by qPCR. n = 5–6 per group per time point. Gray shadows in CG indicate the nighttime. Data are presented as the mean ± SEM. P values were determined by 2-way ANOVA followed by Holm-Šidák multiple-comparison test.
Figure 7
Figure 7. PRDM16 regulates the expression of canonical circadian genes.
(A) Genomic distribution of PRDM16-binding sites from PRDM16 ChIP-Seq analysis. (B) HOMER motif analysis of PRDM16-binding sites. The top 6 transcription factors are shown. (C and D) IGV tracks (C) and ChIP-qPCR analysis (D) showing PRDM16 binding to the promoter regions of canonical clock genes. n = 3. (E) Venn diagram showing PRDM16-targeted clock genes. Data are presented as the mean ± SEM. P values were determined by 2-tailed Student’s t test (D).
Figure 8
Figure 8. Interactions among Prdm16, Adra1d, and Npas2:Bmal1.
(AC) Primary VSMCs isolated from rat thoracic aortas were transfected with the indicated siRNA targeting Prdm16, Bmal1, Npas2, and Adra1d (total amounts of siRNA were balanced by the control siRNA) for 48 hours, and expression levels of the indicated genes were determined by qPCR. n = 3–4. Data are presented as the mean ± SEM. P values were determined by 1-way ANOVA followed by Holm-Šidák multiple-comparison test.

Comment in

  • Blood pressure regulation through circadian variation: PRDM16 as a target in vascular smooth muscle cells doi: 10.1172/JCI188784

References

    1. Yano Y, Kario K. Nocturnal blood pressure and cardiovascular disease: a review of recent advances. Hypertens Res. 2012;35(7):695–701. doi: 10.1038/hr.2012.26. - DOI - PubMed
    1. Tang A, et al. Nondipping blood pressure or nocturnal hypertension: does one matter more? Curr Hypertens Rep. 2024;26(1):21–30. doi: 10.1007/s11906-023-01273-1. - DOI - PMC - PubMed
    1. Rapsomaniki E, et al. Blood pressure and incidence of twelve cardiovascular diseases: lifetime risks, healthy life-years lost, and age-specific associations in 1.25 million people. Lancet. 2014;383(9932):1899–1911. doi: 10.1016/S0140-6736(14)60685-1. - DOI - PMC - PubMed
    1. Chellappa SL, et al. Impact of circadian disruption on cardiovascular function and disease. Trends Endocrinol Metab. 2019;30(10):767–779. doi: 10.1016/j.tem.2019.07.008. - DOI - PMC - PubMed
    1. Wenceslau CF, et al. Guidelines for the measurement of vascular function and structure in isolated arteries and veins. Am J Physiol Heart Circ Physiol. 2021;321(1):H77–H111. doi: 10.1152/ajpheart.01021.2020. - DOI - PMC - PubMed

MeSH terms