. 2025 Jan 9;10(1):e182704.
doi: 10.1172/jci.insight.182704.

Repurposing of lonafarnib as a treatment for SARS-CoV-2 infection

Affiliations

Repurposing of lonafarnib as a treatment for SARS-CoV-2 infection

Mohsin Khan et al. JCI Insight. .

Abstract

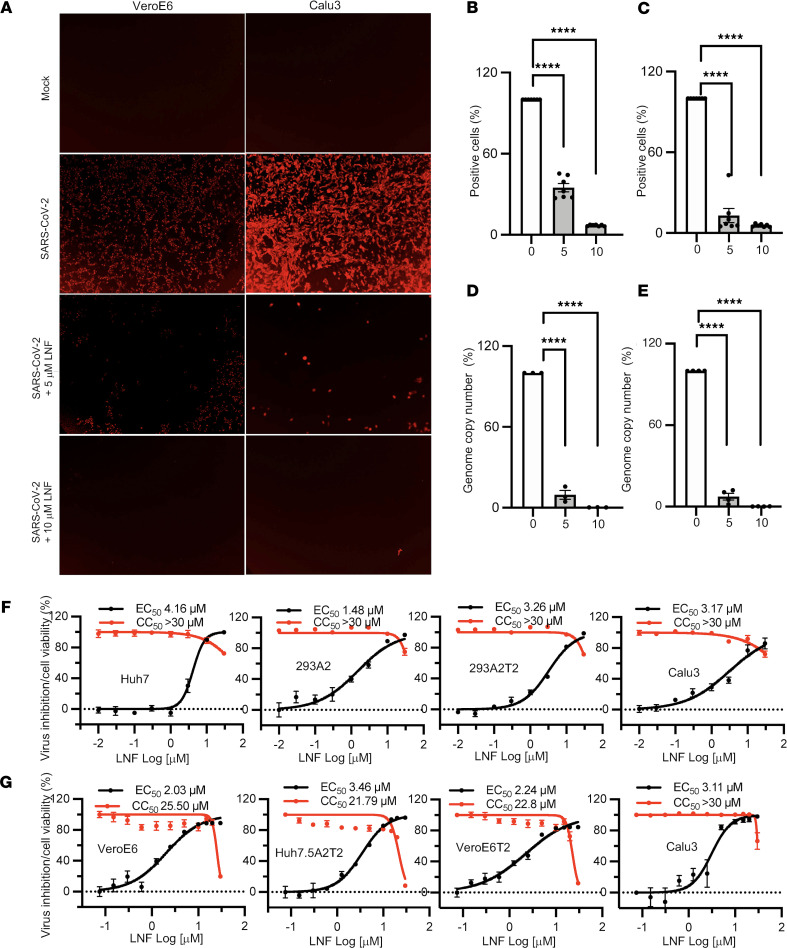
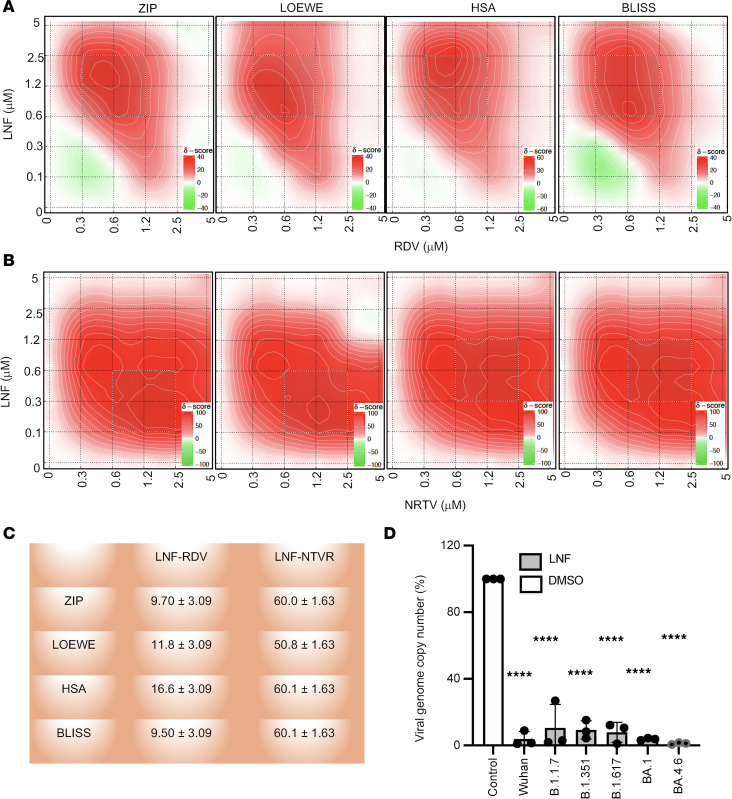
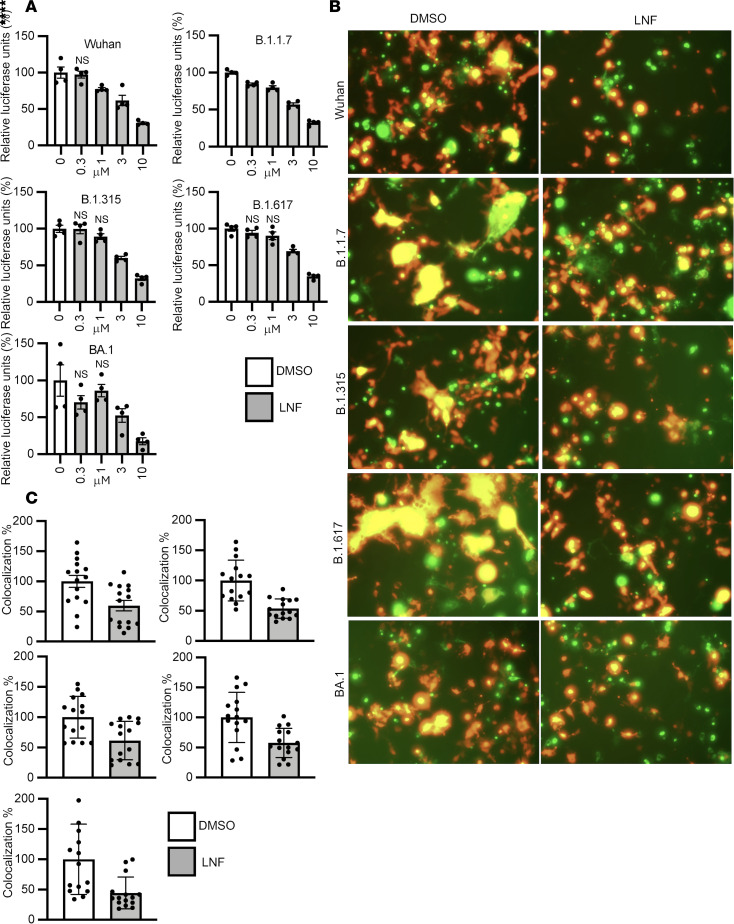
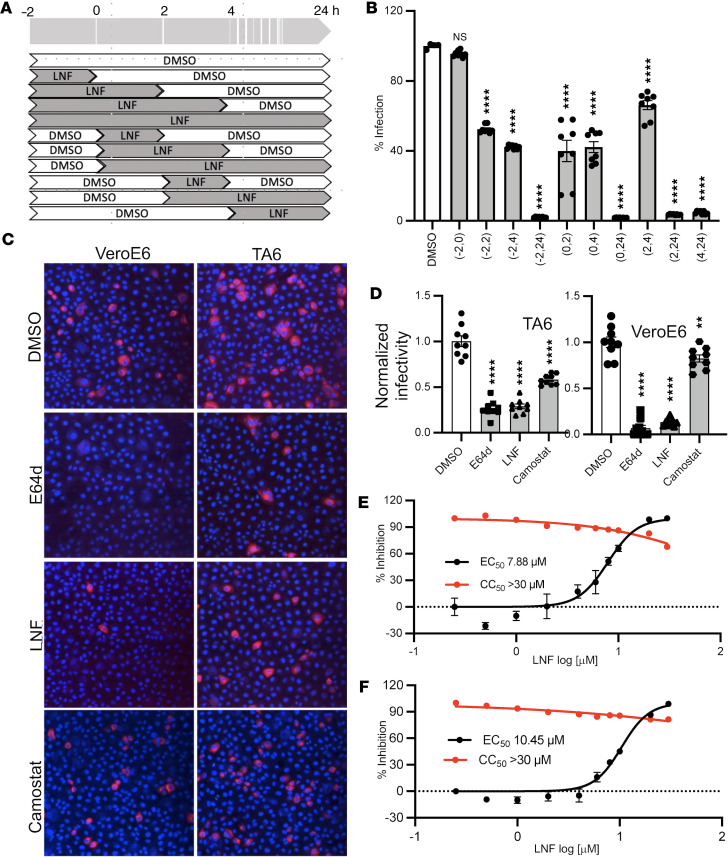
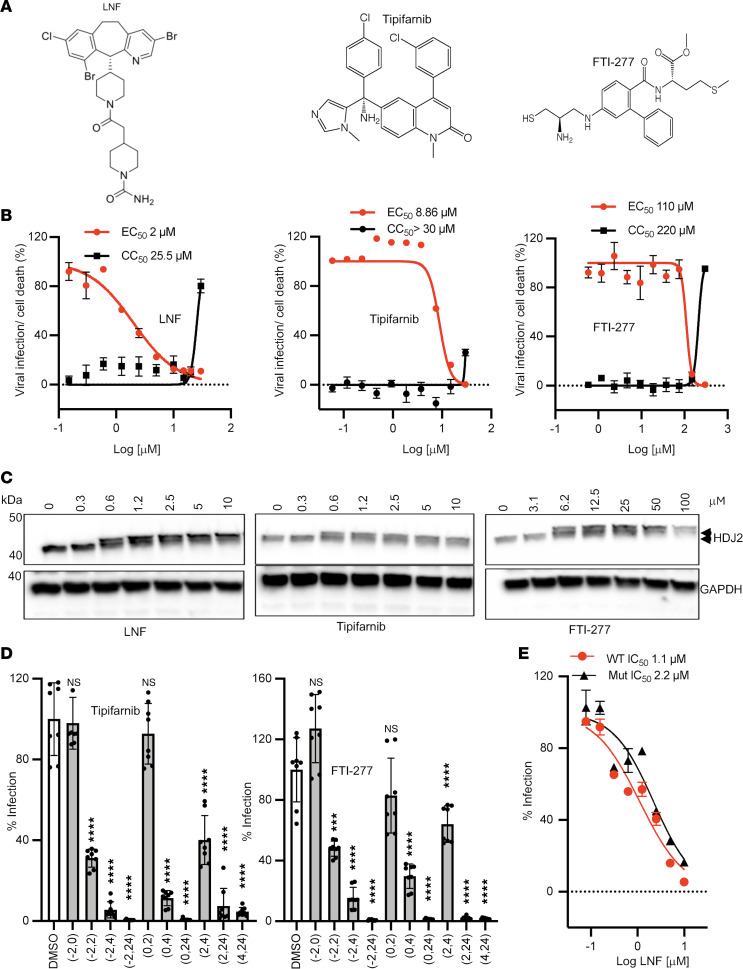
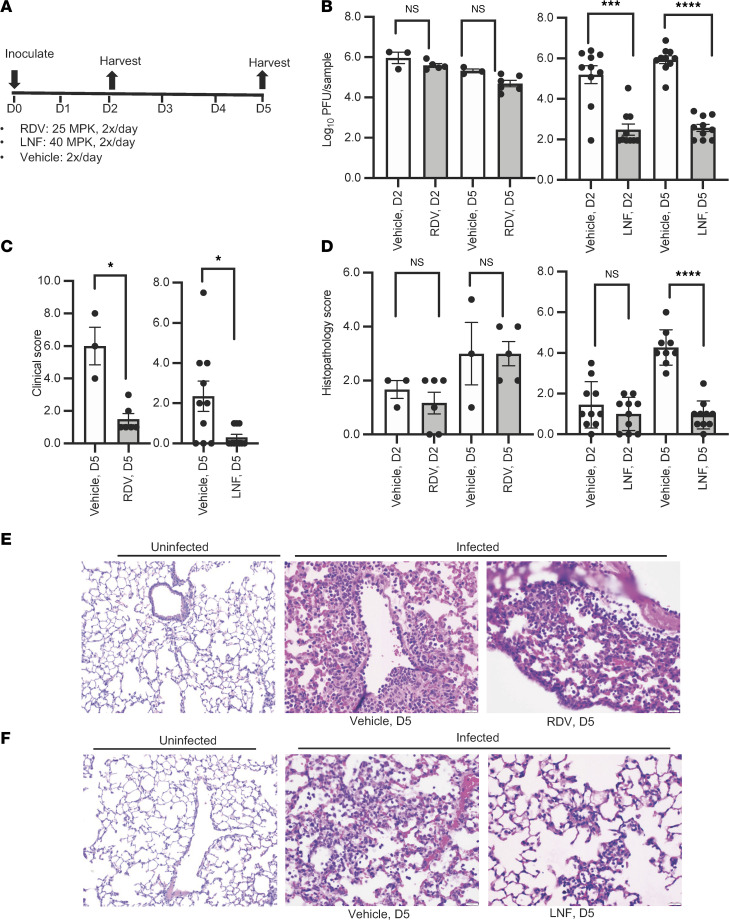
Severe acute respiratory syndrome coronavirus 2 (SARS-CoV-2), which causes coronavirus disease 2019 (COVID-19), has emerged as a global pandemic pathogen with high mortality. While treatments have been developed to reduce morbidity and mortality of COVID-19, more antivirals with broad-spectrum activities are still needed. Here, we identified lonafarnib (LNF), a Food and Drug Administration-approved inhibitor of cellular farnesyltransferase (FTase), as an effective anti-SARS-CoV-2 agent. LNF inhibited SARS-CoV-2 infection and acted synergistically with known anti-SARS antivirals. LNF was equally active against diverse SARS-CoV-2 variants. Mechanistic studies suggested that LNF targeted multiple steps of the viral life cycle. Using other structurally diverse FTase inhibitors and a LNF-resistant FTase mutant, we demonstrated a key role of FTase in the SARS-CoV-2 life cycle. To demonstrate in vivo efficacy, we infected SARS-CoV-2-susceptible humanized mice expressing human angiotensin-converting enzyme 2 (ACE2) and treated them with LNF. LNF at a clinically relevant dose suppressed the viral titer in the respiratory tract and improved pulmonary pathology and clinical parameters. Our study demonstrated that LNF, an approved oral drug with excellent human safety data, is a promising antiviral against SARS-CoV-2 that warrants further clinical assessment for treatment of COVID-19 and potentially other viral infections.

Keywords: COVID-19; Drug screens; Drug therapy; Molecular biology; Virology.


Figures

Figure 1
Figure 1. LNF inhibits SARS-CoV-2 infection.
(A) VeroE6 and Calu3 cells were infected with SARS-CoV-2 and treated with LNF at the time of infection. At 24 hours after infection, cells were fixed and probed with anti-N protein and Alexa Fluor 547–conjugated antibodies. The plates were scanned using an automated plate reader for red fluorescence and images are provided as representative of 28 random areas per treatment group. Original magnification, ×10. (B and C) The percentage of N-positive cells was determined by counting the number of fluorescent cells followed by the total number of the cells in the same area. Total fluorescence counts were normalized by total number of the cells and percentage positivity was calculated. The results are depicted relative to the DMSO-treated group. The data represent mean ± SEM of 7 replicates and the figure is representative of 3 independent experiments. (D and E) VeroE6 and Calu3 cells infected with SARS-CoV-2 were treated with 5 and 10 μM LNF. At 48 hours after infection, intracellular RNA was harvested, and genome copy number was determined by qRT-PCR; data represent percentage genome copy number relative to DMSO-treated control. Each data point represents mean ± SEM (n = 3) and the figure is representative of 3 independent experiments. ****P < 0.0001 by 1-way ANOVA with Dunnett’s test for multiple comparisons to the control (BE). (F) Dose-response curve of LNF using VSV-based SARS-SoV-2-S pseudovirus and live infectious SARS-CoV-2-nLUC (G). Briefly, the infected cells were treated with multiple concentrations of the drug. At 24 hours after infection, luminescent signals were measured using a POLARstar Omega plate reader. EC50 and CC50 values were calculated using Prism 7 software. Each data point represents mean ± SEM (n = 6). The red and black series represent cell viability and viral inhibition, respectively. The results are representative of 3 independent experiments.
Figure 2
Figure 2. Effect of LNF on SARS-CoV-2 variants and LNF synergy with RDV and NRTV.
VeroE6 cells were infected with SARS-CoV-2-nLuc and treated with multiple concentrations of LNF alone and in combination with RDV or NRTV at the time of infection. At 24 hours after infection, the luciferase activity was measured and replication relative to DMSO-treated control was calculated. (A and B) Inhibition of SARS-CoV-2 replication achieved by a combination of varying concentrations of LNF and RDV (A) or NRTV (B). Infected cells were treated with compounds at concentrations ranging from 0–5 μM. Viral infectivity was normalized with the untreated (DMSO) infected cells and percentage of inhibition was calculated. Data represent mean values from 3 independent experiments and contour graphs for ZIP, LOEWE, HSA, and BLISS synergy were plotted using Synergyfinder. (C) The panel summarizes different synergy score statistics for LNF-RDV and LNF-NRTV combinations. The synergy experiments were repeated 2 times. (D) VeroE6 cells were infected with multiple variants of SARS-CoV-2 and cotreated with 10 μM LNF. At 24 hours after infection, total RNA was harvested, and the viral genome copy number was determined by qRT-PCR. The values for the DMSO-treated group were set to 100% and the relative numbers of genome copies were then calculated for the respective LNF-treated groups. The graph values are the mean ± SD of 3 independent experiments. ****P < 0.0001 by 1-way ANOVA with Dunnett’s test for multiple comparisons to the control.
Figure 3
Figure 3. LNF blocks SARS-CoV-2 spike protein–mediated cell-cell fusion.
(A) Cell-cell fusion assays were performed with LNF. The S-SmBit–transfected donor (HeLa) and the LgBit-transfected recipient (293ACE2) cell mixture was treated with 4 different concentrations of LNF (10, 3, 1, and 0.3 μM) and DMSO as control for 48 hours. After incubation, luminescent signals were measured using a POLARstar Omega plate reader. The values are given as relative luciferase signals and each data point is presented as mean ± SEM (n = 4 biological in dependent replicates). NS, P > 0.05; *P < 0.05, ***P < 0.001, ****P < 0.0001 by 1-way ANOVA with Dunnett’s test for multiple comparisons to DMSO control. (B) LNF (10 μM) was used to treat S-GFP–transfected donor (HeLa) and the RFP-transfected recipient (293ACE2) cell mixture for 48 hours. Representative fields are shown. Original magnification, ×10. (C) For quantification, 15 fields were randomly selected from 4 replicates to measure the fused cells under a CellSens fluorescence microscope. ImageJ was used to quantify percentage colocalization signals. White and gray bars represent untreated and treated groups, respectively. **P < 0.01, ***P < 0.0001 by unpaired, 2-tailed t test with Welch’s correction. All results are representative of 3 independent experiments.
Figure 4
Figure 4. Mechanistic studies of LNF’s antiviral action.
(A) Schematic of drug treatment plan, where solid dark and empty areas represent the presence and absence of the drug, respectively. The 0 hour represents the time of infection. DMSO was used as control. (B) VeroE6 cells were infected with SARS-CoV-2 and treated with DMSO or LNF (10 μM) as described in the Methods and schematic in A. The drug was present for the entire duration or removed as per the schematic by replacing with the media containing DMSO only. At 24 hours after infection, the luciferase activity was measured and graphed as percentage replication relative to the untreated, infected control group. Data are presented as mean ± SEM (n = 8) and the figure is representative of at least 3 independent experiments. (C) Representative microscopic images of VeroTA6 cells (top) and VeroE6 (bottom) that were infected at 0.1 MOI for 4 hours and treated with various compounds (10 μM LNF, 5 μM E64d, and 5 μM camostat). The cells were fixed and stained with antibodies against spike protein (red). Original magnification, ×10. (D) The infectivity of virus in the presence of compounds was calculated and normalized to DMSO control. A total of 9 random areas were captured and average infectivity for each treatment group was plotted as mean ± SEM (n = 9). This experiment was conducted 2 times. NS, P > 0.05; **P < 0.01, ****P < 0.0001 by 1-way ANOVA with Dunnett’s test for multiple comparisons to DMSO control (B and D). (E and F) The SARS-CoV-2 replicon and RNA delivery particles (RDPs) were used to prepare the dose-response curve for LNF. For replicon (E), Huh7.5 cells were electroporated with the Gluc replicon and treated with multiple concentrations of LNF. After 24 hours, Gluc signal was measured and normalized to vehicle control. The representative graph shows mean values of 3 replicates and error bars indicate SEM (n = 4). For RDP assay (F), RDPs were generated by trans complementation of the SARS-CoV-2 replicon with S protein in producer cells. Huh7.5 ACE-TMPRSS2 cells were then transduced with the Gluc RDPs and treated with multiple concentrations of LNF. Twenty-four hours later, Gluc activity was measured and normalized. The data represent mean values of 3 replicates and error bars indicate SEM (n = 4). The results are representative of 3 independent experiments.
Figure 5
Figure 5. Effect of other FTase inhibitors on SARS-CoV-2 infection.
(A) The chemical structures of LNF, tipifarnib, and FTI-277. (B) Dose-response curves of LNF, tipifarnib, and FTI-277 were prepared and relative replication was graphed. The VeroE6 cells were infected with SARS-CoV-2-nLuc and treated with these 3 drugs followed by luciferase activity measurement at 24 hours after infection. The red and black series represent percentage viral luciferase and cell viability, respectively. All data points represent mean ± SEM (n = 4) and the figure is representative of 3 independent experiments. The red and black series represent the level of viral infection and cell death, respectively. (C) Shift in the mobility of HDJ2 protein was assessed using Western blotting. The cells were treated with multiple concentrations of the drug and at 24 hours after treatment, the lysates were prepared and resolved using SDS-PAGE followed by transfer of the separated proteins to a nitrocellulose membrane. The membrane was probed with anti-HDJ2 (Invitrogen) and anti-GAPDH (Santa Cruz Biotechnology). A shift in electrophoretic mobility of HDJ2 is indicated by arrows. This experiment was conducted 2 times, and the blots are representative. (D) Time-of-addition assay was performed using VeroE6 cells treated with tipifarnib (10 μM) and FTI-277 (300 μM). Please see the schematic in Figure 4A. The infected cells were treated with the drug for varying durations of pre- and postinfection times and the luciferase activity was measured. The relative replication was plotted, where all data points represent mean ± SEM (n = 8) and the figure is representative of 3 independent experiments. NS, P > 0.05; ***P < 0.001, ****P < 0.0001 by 1-way ANOVA with Dunnett’s test for multiple comparisons to DMSO control. (E) Efficacy of LNF was tested in VeroE6 cells transfected with WT and mutant FNTB plasmids. At 48 hours after transfections, cells were infected with SARS-CoV-2-nLuc and luciferase activity was measured at 24 hours after infection. Data are presented as mean ± SEM (n = 4). The results are representative of 3 independent experiments.
Figure 6
Figure 6. Efficacy of LNF in an animal model.
(A) Drug treatment scheme showing how the K18-hACE2 mice were infected with SARS-CoV-2 and treated intraperitoneally with drugs. (B) Tissues harvested on days 2 and 5 (D2 and D5) after infection were analyzed for viral titer as described in the Methods. (C) Composite clinical scores calculated based on 4 disease parameters related to posture, behavior, and activity, breathing, and weight loss each rated from 0 to 3 (maximum total score 12). All results are representative of 3 independent experiments. (D) Tissue sections were individually graded from 0–3 based on degree of alveolar inflammation as well as degree and frequency of necrosis/hyaline membrane formation and perivascular inflammation. These were then summed for a composite histopathology score. All graphs show mean values ± SEM. NS, P > 0.05; *P < 0.05, ***P < 0.0001, ****P < 0.0001 by unpaired, 2-tailed t test with Welch’s correction (BD). (E) Representative H&E-stained histopathology images of lung from uninfected (left image) and infected mice treated with vehicle (middle image) or RDV (right image) sacrificed on day 5. Vehicle- and RDV-treated mice exhibited similar lesions on day 5. Lesions were characterized by moderate to large numbers of predominantly lymphocytes, with some histiocytic cells and rare neutrophils centered on vessels (middle image). Low to moderate numbers of similar infiltrates with slightly more neutrophils were often present in alveoli (right image). (F) Representative H&E-stained histopathology images of lung from uninfected (left image) and infected mice treated with vehicle (middle image) or LNF (right image) sacrificed on day 5. Vehicle-treated mice exhibited similar lesions, which were characterized by neutrophils and fewer lymphocytes and histiocytic cells present within alveoli and surrounding vessels (middle image). In contrast, LNF-treated mice had no to low amounts of inflammation within alveoli and surrounding vessels (right image). Scale bars: 20 μm (E and F).

Similar articles

References

    1. Zhu N, et al. A novel coronavirus from patients with pneumonia in China, 2019. N Engl J Med. 2020;382(8):727–733. doi: 10.1056/NEJMoa2001017. - DOI - PMC - PubMed
    1. V’Kovski P, et al. Coronavirus biology and replication: implications for SARS-CoV-2. Nat Rev Microbiol. 2021;19(3):155–170. doi: 10.1038/s41579-020-00468-6. - DOI - PMC - PubMed
    1. Hillen HS, et al. Structure of replicating SARS-CoV-2 polymerase. Nature. 2020;584(7819):154–156. doi: 10.1038/s41586-020-2368-8. - DOI - PubMed
    1. Duan L, et al. The SARS-CoV-2 spike glycoprotein biosynthesis, structure, function, and antigenicity: implications for the design of spike-based vaccine immunogens. Front Immunol. 2020;11:576622. doi: 10.3389/fimmu.2020.576622. - DOI - PMC - PubMed
    1. Walls AC, et al. Structure, function, and antigenicity of the SARS-CoV-2 spike glycoprotein. Cell. 2020;181(2):281–292. doi: 10.1016/j.cell.2020.02.058. - DOI - PMC - PubMed

MeSH terms