. 2024 Dec 3;17(865):eadk7971.
doi: 10.1126/scisignal.adk7971. Epub 2024 Dec 3.

ChREBP-mediated up-regulation of Them1 coordinates thermogenesis with glycolysis and lipogenesis in response to chronic stress

Affiliations

ChREBP-mediated up-regulation of Them1 coordinates thermogenesis with glycolysis and lipogenesis in response to chronic stress

Xu Xu et al. Sci Signal. .

Abstract

Activation of thermogenic brown adipose tissue (BAT) and inducible beige adipose tissue (BeAT) is triggered by environmental or metabolic stimuli, including cold ambient temperatures and nutrient stress. Thioesterase superfamily member 1 (Them1), a long-chain fatty acyl-CoA thioesterase that is enriched in BAT, suppresses acute cold-induced thermogenesis. Here, we demonstrate that Them1 expression was induced in BAT and BeAT by the carbohydrate response element binding protein (ChREBP) in response to chronic cold exposure or to the activation of the integrated stress response (ISR) by nutrient excess. Under either condition, Them1 suppressed energy expenditure. Consequently, mice lacking Them1 in BAT and BeAT exhibited resistance to obesity and glucose intolerance induced by feeding with a high-fat diet. During chronic cold exposure or ISR activation, Them1 accumulated in the nucleus, where it interacted with ChREBP and reduced the expression of its target genes, including those encoding enzymes that mediate glycolysis and de novo lipogenesis. These findings demonstrate that in response to chronic cold- or nutrient-induced stress, the induction of Them1 by ChREBP limits thermogenesis while coordinately reducing glucose utilization and lipid biosynthesis through its distinct cytoplasmic and nuclear activities. Targeted inhibition of Them1 could be a potential therapeutic approach to increase the activity of BAT and BeAT to enhance energy expenditure in the management of obesity-associated metabolic disorders.


Conflict of interest statement

COMPETING INTERESTS The authors declare that they have no competing interests.

Figures

Fig. 1.
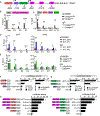
Fig. 1.. Them1 is induced in BAT and BeAT during chronic cold exposure and ISR activation
A) mRNA expression levels in BAT and iWAT of WT mice housed at 30°C for 3 w or at 4°C for 3 d or 3 w. Expression levels were presented as relative to β-Actin mRNA. n=6–8 mice/group. B) Protein expression levels in BAT and iWAT of WT mice at 22°C or 4°C for 3 w. Perilipin1 (Plin1) was used as the loading control. (C and D) Expression levels of mRNA (n=6–15 mice/group) (C) and protein (D) in BAT and iWAT of mice housed at 22°C. *P < 0.05, **P < 0.01 and ***P < 0.001 by one-way ANOVA. Immunoblots are representative of n=3–4 independent experiments.
Fig. 2.
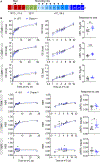
Fig. 2.. Them1 deletion increases thermogenesis induced by chronic cold exposure.
A) Schematic illustrating metabolic monitoring of the responses of mice to chronic cold exposure. Numbers within colored bars denote consecutive days that mice were housed at the indicated temperature. Arrows indicate the day during which data were recorded. Mice were housed at 30°C for 21 d before they were transferred to metabolic cages. Mice were allowed to acclimate at 30°C for 3 d then exposed to 22°C for 3 d before the ambient temperature was reduced to 4°C. After 7 consecutive d of data recording at 4°C, mice were transferred to individual housing cages in a 4°C cold room for 21 d, after which they were returned to metabolic cages for 1 d of data recording at d 28. (B and C) Cumulative EE (B) and mean RER (C) during the entire day (top), 12 h dark phase (middle) or 12 h light phase (bottom) of recording. For the entire day (top), EE for each mouse was adjusted by ANCOVA to the mean body weight of the mouse measured on the same data recording day. EE and RER values were plotted versus time on a linear (left) or logarithmic (middle) scale. The responses of EE and RER to cold exposure (right) were calculated by regression analyses (as values of b calculated from y = a + b log2(time at 4°C, d)). n=8 mice/group, *P < 0.05, **P < 0.01 WT compared to Them1−/− by two-tailed unpaired Student’s t-tests.
Fig. 3.
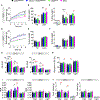
Fig. 3.. Them1 deletion provides additional improvements beyond WAT beiging in response to high fat feeding.
(A to F) Mice fed a HFD were housed at 22°C (n=6–11 mice/group) (A to C) or 30°C (n=5–10 mice/group) (D to F). Body weights (A, D), composition of body weights (B, E) and fat depots (C, F) following 12 w of HFD feeding. (G to J) Cumulative EE (G), average RER (I) and cumulative food intake after 12 w of HFD feeding. Percent reductions in EE values for mice housed at 22°C compared to 30°C (J). EE values were adjusted by ANCOVA to mean body weights. For (G) to (J), n=9–16 mice/group. *P < 0.05, **P < 0.01 and ****P < 0.0001, CRePflox/flox compared to Them1−/−/CRePflox/flox (black asterisks) and CRePLKO compared to DKO (red asterisks); #P < 0.05, ##P < 0.01, ###P < 0.001, and ####P < 0.0001, CRePflox/flox compared to CRePLKO by one-way (A to F) or two-way (G to J) ANOVA.
Fig. 4.
Fig. 4.. Deletion of Them1 increases glucose tolerance.
A) GTTs (first to third panels from the left) were performed for chow-fed mice acclimated to 4 °C, 22°C and 30°C sequentially for 3 w. Area under curve (AUC) (right) values were plotted versus ambient temperature. n=7–8 mice/group, *P < 0.05, WT compared to Them1−/− by two-way ANOVA. (B to E) Mice were fed a normal chow diet (B and C) or HFD (D and E) for 8 w. GTTs were performed when mice housed at 22°C (chow, n=5–11 mice/group; HFD, n=6–11 mice/group) (B and D) or 30°C (chow, n=7–11 mice/group; HFD n=5–10 mice/group) (C and E). Mice were intraperitoneally injected with glucose at 4.5 g/kg (chow), 4 g/kg (HFD, 22°C) or 3 g/kg (HFD, 30°C). *P < 0.05 and **P < 0.01, CRePflox/flox compared to Them1−/−/CRePflox/flox (black asterisks) and CRePLKO compared to DKO (red asterisks); #P < 0.05, ##P < 0.01, ###P < 0.001, and ####P < 0.0001, CRePflox/flox compared to CRePLKO (black hashtags) and Them1−/−/CRePflox/flox compared to DKO (red hashtags) by one-way ANOVA.
Fig. 5.
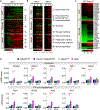
Fig. 5.. Them1 limits the induction of genes that mediate glucose oxidation and conversion to lipids in thermogenic adipose tissue.
A) Induction of protein expression in BAT of WT mice in response to increasing durations of exposure to an ambient temperature of 5°C following acclimation to 29°C for 2 w. Proteomic data were extracted from published datasets (34) and presented as fold change for ambient temperature of 5°C relative to 29°C. n=3–4 mice/group. B) Induction of gene expression in BAT and iWAT of WT mice in response to cold exposure at 4°C following acclimation to 30°C for 3 w. RNA-seq data were presented as fold change for ambient temperature of 4°C relative to 30°C. n=6 mice/group. For (A) and (B), proteins or genes were grouped into metabolic pathways. C) Induction of gene expression in iWAT of mice acclimated to 4°C for 3 w relative to mice acclimated to 30°C for 3 w. Data were presented as fold change for ambient temperature of 4°C relative to 30°C. n=6 mice/group. *P < 0.05, WT compared to Them1−/− by two-tailed unpaired Student’s t-tests. D) mRNA expression levels in iWAT of mice acclimated to 22°C (n=8–15 mice/group) or 30°C (n=4–8 mice/group). **P < 0.01, ***P < 0.001 and ****P < 0.0001, CRePLKO compared to DKO; #P < 0.05 and ##P < 0.01, CRePflox/flox compared to CRePLKO by two-way ANOVA.
Fig. 6.
Fig. 6.. Nuclear accumulation of Them1 in response to thermogenic stimulation limits ChREBP-mediated activation of genes that control glycolysis and DNL.
(A and B) Them1 protein expression in nuclear extracts of BAT of mice housed at different ambient temperatures for 3 w (A) or iWAT of mice housed at 30°C for 3 w, then 4°C for 7 or 28 d (B). GAPDH and HDAC1 were used as markers for cytoplasm and nucleus, respectively. Immunoblots are representative of n=3–4 independent experiments. (C and D) mRNA expression levels in primary brown adipocytes after 24 h infection of recombinant adenoviruses. NE (1 μM) treatments were 12 h. mRNA expression were calculated as relative to β-Actin and presented as percent Ad.ChREBPβ-infected relative to Ad.GFP-infected cells. For (D), data were further normalized as percent of Ad.Them1-infected (or mutants) relative to Ad.GFP-infected cells. E) Percent change in ECAR values in response to NE, glucose (Glu) or oligomycin (Oligo) in primary brown adipocytes relative to basal levels (left) and area under curve (AUC) values (middle and right). n=5–6 for (C) and (D) and n=14 technical replicates/group for (E), pooled from 3 independent experiments. *P < 0.05, **P < 0.01, ***P < 0.001 and ****P < 0.0001 by two-way (C, E) or one-way (D) ANOVA.
Fig. 7.
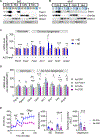
Fig. 7.. Them1 gene expression is directly regulated by ChREBP.
A) Schematic illustration of the ChREBP binding sites within promoters and introns of mouse Them1. Dark and shaded square boxes represent protein-coding and untranslated regions in exons, respectively. Thin or thick arrows indicate transcription start sites (TSS). Colored pentagonal boxes denote promoters (p), a randomly selected, negative control (NC) p region, or intronic ChREBP binding sites (E). Triangles indicate locations of ChIP-PCR targets relative to the Them1β TSS. (B to E) PCR was performed using immunoprecipitated chromatin from the livers of mice fed HFruD for 3 w (n=5 mice/group) (B and C) or BAT and iWAT of mice acclimated at 30°C or 4°C for 3 w (n=8 mice/group) (D) or housed at 22°C (n=6 mice/group) (E). ChOREs within Fasn and G6pc promoters were used as positive controls. pNC was used as a negative control. F-G) Luciferase reporter vectors containing ~1kb promoter of Them1α (pT1α-Luc, -988/-2 from T1α TSS), Them1β (pT1β-Luc, -997/+12 from T1β TSS), or with the mutation of ChOREs (Mut) were transfected into Hepa1.6 cells and then cultured in DMEM medium containing the indicated glucose concentrations or following infection with recombinant adenoviruses. An empty pGL3 vector and a pGL3 vector containing pNC (pNC-Luc, +1589/+3011 from T1α TSS or -3563/-2142 from T1β TSS) were used as negative controls. For the schematic illustration of vectors, red- and grey-colored boxes indicate ChOREs and mutation of ChOREs, respectively. H-I) Luciferase reporter vectors pT1α-Luc, pT1β-Luc, or with E1 (+35358/+35448 T1β TSS), E2 (+21310/+21384 T1β TSS) or E3 (+8861/+8946 T1β TSS) were transfected into Hepa1.6 cells. E3rev represents E3 in a reverse orientation. For (F) to (I), transfected cells were harvested after 24 h for reporter assays. n=6–12 technical replicates/group, data were pooled from 3–4 independent experiments. In (B) to (G), *P < 0.05, **P < 0.01, ***P < 0.001 and ****P < 0.0001 by two-way ANOVA. In (H to I), aP < 0.0001, pT1α compared to E3-E1-pT1α or pT1α compared to E3rev-E1-pT1α; bP < 0.0001, pT1β compared to E3-E1-pT1β or pT1β compared to E3rev-E1-T1β by one-way ANOVA.
Fig. 8.
Fig. 8.. Proposed model of Them1-mediated regulation of acute and chronic energy expenditure.
Under basal conditions, Them1 is localized in the cytosol and in close proximity to LDs and mitochondria in the form of biomolecular condensates, limiting the availability of FAs to FAO and thermogenesis (left). In response to acute cold exposure, β3-adrenergic activation triggers phosphorylation and diffusion of Them1, allowing for increased thermogenesis (middle). During chronic cold- or nutrient- induced stress, ChREBP is activated in response to increased glucose levels, leading to the upregulation of Them1 expression. As a result of chronic β3-adrenergic stimulation, Them1 accumulates in the nucleus, where it inhibits ChREBP-mediated activation of genes involved with glucose oxidation (GO) and de novo lipogenesis (DNL). The inhibition of GO and DNL ultimately leads to a decrease in the production of energy substrates for FAO and impairs thermogenesis (right).

References

    1. Cannon B, Nedergaard J, Brown adipose tissue: function and physiological significance. Physiol Rev 84, 277–359 (2004). - PubMed
    1. Loncar D, Convertible adipose tissue in mice. Cell Tissue Res 266, 149–161 (1991). - PubMed
    1. Wu J, Bostrom P, Sparks LM, Ye L, Choi JH, Giang AH, Khandekar M, Virtanen KA, Nuutila P, Schaart G, Huang K, Tu H, van Marken Lichtenbelt WD, Hoeks J, Enerback S, Schrauwen P, Spiegelman BM, Beige adipocytes are a distinct type of thermogenic fat cell in mouse and human. Cell 150, 366–376 (2012). - PMC - PubMed
    1. Bartelt A, Heeren J, Adipose tissue browning and metabolic health. Nat Rev Endocrinol 10, 24–36 (2014). - PubMed
    1. Saito M, Okamatsu-Ogura Y, Matsushita M, Watanabe K, Yoneshiro T, Nio-Kobayashi J, Iwanaga T, Miyagawa M, Kameya T, Nakada K, Kawai Y, Tsujisaki M, High incidence of metabolically active brown adipose tissue in healthy adult humans: effects of cold exposure and adiposity. Diabetes 58, 1526–1531 (2009). - PMC - PubMed

Publication types

MeSH terms

Substances

LinkOut - more resources