. 2024 Dec 3;15(1):10542.
doi: 10.1038/s41467-024-54821-x.

Detecting global and local hierarchical structures in cell-cell communication using CrossChat

Affiliations

Detecting global and local hierarchical structures in cell-cell communication using CrossChat

Xinyi Wang et al. Nat Commun. .

Abstract

Cell-cell communication (CCC) occurs across different biological scales, ranging from interactions between large groups of cells to interactions between individual cells, forming a hierarchical structure. Globally, CCC may exist between clusters or only subgroups of a cluster with varying size, while locally, a group of cells as sender or receiver may exhibit distinct signaling properties. Current existing methods infer CCC from single-cell RNA-seq or Spatial Transcriptomics only between predefined cell groups, neglecting the existing hierarchical structure within CCC that are determined by signaling molecules, in particular, ligands and receptors. Here, we develop CrossChat, a novel computational framework designed to infer and analyze the hierarchical cell-cell communication structures using two complementary approaches: a global hierarchical structure using a multi-resolution clustering method, and multiple local hierarchical structures using a tree detection method. This framework provides a comprehensive approach to understand the hierarchical relationships within CCC that govern complex tissue functions. By applying our method to two nonspatial scRNA-seq datasets sampled from COVID-19 patients and mouse embryonic skin, and two spatial transcriptomics datasets generated from Stereo-seq of mouse embryo and 10x Visium of mouse wounded skin, we showcase CrossChat's functionalities for analyzing both global and local hierarchical structures within cell-cell communication.


Conflict of interest statement

Competing interests: The authors declare no competing interests.

Figures
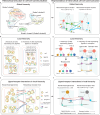
Fig. 1
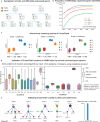
Fig. 1. Hierarchical structures in cell-cell communications.
a A hierarchical clustering of cells. Cell groups at scale 2 are subclusters of cell groups at scale 1. b Hierarchical structures within ligands, receptors, or union of ligands and receptors. (i) In the hierarchy of ligands, all cells express red ligands, some the cells express yellow ligands, and some cells express green ligands, etc. (ii) In the hierarchy of ligand-receptor unions, all cells express either the red ligand or receptor. Within the group of cells expressing the yellow ligand or receptor, there are also cells expressing either the purple ligand or receptor, and blue ligand or receptor. c Hierarchical structures of ligand-receptor interactions. There are four hierarchical relationships of ligand-receptor interactions ligand inclusion, ligand, disjointness, receptor inclusion, and receptor disjointness. d Representations of cell-cell communication between hierarchical clustering of cells based on ligands (left) and receptors (right). The node sizes correspond to the number of cells in the groups, and the edge widths represent interaction strengths. e Tree representations of hierarchical structures within ligands, receptors, or ligand-receptor unions. f Representations of hierarchical relations between ligand-receptor interactions.
Fig. 2
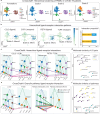
Fig. 2. Overview of CrossChat.
a Method overview of CrossChatH and CrossChatT. (i) CrossChatH: hierarchical clustering. The input is a gene expression matrix. CrossChatH calculates a cell-cell similarity matrix and uses a random walk-based method on the similarity matrix to obtain hierarchical clustering results. After obtaining ligand clusters and receptor clusters, it runs CellChat to calculate cell-cell communication between clusters. (ii) CrossChatT: tree detection of ligand-receptor interactions. The input is a gene expression matrix, which is then binarized to form a ligands/receptors support matrix. A gene-gene relationship graph is constructed, where gene pairs whose support is either disjoint or inclusive are connected. The Bron-Kerbosch algorithm is used on the gene relationship graph to find maximal complete subgraphs. Each subgraph represents a tree structure of ligands/receptors. b Downstream analysis of CrossChatH and CrossChatT: (i) Similarity of pathways based on ligand/receptor distributions over hierarchical clusters. (ii) Visualization of ligand-receptor interactions between union of ligand/receptors trees. (iii) Frequency of ligands/receptors in all ligand/receptor trees.
Fig. 3
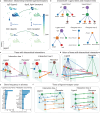
Fig. 3. Validation of CrossChatH.
a Synthetic data preparation. Differentially expressed genes (DEGs) are assigned to each cluster. b Proportion of DEGs identified at scale 1, scale 2, scale 3, and across all scales. c The hierarchical clustering results of CrossChatH on synthetic data. Clustering at each scale aligns well with the original hierarchical cell group assignments. d Validation of CrossChatH clusters using PBMC data from COVID-19 patients. Two independent hierarchical clustering procedures are performed based on ligands only and receptors only. Boxplot shows the distribution of distance of CCC pattern of a certain cluster with the rest of the clusters. Cell-cell communication patterns are robust to subsampling within each hierarchical ligands/receptors group. e Validation of CrossChatT to detect simulated trees. CrossChatT is capable of detecting all simulated trees in 1000 trials of simulation.
Fig. 4
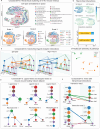
Fig. 4. Applications of CrossChatH to scRNA-seq of PBMCs sampled from COVID-19 patients.
a Annotations and CrossChatH hierarchical clustering results of a scRNA-seq dataset of PBMC cells from COVID-19 patients. Hierarchical clustering detects three scales of clusters, and clusters at each scale align with certain biological clusters. b Two ligand-receptor interactions that are specific to hierarchical clusters. CCL3 ligand is specific to Mono2, a subset of Mono, and CCR1 receptor is specific to Mono. RETN ligand is specific to Mono, and TLR4 receptor is specific to Mono1, another subset of Mono. Interaction proportion shows that the assigned cluster pairs account for most interactions through the CCL3-CCR1 and RETN-TLR4 interaction pairs. c Hierarchical visualization of the two ligand-receptor interactions where ligand (receptor) clusters are from CrossChatH clustering based on ligands (receptors) only. d Applying UMAP to top 15 specific ligand-receptor pairs based on the similarity of ligand/receptor distribution over hierarchical clusters to visualize the interaction similarity in 2D. e Hierarchical visualization of cell-cell communications of Granulin pathway. Left side is the visualization of interactions between hierarchical clusters generated based on ligands (receptors) only. The right side uses the support of ligands (receptors) calculate interactions with each hierarchical cluster, so each hierarchical cluster expresses a subset of cells where every cell expresses the ligands (receptors) and the other subset of cells express no ligands (receptors). f Applying UMAP to signaling pathways based on the similarity of ligands/receptors distribution over hierarchical clusters to visualize the interaction similarity in 2D. Source data are provided as a Source Data file.
Fig. 5
Fig. 5. Applications of CrossChatT to mouse skin cells during wound healing.
a An example of hierarchical structures of ligand-receptor interactions. Igf2 and Ocln are inclusive as ligands. Itga6_Itgb4 and Ocln are disjoint as receptors. b Examples of ligand tree structures and receptor tree structures detected by CrossChatT. c Two examples of hierarchical interactions occurring between a ligand tree and a receptor tree. d Hierarchical interactions between union of ligand trees and union of receptor trees. e Frequency of ligands/receptors occurrence across all ligand/receptor trees. f Examples of tree structures of ligand-receptor unions detected by CrossChat. Source data are provided as a Source Data file.
Fig. 6
Fig. 6. Applications of CrossChatS to spatial datasets.
a Annotations and CrossChatH-S hierarchical clustering results of a Stereo-seq dataset of mouse embryo at E16.5. Spatial hierarchical clustering detects three scales of clusters, which are shown in spatial coordinates. b Two ligand-receptor interactions that are specific to spatial hierarchical clusters. Ccl3 ligand is specific to Mono2, a subset of Mono, and Ccr1 receptor is specific to Mono. Retn ligand is specific to Mono, and Tlr4 receptor is specific to Mono1, another subset of Mono. Interaction proportion shows that the assigned cluster pairs contain the majority of interactions for both Ccl3-Ccr1 and Retn-Tlr4 interactions. c Hierarchical visualization of the two ligand-receptor interactions where ligand (receptor) clusters are from CrossChatH-S clustering based on ligands (receptors) only. d Applying UMAP to pathways based on similarity of ligand/receptor distribution over spatial hierarchical clusters to visualize the interaction similarity in 2D. e Examples of ligand tree structures and receptor tree structures detected by CrossChatT-S. f Two examples of hierarchical interactions in space occurring between a ligand tree and a receptor tree. Source data are provided as a Source Data file.

References

    1. Armingol, E., Officer, A., Harismendy, O. & Lewis, N. E. Deciphering cell–cell interactions and communication from gene expression. Nat. Rev. Genet22, 71–88 (2021). - PMC - PubMed
    1. Wang, X., Almet, A. A. & Nie, Q. The promising application of cell-cell interaction analysis in cancer from single-cell and spatial transcriptomics. Semin Cancer Biol.95, 42–51 (2023). - PMC - PubMed
    1. Armingol, E., Baghdassarian, H. M. & Lewis, N. E. The diversification of methods for studying cell–cell interactions and communication. Nat. Rev. Genet.25, 381–400 (2024). - PMC - PubMed
    1. Almet, A. A., Cang, Z., Jin, S. & Nie, Q. The landscape of cell–cell communication through single-cell transcriptomics. Curr. Opin. Syst. Biol.26, 12–23 (2021). - PMC - PubMed
    1. Cyster, J. G. & Allen, C. D. C. B Cell Responses: Cell Interaction Dynamics and Decisions. Cell177, 524–540 (2019). - PMC - PubMed

Publication types

Associated data