. 2024 Dec 3;15(1):10514.
doi: 10.1038/s41467-024-54445-1.

Endothelial Pim3 kinase protects the vascular barrier during lung metastasis

Affiliations

Endothelial Pim3 kinase protects the vascular barrier during lung metastasis

Niina M Santio et al. Nat Commun. .

Abstract

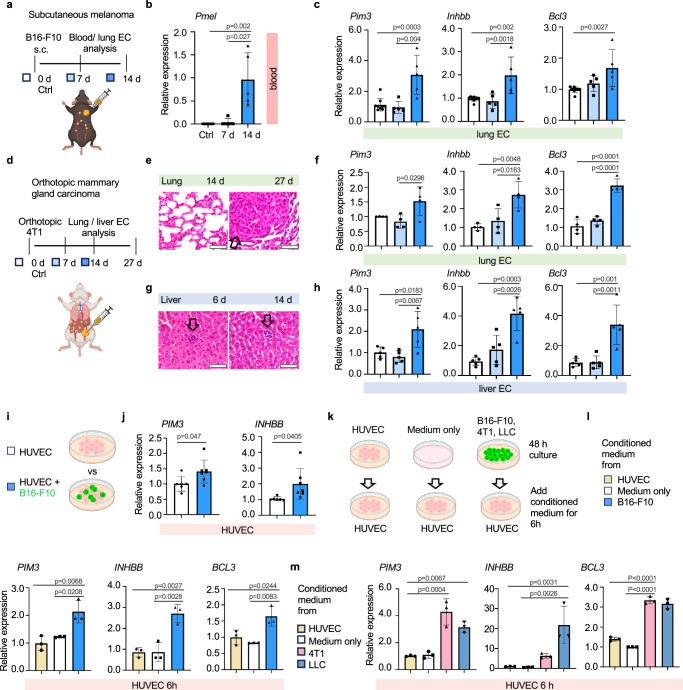
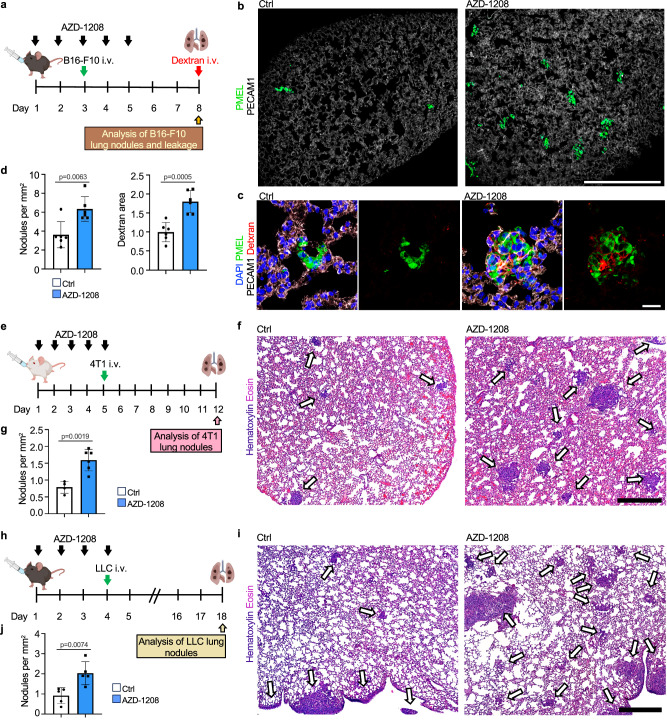
Endothelial cells (ECs) form a tissue-specific barrier for disseminating cancer cells in distant organs. However, the molecular regulation of the ECs in the metastatic niche remains unclear. Here, we analyze using scRNA-Seq, the transcriptional reprogramming of lung ECs six hours after the arrival of melanoma cells in mouse lungs. We discover a reactive capillary EC cluster (rCap) that increases from general capillary ECs in response to infiltrating cancer cells. rCap is enriched for angiogenic and inflammatory pathways and is also found in human lung datasets. The JAK-STAT activated oncogenic Pim3 kinase is a marker of rCap, being upregulated in spontaneous metastasis models. Notably, PIM inhibition increases vascular leakage and metastatic colonization and impairs the EC barrier by decreasing the junctional cadherin-5 and catenins α, β and δ. These results highlight the pulmonary endothelium's plasticity and its protection by PIM3, which may impair the efficacy of PIM inhibitors in cancer therapies.


Conflict of interest statement

Competing interests: The authors declare no competing interests.

Figures

Fig. 1
Fig. 1. Single-cell RNA-Seq reveals reactive capillary endothelial cells (rCap) in the lungs 6 h after cancer cell injection.
a B16-F10 melanoma cells or PBS (Ctrl) were intravenously (i.v.) injected into C57BL/6 mice, and endothelial (ECs) and B16-F10 cells were isolated from the lungs after 6 h or after 30 h and subjected for scRNA-Seq. n = 3 independent experiments at 6 h, n = 1 exp at 30 h. Cells from two or three mice were pooled per sample in experiments 1 and 2–3, respectively. b Representative image of a 150 μm thick lung section showing a CellTracker green labeled B16-F10 cell in the lung capillary stained for PECAM1 6 h post-injection. n = 3 mice injected with B16-F10, compared to 3 Ctrl mice. c Uniform Manifold Approximation and Projection (UMAP) of clustered scRNA-Seq data of the lung EC and melanoma subsets. d, e EC cluster markers in the integrated data containing controls and all time points. f Analysis of EC composition per cluster between Ctrl and 6 h post-injection of B16-F10 using scCODA (false discovery rate, FDR > 0.05*). n = 3 independent experiments. The median is indicated by a line, bounds of the box represent the first and third quartiles, and the whiskers the smallest and largest data points within 1.5 interquartile ranges from the bounds. g RNA velocity analysis at 6 h time point. h Fold change of the top 25 rCap cluster markers, ordered based on adjusted p value. i rCap marker expression in EC clusters in control lungs, and at 6 h and 30 h after B16-F10 injection. n = 3 independent experiments (6 h), n = 1 (30 h) (g-i). j RT-qPCR of rCap markers in ECs isolated from control lungs (n = 7 mice for all markers) and 6 h after B16-F10 i.v. injection (n = 10 for Pim3, Inhbb, Tmem252 and Scarb1 each, n = 6 for Bcl3, n = 7 for Osmr, n = 5 for Adamts9). Each dot represents the average from one mouse, values were normalized to Hprt. General capillary, gCap; high interferon EC, hIFN; aerocyte capillary, aCap; lymphatic EC, LEC. Wilcoxon rank-sum test (h, i) (two-sided in i), two-tailed unpaired t-test (j), p < 0.05*, <0.01**, <0.001***. Data are presented as mean values +/- SD. Scale bar, 10 μm (b). Illustration created in Biorender.com (a). Source data are provided as a Source Data file.
Fig. 2
Fig. 2. Cell-cell communication and gene set enrichment analysis reveal angiogenic and inflammatory signatures in rCap.
a Overview of signaling interactions between lung endothelial cells (ECs) using CellChat, 6 h after B16-F10 intravenous (i.v.) injection in mice compared to PBS (Ctrl). n = 3 independent experiments. b CellChat communication probability of upregulated ligand-receptor interactions originating from reactive capillary EC (rCap) in the metastatic lungs compared to Ctrl, p < 0.01 in all. c Signal strength of indicated pathways between EC clusters in Ctrl and 6 h samples using circle plots. d Feature plots showing expression of selected rCap enriched ligands 6 h after B16-F10 i.v. injection in mice compared to Ctrl. rCap cluster is highlighted. Significant changes marked*** (two-sided Wilcoxon rank-sum test for fold change between 6 h and Ctrl, adjusted p-value < 0.05) e Differentially expressed (DE) rCap genes 6 h after B16-F10 i.v. injection in mice compared to Ctrl, selected among the top 100 most significant based on adjusted p-value. FC was set to 0, when adjusted p-value > 0.001. f Kyoto Encyclopedia of Genes and Genomes (KEGG) and Hallmark gene set enrichment analysis of the rCap DE genes between 6 h metastatic and control lung. g Gene expression changes of JAK-STAT pathway genes in rCap at 6 h. h Schematic representation of the JAK-STAT-PIM-BCL3 pathway created in Biorender.com. Source data are provided as a Source Data file. aCap Aerocyte capillary, gCap general capillary, hIFN high interferon EC, LEC lymphatic EC.
Fig. 3
Fig. 3. rCap markers are enriched in ECs in metastatic lungs.
Visualization of reactive capillary endothelial cell (rCap) markers Pim3 (a), Inhbb (b) and Bcl3 (c) expression in the integrated scRNASeq data from mouse lungs, 6 h post intravenous (i.v.) injection of B16-F10 melanoma cells or PBS (Ctrl). n = 3 independent experiments. d, e Representative images of RNAscopeTM in situ hybridization (ISH) and immunohistochemistry of lung sections from similarly injected mice. Pim3 (d, e), Bcl3 (d), Inhbb (e), and Pecam1 (d, e) were detected using ISH, melanoma cells using anti-PMEL antibody and nuclei by DAPI. n = 3 mice per group. Quantification of Pim3 (f), Bcl3 (g) and Inhbb (h) signal area in the lungs, normalized to nuclear area, relative to Ctrl. n = 3 mice per group. il Representative higher magnification images from samples in (d, e), showing coexpression of Pim3 with Bcl3 (i) or Inhbb (k) transcripts near cancer cells. Quantification of Pim3+Bcl3+ (j) and Pim3+Inhbb+ (l) double positive Pecam1+ cells normalized to all Pecam1+ ECs from Ctrl and 6 h B16-F10 lung. n = 3 mice per group. m, n Quantification of PIM3 protein levels in ECs isolated from Ctrl and 7 h B16-F10 i.v. injected mouse lungs, normalized to GAPDH. n = 4 mice per group. Wilcoxon rank-sum test (ac), two-tailed unpaired t-test (fh, j, l, m). Data are presented as mean values +/- SD. Scale bars 25 μm (d, e) and 5 μm (i, k). Source data are provided as a Source Data file.
Fig. 4
Fig. 4. rCap markers are upregulated in spontaneous metastasis models and by tumor cell secreted factors.
ac B16-F10 melanoma cells or PBS (Ctrl) were injected subcutaneously (s.c.) into C57BL/6 mice (a). RT-qPCR for melanoma marker Pmel in blood samples (b) and for Pim3, Inhbb and Bcl3 in isolated lung ECs from Ctrl and tumor bearing mice at 7 and 14 days after tumor implantation (c). n = 5 mice per group. dh 4T1 mammary carcinoma cells were implanted orthotopically into BALB/c mice and analyzed at indicated time points (d). H&E staining of lung (27 d after tumor initiation) (e) and liver metastasis (6 d and 14 d after tumor intiation) (g) (arrows indicate metastatic nodules). RT-qPCR for Pim3, Inhbb and Bcl3 in isolated lung (n = 4 mice per group) (f) and liver ECs (n = 5 mice per group) (h). i, j Mono- and cocultures of human umbilical vein endothelial cells (HUVEC) with B16-F10 melanoma cells (i). RT-qPCR of PIM3 and INHBB in sorted HUVECs. n = 6 independent experiments for monocultures, n = 7 for B16-F10-HUVEC cocultures (j). HUVECs were treated for 6 h with conditioned medium incubated for 48 h on cancer cell or HUVEC cultures or empty plates, as indicated (k), and analyzed using RT-qPCR. n = 3 independent experiments (l, m). RT-qPCR results are shown relative to Ctrl, normalized to Hprt. One-way Anova with multiple comparisons (b, c, f, h, l, m), two-tailed unpaired t-test (j). Data are presented as mean values +/- SD. Scale bars 50 μm (g, e). Illustrations created in Biorender.com (a, d, i, k). Source data are provided as a Source Data file.
Fig. 5
Fig. 5. Silencing of PIM3 dismantles cadherin-5 and catenins from endothelial cell-cell junctions.
a shPIM3 or control (shScr) silenced human umbilical vein endothelial cells (HUVECs) and dermal microvascular endothelial cells (BECs) were stained for vascular endothelial cadherin (CDH5) and F-actin. Nuclei were stained using DAPI. Relative CDH5 signal intensity (b) and area (c) (normalized to number of nuclei) in HUVEC (n = 3 independent experiments for shScr, n = 6 independent experiments for shPIM3) and in BEC (n = 3 for shScr, n = 5 for shPIM3). Western blot (d) and quantification (e) of CDH5 in HUVECs treated as in (a). n = 3 independent experiments for shScr, n = 6 for shPIM3. f shPIM3 or shScr silenced BECs were stained for α- and β-catenin (CTNNA1 and CTNNB1) and HUVECs for δ-catenin (CTNND1) and F-actin. Nuclei were stained using DAPI. Relative α-catenin (g, h), β-catenin (i, j) and δ-catenin (k, l) signal intensities (per field) and area (normalized to number of nuclei) relative to control (shScr). n = 3 for shScr, n = 6 for shPIM3 (gj). n = 3 for shScr, n = 5 for shPIM3 (k, l). m Schematic representation of CDH5 and α-, β- and δ-catenin in adherens junctions created in Biorender.com. Two-tailed unpaired t-test (b, c, e, gl). Data are presented as mean values +/- SD. Data is pooled from independent experiments using two shPIM3 clones in b, c, e, gl. Scale bars 50 μm (a, f); 25 μm in close-up images (a, f). Source data are provided as a Source Data file.
Fig. 6
Fig. 6. PIM inhibition decreases junctional cadherin-5 and impairs the endothelial cell barrier.
Control or AZD-1208 treated human umbilical vein endothelial cells (HUVEC) (a) and human dermal microvascular blood endothelial cells (BEC) (b) were analyzed using ECIS electrical cell impedance sensing. Arrows indicate initiation of serum starvation (arrow 1) and initiation of treatment (arrow 2). Shown are representative experiments with triplicate samples with SEM. Significant differences based on three independent experiments (n = 3, Ctrl vs AZD-1208 at indicated times after treatment initiation) for HUVEC at 24 h 1 µM (p = 0.0372), 10 µM (p = 0.0026), at 48 h 1 µM (p = 0.0456), 10 µM (p < 0.0001) and at 72 h 10 µM (p = 0.0053) and for BEC at 48 h 1 µM (p = 0.0086), 10 µM (p = 0.0012). c Representative images of HUVEC and BEC treated with AZD-1208 (1 μM) or 0.1% DMSO (Ctrl) for 24 h in reduced 2.5% serum, and stained for CDH5, F-actin and nuclei (DAPI). Relative CDH5 signal intensity (per field) (d) and area (normalized to number of nuclei) (e). n = 3 independent experiments. f, g CDH5 Western blot and quantification of HUVEC treated as in (c). n = 3 independent experiments. h AZD-1208 (30 mg kg−1) or vehicle (Ctrl) was orally administered daily for 5 days. CDH5 and collagen IV (Col IV) were stained in thick lung sections. Shown are maximum intensity projections of confocal z-stacks. i Magnification of maximum intensity projection of CDH5 stained lung sections (top) with surface masking (below). Arrows indicate gaps in CDH5 staining. Quantification of CDH5 intensity (j) and area (k), and number of gaps in CDH5 staining (l) as explained in materials and methods. n = 4 independent experiments. Mixed-effects analysis (a) and two-way ANOVA (b) both with multiple comparisons, two-tailed unpaired t-test (d, e, g, j, l), two-sided Mann-Whitney U test (k). Data are presented as mean values +/- SD (d, e, g, jl,) or +/- SEM (a, b). Scale bars 50 µm (c); 25 µm (h, close-up images in c) and 10 µm (i). Source data are provided as a Source Data file.
Fig. 7
Fig. 7. PIM inhibitor pre-treatment increases vascular leakage and tumor cell colonization.
ad PIM inhibitor AZD-1208 (30 mg kg−1) or vehicle (Ctrl) was orally administered daily for 5 days. On day 3, B16-F10 melanoma cells were injected intravenously (i.v.) and 70 kDa fluorescent dextran was injected for the last 10 min on day 8 (a). Shown are representative confocal images (b, c) and number of metastatic nodules and dextran area quantified from lung sections (d). n = 6 mice per group. eg AZD-1208 or vehicle (Ctrl) were administered orally daily for 5 days. On day 5, 4T1 cells were i.v. injected into BALB/c female mice (e). Representative images (f) and quantification of metastases from hematoxylin & eosin (H&E) stained lung sections from AZD-1208 and vehicle treated mouse lungs on d 12 (g). n = 4 Ctrl mice; n = 6 mice in AZD-1208 group (f, g) hj AZD-1208 was administered daily for 4 days prior to LLC i.v. injection into C57BL/6 male mice (h). Shown are representative images of HE stained lung sections (i) and quantification of metastases from AZD-1208 and vehicle (Ctrl) treated mice on d 18. n = 5 mice per group. (j) In each experiment metastases from at least four lung lobes per mouse were analyzed. Scale bar 500 μm (b, f, i), 25 µm (c). Two-tailed unpaired t-test (d, g, j). Data are presented as mean values +/- SD. Illustration created in Biorender.com (a, e, h). Source data are provided as a Source Data file.
Fig. 8
Fig. 8. Reactive capillary ECs in the lungs.
a Reactive capillary ECs (rCap) present in the lungs are increased in response to infiltrating tumor cells. rCap markers such as Pim3, Bcl3 and Inhbb mark the cancer reactive niche ECs in mouse, while rCaps in the human lungs express ICAM1. b JAK-STAT pathway target Pim3 enforces EC-EC junctions, while PIM kinase inhibition increases vascular leakage and metastatic colonization of the lungs. Illustration created in Biorender.com (a, b).

References

    1. Labelle, M. & Hynes, R. O. The initial hours of metastasis: the importance of cooperative host-tumor cell interactions during hematogenous dissemination. Cancer Discov.2, 1091–1099 (2012). - PMC - PubMed
    1. Massague, J. & Obenauf, A. C. Metastatic colonization by circulating tumour cells. Nature529, 298–306 (2016). - PMC - PubMed
    1. Jakab, M. et al. Lung endothelium exploits susceptible tumor cell states to instruct metastatic latency. Nat. Cancer5, 716–730 (2024). - PMC - PubMed
    1. De Palma, M., Biziato, D. & Petrova, T. V. Microenvironmental regulation of tumour angiogenesis. Nat. Rev. Cancer17, 457–474 (2017). - PubMed
    1. Peinado, H. et al. Pre-metastatic niches: organ-specific homes for metastases. Nat. Rev. Cancer17, 302–317 (2017). - PubMed

Publication types

MeSH terms

Associated data