. 2024 Dec 3;15(1):10539.
doi: 10.1038/s41467-024-54706-z.

Tumor-derived miR-9-5p-loaded EVs regulate cholesterol homeostasis to promote breast cancer liver metastasis in mice

Affiliations

Tumor-derived miR-9-5p-loaded EVs regulate cholesterol homeostasis to promote breast cancer liver metastasis in mice

Mei-Xin Li et al. Nat Commun. .

Abstract

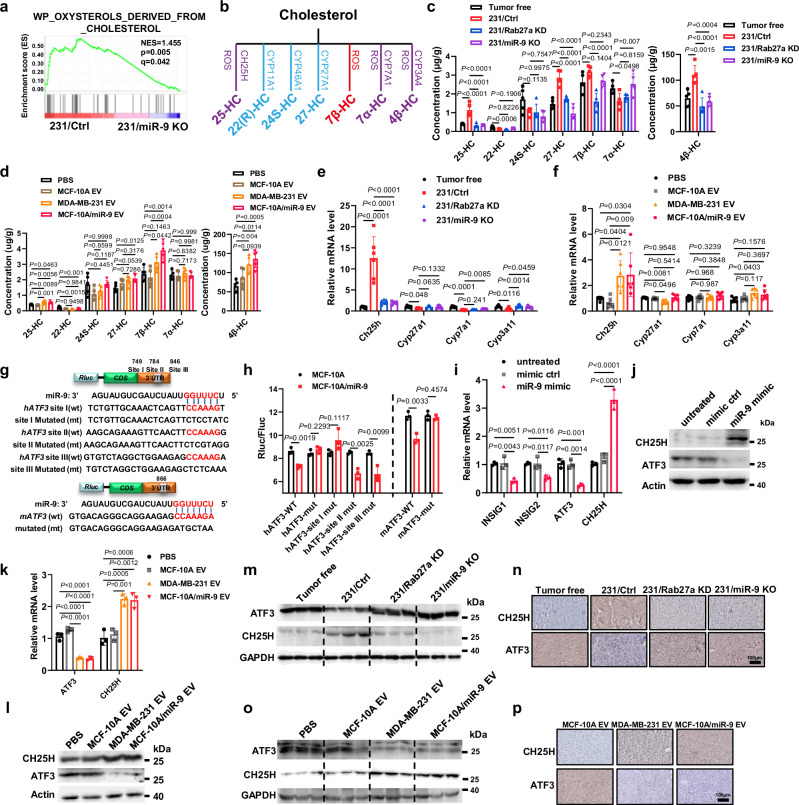
Cancer cells secrete extracellular vesicles (EV) encapsulating bioactive cargoes to facilitate inter-organ communication in vivo and are emerging as critical mediators of tumor progression and metastasis, a condition which is often accompanied by a dysregulated cholesterol metabolism. Whether EVs are involved in the control of cholesterol homeostasis during tumor metastasis is still undefined and warrant further investigation. Here, we find that breast cancer-derived exosomal miR-9-5p induces the expression of HMGCR and CH25H, two enzymes involved in cholesterol synthesis and the conversion of 25-hydroxycholesterol from cholesterol by targeting INSIG1, INSIG2 and ATF3 genes in the liver. Notably, in vivo miR-9-5p antagomir treatment and genetic CH25H ablation prevents tumor metastasis in a mouse model of breast cancer. Thus, our findings reveal the regulatory mechanism of tumor-derived miR-9-5p in liver metastasis by linking oxysterol metabolism and Kupffer cell polarization, shedding light on future applications for cancer diagnosis and treatment.


Conflict of interest statement

Competing interests: The authors declare no competing interests.

Figures

Fig. 1
Fig. 1. Breast cancer derived EV induced cholesterol biosynthesis in liver.
a Representative images for GFP signals in liver from mice xenografted MDA-MB-231/Lck-GFP cells (231/Ctrl) or MDA-MB-231/Rab27a KD/Lck-GFP cells (231/Rab27a KD) and tumor free mice. b Liver tissue collected from 231/Ctrl mice and 231/Rab27a KD mice for 50 days and tumor free mice were subjected to RNA-seq and GSEA, showing enrichment of genes related to indicated pathways (Permutation test, n = 3 mice per group). c Total cholesterol (TC) in liver and serum in indicated group (one-way ANOVA, n = 7 mice per group). d Liver sections were stained with oil red O. Scale bars, 50 μm. e Schematic of cholesterol synthesis pathway. f The qRT-PCR showing relative mRNA levels in the liver in indicated group (one-way ANOVA, n = 6 mice per group). g Western blots showing proteins related to cholesterol synthesis in the liver in indicated group. h IHC of indicated protein in liver sections. Representative images are shown. Scale bars, 100 μm. i GFP signals in liver from mice receiving tail vein injections of Lck-GFP-labeled EVs. j Liver tissue collected from mice that had received 5 weeks of i.v. injections of EVs or control mice were subjected to RNA-seq and GSEA, showing enrichment of genes set related to cholesterol biosynthesis pathway (Permutation test, n = 3 mice per group). k Total cholesterol (TC) in liver in indicated group (one-way ANOVA, n = 5 mice per group). l Left: Liver sections were stained with oil red O in NSG mice receiving tail vein injections of EVs. Scale bars, 50 μm. Right: Quantification of the lipid droplets of the liver (one-way ANOVA, n = 5 biological replicates). m Quantification of gene expression of several markers in cholesterol synthesis pathway using qRT-PCR in NSG mice receiving indicated EVs (one-way ANOVA, n = 6 mice per group). n Immunoblot analysis of liver sample collected from mice that had received MCF-10A or MDA-MB-231-derived EVs for 5 weeks. o Immunoblot analysis of proteins related to cholesterol synthesis in primary hepatocytes treated with indicated EVs, with PBS as control. Data are presented as mean ± s.d. Source data and exact P value are provided as a Source data file.
Fig. 2
Fig. 2. Exosomal miR-9-5p induced cholesterol biosynthesis by targeting INSIG1/2.
a The enriched miRNAs from MDA-MB-231 EVs versus MCF-10A EVs overlapping with miRNA pools targeting both Insig1 and Insig2 from Targetscan database in cholesterol pathway. b Left: qRT-PCR-determined miR-9-5p levels in an equal amount of EVs derived from serum of normal (n = 6) and breast cancer patients (n = 12) (unpaired two-tailed t test). Right: The RNA quality of serum EVs was demonstrated. c RT-qPCR-determined miR-9-5p levels in liver (n = 5) and serum (n = 5) in indicated tumor-bearing or tumor-free mice (one-way ANOVA). d RT-qPCR-determined miR-9-5p levels in liver from mice receiving tail vein injections of indicated EVs (one-way ANOVA, n = 6 mice per group). e In situ hybridization for miR-9-5p in liver of mice from tumor free, 231/Ctrl and 231/Rab27a KD. Scale bar, 50 μm. f Predicted miR-9-5p binding sites in human and mouse Insigs genes (Insig1 and Inisg2, respectively). The corresponding sequences in WT and mutated reporters are shown. g Luciferase reporter assay showing responsiveness of the reporters to transfected human and mouse Insig1 or Insig2 in MCF-10A and MCF-10A/miR-9 cells (unpaired two-tailed t test, n = 3 independent batches). h Immunoblot analysis of liver sample collected from indicated mice received EVs injection. i, j Total cholesterol (TC) and triglycerides (TG) level in liver and serum in indicated mice received EVs (unpaired two-tailed t test, n = 6 mice per group). k Quantification of gene expression of HL7702 cell after EVs/PBS treatment for 48 h using qRT-PCR (one-way ANOVA, n = 3 independent batches). l Immunoblot analysis of HL7702 cell after EVs/PBS treatment for 48 h. m Immunoblot analysis of liver sample collected from indicated tumor bearing mice. n According to the gates in phasor plot, LD region was segmented in livers of indicated groups. Scale bars, 20 μm. o Total cholesterol (TC) and triglycerides (TG) level in liver (n = 6) and serum (n = 5) in indicated tumor bearing mice (unpaired two-tailed t test). p Liver sections were stained with oil red O in indicated groups. Scale bars, 50 μm. Data are presented as mean ± s.d. Source data and exact P value are provided as a Source data file.
Fig. 3
Fig. 3. Circulating miR-9-5p promoted cholesterol to 25-HC conversion by targeting ATF3.
a Livers collected from mice xenografted with MDA-MB-231cells and 231/miR-9 KO cells were subjected to RNA-seq and GSEA, showing enrichment of genes related to oxysterol derived from cholesterol pathway (Permutation test, n = 3 mice per group). b Diagram of cholesterol conversion to oxysterol. c LC-MS/MS analysis of oxysterol derived from cholesterol in liver in indicated xenografted NSG mice (one-way ANOVA, n = 5 mice per group). d LC-MS/MS analysis of oxysterol derived from cholesterol in liver in indicated mice receiving tail vein injections of EVs (one-way ANOVA, n = 5 mice per group). e Quantification of gene expression in liver in indicated xenografted NSG mice by qRT-PCR (one-way ANOVA, n = 6 mice per group). f Quantification of gene expression in liver in indicated NSG mice receiving tail vein injections of EVs by qRT-PCR (one-way ANOVA, n = 6 mice per group). g Predicted miR-9-5p binding sites in human and mouse ATF3 genes. The corresponding sequences in WT and mutated reporters are shown. h Responsiveness of wild-type and mutant ATF3 3’UTR reporters to miR-9-5p in MCF-10A or MCF-10A/miR-9 cells. Luciferase reporter assay showing responsiveness of the reporters to transfected wild-type and mutant ATF3 3’UTR in MCF-10A and MCF-10A/miR-9 cell (unpaired two-tailed t test, n = 3 independent batches). i Quantification of gene expression in MCF-10A cell transfected with miR-9-5p mimic or control by qRT-PCR (one-way ANOVA, n = 3 independent batches). j Immunoblot analysis of MCF-10A cell transfected with miR-9-5p mimic or control. k Quantification of gene expression of primary hepatocytes after EVs/PBS treatment for 48 h by qRT-PCR (one-way ANOVA, n = 3 independent batches). l Immunoblot analysis of primary hepatocytes after EVs/PBS treatment for 48 h. m Immunoblot analysis of liver in indicated xenografted mice. n IHC of ATF3 and CH25H in liver sections in indicated xenografted mice. Scale bars, 100 μm. o Immunoblot analysis of liver in indicated mice received tail vein injections of EVs. p IHC of ATF3 and CH25H in liver sections in indicated mice received tail vein injections of EVs. Scale bars, 100 μm. Data are presented as mean ± s.d. Source data and exact P value are provided as a Source data file.
Fig. 4
Fig. 4. Oncometabolite 25-HC promoted breast cancer liver and lung metastasis.
a Tumor volume followed in indicated xenografted mice (two-way ANOVA, n = 5 mice per group). b, c Representative bioluminescence images and quantification of mice inoculated with indicated group (one-way ANOVA, n = 5 mice per group). d, e Representative IHC images showing Ki67 staining and the overall percentage of Ki67+ tumor cells (one-way ANOVA, n = 5 mice per group). Scale bar, 50 μm. f Schematic diagram of 25-HC treated mouse model. 231/Ctrl or 231/miR-9 KO cells injected at day 0. On day 10, mice were treated with vehicle or 25-HC (10 mg/kg) every other day. At day 35, tissue was harvested, imaged and fluorescence quantified. Experimental timeline outlined above quantified data. g, h Representative bioluminescence images and quantification of mice inoculated with indicated groups (one-way ANOVA, n = 5 mice per group). i Quantification of liver nodules (one-way ANOVA, n = 5 mice per group). j 25-HC levels of livers in each group by ELISA kit. (one-way ANOVA, n = 6 mice per group). Data are presented as mean ± s.d. Source data and exact P value are provided as a Source data file.
Fig. 5
Fig. 5. Ch25h blockage inhibited BC liver and lung metastasis.
a LC-MS/MS analysis of 25-HC in serum in indicated CH25H liver conditional knock out (Ch25hL–/–) and control (Ch25hfl/fl) mice (unpaired two-tailed t test, n = 6 mice per group). b Total cholesterol (TC) and triglyceride (TG) levels were examined from CH25H liver conditional knock out (Ch25hL–/–) and control (Ch25hfl/fl) mice. (unpaired two-tailed t test, n = 5 mice per group). c Liver sections were stained with oil red O in Ch25h–/– and Ch25hfl/fl mice with E0771 xenograft. Scale bars, 100 μm. d Representative PET/CT imaging with 18F-FDG for accessing liver and lung uptake and quantification in indicated in CH25H liver specific KO and WT mice. e Representative bioluminescence images of metastasis site in liver and lung and quantification of mice inoculated with indicated groups (unpaired two-tailed t test, n = 5 mice per group). f Representative IHC images showing Ki67 staining and the overall percentage of Ki67+ tumor cells in indicated groups (unpaired two-tailed t test, n = 5 per group). Scale bar, 50 μm. g Immunoblot analysis of CH25H in liver in indicated groups (top), IHC and of CH25H in liver sections in indicated groups (bottom). Scale bar, 50 μm. h Representative bioluminescence images of metastasis site in liver and lung and quantification of mice inoculated with indicated groups (unpaired two-tailed t test, n = 5 per group). i Representative IHC images showing Ki67 staining and the overall percentage of Ki67+ tumor cells of liver and lung from indicated groups (unpaired two-tailed t test, n = 5 per group). Scale bar, 50 μm. j Representative PET/CT imaging with 18F-FDG for accessing liver and lung uptake and quantification in indicated mice. Data are presented as mean ± s.d. Source data and exact P value are provided as a Source data file.
Fig. 6
Fig. 6. 25-HC induced Kupffer cells polarization into M2 type to promote liver metastasis.
a RAW264.7 cells treated with 25-HC and vehicle were subjected to RNA-seq and GSEA, showing enrichment of genes set related to macrophage pathway (Permutation test, n = 3 independent batches per group). b Quantification of purified Kupffer cells with CD11b+ and F4/80+ expression by flow cytometry in indicated groups. c IHC of F4/80 in liver and lung sections in indicated groups. Scale bar, 50 μm. d Representative bioluminescence images of liver and lung metastasis sites in indicated groups. e IHC of Ki67 in liver and lung sections in indicated groups. Scale bar, 50 μm. f Purified Kupffer cells were selected with TIM4+, I-A/I-Eint expression and stained and further analyzed for CD163 and CD11c expression. Representative flow cytometry results were shown. g Quantification of the M2/M1 ratio in flow cytometry results (one-way ANOVA, n = 3 independent batches). h RNA level in liver tissue of mice from indicated groups by qRT-PCR (unpaired two-tailed t test, n = 5 mice per group). i Heatmap showing the relative levels of selected genes related to tolerant macrophage pathway based on the RNA-seq data. j Relative mRNA level of Mafk in liver from indicated mice (unpaired two-tailed t test, n = 6 mice per group) (top); immunoblot analysis of liver in indicated mice (bottom). k The qRT-PCR of Mafk in the RAW264.7 cells after 25-HC treatment with a dose dependent for 48 h (unpaired two-tailed t test, n = 3 independent batches) (top); immunoblot analysis of Raw264.7 cells after 25-HC treatment with a dose dependent for 48 h (bottom). l Different expression and quantification of various chemokines in media derived from 25-HC treated or control-RAW264.7 cells was detected by a mouse chemokine array kit (n = 2 independent batches). Red boxes designate the chemokines whose expression was altered by 25-HC treatment. m TGF-β and IL-10 secreted from BMDM cells treated with vehicle and 25-HC were detected by ELISA kit (unpaired two-tailed t test, n = 6 independent batches). Data are presented as mean ± s.d. Source data and exact P value are provided as a Source data file.
Fig. 7
Fig. 7. Exogenous INSIGs and ATF3 blocked miR-9-5p-induced tumor metastasis.
a GFP signals in liver and lung from mice receiving tail vein injections of AAV-GFP, AAV-ATF3 and AAV-INSIG1 + INSIG2 virus. Scale bar, 100 μm. b Quantification of gene expression in liver from mice receiving tail vein injections of AAV-GFP, AAV-INSIG1 and AAV-INSIG2 virus. (unpaired two-tailed t test, n = 6 mice per group). c Western blots showing the expression of key proteins related to cholesterol synthesis in liver from mice receiving tail vein injections of AAV-GFP, AAV-INSIG1 and AAV-INSIG2 virus. d Total cholesterol (TC) and triglycerides (TG) in liver in indicated mice (unpaired two-tailed t test, n = 5 mice per group). e Western blots showing protein expression in liver from mice receiving tail vein injections of AAV-GFP and AAV-ATF3 virus. f Representative IHC images showing CH25H staining. Scale bar, 50 μm. g LC-MS/MS analysis of 25-HC level in liver in indicated groups (unpaired two-tailed t test, n = 5 mice for per group). h Body weight was monitored (two-way ANOVA, n = 6 mice per group). i, j Representative bioluminescence images and quantification of mice inoculated with indicated groups (one-way ANOVA, n = 5 mice per group). k Quantification of liver and lung metastatic nodules (unpaired two-tailed t test, n = 6 mice per group). l RNA level of Mki67 in liver and lung in indicated mice (unpaired two-tailed t test, n = 6 mice per group). m Representative IHC images showing Ki67 staining and the overall percentage of Ki67+ tumor cells (one-way ANOVA, n = 5 per group). Scale bar, 50 μm. n Western blots showing proteins in liver from mice receiving tail vein injections of AAV-GFP and AAV-ATF3 virus. o RNA level of M1 and M2 marker gene in liver and lung in indicated mice (unpaired two-tailed t test, n = 6 mice per group). p Purified Kupffer cells were selected with TIM4+, I-A/I-Eint expression and stained and further analyzed for CD163 and CD11c expression. Representative flow cytometry results were shown. q Quantification of the M2/M1 ratio in flow cytometry results (one-way ANOVA, n = 3 independent batches). Data are presented as mean ± s.d. Source data and exact P value are provided as a Source data file.
Fig. 8
Fig. 8. Silencing of miR-9-5p attenuated 25-HC-mediated tumor metastasis.
a Schematic diagram of antagomir treated mouse model. 231/Luc cells injected at day 0 in NSG mice. On day 14, tumor was detected. At day 28, mice were treated with antagomir (10 nmol) every 3 days untiled euthanized. 4T1/Luc cells injected at day 0 in BALB/c mice. On day 8, tumor was detected. At day 25, mice were treated with antagomir (10 nmol) every 3 days untiled euthanized, during which time the tumor was removed on day 28. b RT-qPCR-determined miR-9-5p levels in serum, tumor, liver and lung in 231/Luc cells xenografted mice treated with indicated antagomir and with 231/Ctrl, 231/Rab27a KD and 231/miR-9 KO mice (one-way ANOVA, n = 5 mice per group). c Representative PET/CT imaging with 18F-FDG for accessing liver and lung uptake and quantification in 4T1/Luc cells xenografted mice treated with indicated antagomir. d Representative bioluminescence images of metastasis site in liver and lung of xenografted mice treated with indicated antagomir and with 231/Ctrl, 231/Rab27a KD and 231/miR-9 KO mice. e Quantification of liver and lung metastasis of xenografted mice treated with indicated antagomir and with 231/Ctrl, 231/Rab27a KD and 231/miR-9 KO mice (one-way ANOVA, n = 5 mice per group). f Quantification of gene expression in liver from xenografted mice treated with indicated antagomir and with 231/Ctrl, 231/Rab27a KD and 231/miR-9 KO mice (one-way ANOVA, n = 5 mice per group). g Quantification of gene expression in liver from xenografted mice (one-way ANOVA, n = 5 mice per group). h Immunoblotting analysis of liver sample collected from xenografted mice treated with indicated antagomir and with 231/Ctrl, 231/Rab27a KD and 231/miR-9 KO mice. Data are presented as mean ± s.d. Source data and exact P value are provided as a Source data file.
Fig. 9
Fig. 9. Circulating miR-9-5p was correlated with BC patients with metastasis.
a RT-qPCR-determined miR-9-5p levels in an equal amount of EVs derived from indicated cells (normalized to miR-16) (unpaired two-tailed t test, n = 3 independent batches). b RT-qPCR-determined miR-9-5p levels of EVs in serum from indicated xenografted mice. (one-way ANOVA, n = 3 independent batches). c Representative images of miRNA in situ hybridization (miRNA-ISH) in liver metastases from breast cancer patients. Scale bar, 50 μm. d RT-qPCR-determined miR-9-5p levels in serum from normal or BC patient with or without metastasis (unpaired two-tailed t test, n = 5). e Expression levels of miR-9-5p in BRCA tumor samples from the TCGA database. Statistical significance was assessed using two-tailed Mann–Whitney test (left, n = 1102 for Tumor and n = 104 for Normal) and paired two-tailed Student’s t test (right, n = 103). f Expression levels of miR‑9-5p in BRCA tumor samples from the GEO database. Box plots show minima, maxima, median bounds of box and quartiles (one-way ANOVA for left, n = 59 for Normal, n = 169 for Tumor, n = 54 for Metastasis; paired two-tailed t test for right, n = 59). g Expression levels of miR-9-5p in different stage of BRCA tumor samples. Box plots show minima, maxima, median bounds of box and quartiles (one-way ANOVA, n = 104 for normal, n = 182 for stage I, n = 609 for stage II, n = 244 for stage III, n = 20 for stage IV). h IHC analysis of HMGCR, CH25H, INSIG1, INSIG2 and ATF3 expression in liver metastases from breast cancer and non-BC individuals. Scale bar, 100 μm. i LC-MS/MS analysis of oxysterol derived from cholesterol in serum from normal and BC patients (unpaired two-tailed t test, n = 15 per group). j Correlation analysis of MRC1 and Ki67 expression IHC from BC patients metastatic liver. The two-tailed Pearson’s r was indicated (n = 7). k Schematic summary of this study. Data are presented as mean ± s.d. Source data and exact P value are provided as a Source data file.

References

    1. Siegel, R. L., Miller, K. D., Fuchs, H. E. & Jemal, A. Cancer statistics, 2022. CA Cancer J. Clin.72, 7–33 (2022). - PubMed
    1. Siegel, R. L., Miller, K. D., Fuchs, H. E. & Jemal, A. Cancer statistics, 2021. CA Cancer J. Clin.71, 7–33 (2021). - PubMed
    1. Minn, A. J. et al. Genes that mediate breast cancer metastasis to lung. Nature436, 518–524 (2005). - PMC - PubMed
    1. Kim, M. Y. Breast cancer metastasis. Adv. Exp. Med. Biol.1187, 183–204 (2021). - PubMed
    1. Li, P. et al. Lung mesenchymal cells elicit lipid storage in neutrophils that fuel breast cancer lung metastasis. Nat. Immunol.21, 1444–1455 (2020). - PMC - PubMed

Publication types

MeSH terms

Associated data