. 2024 Dec 3;15(1):10541.
doi: 10.1038/s41467-024-54788-9.

Cell polarity proteins promote macropinocytosis in response to metabolic stress

Affiliations

Cell polarity proteins promote macropinocytosis in response to metabolic stress

Guillem Lambies et al. Nat Commun. .

Abstract

Macropinocytosis has emerged as a scavenging pathway that cancer cells exploit to survive in a nutrient-deprived microenvironment. Tumor cells are especially reliant on glutamine for their survival, and in pancreatic ductal adenocarcinoma (PDAC) cells, glutamine deficiency can enhance the stimulation of macropinocytosis. Here, we identify the atypical protein kinase C (aPKC) enzymes, PKCζ and PKCι, as regulators of macropinocytosis. In normal epithelial cells, aPKCs associate with the scaffold proteins Par3 and Par6 to regulate cell polarity, affecting several targets, including the Par1 kinases and we find that each of these proteins is required for macropinocytosis. Mechanistically, aPKCs are regulated by EGFR signaling or by the transcription factor CREM to promote the Par3 relocation to microtubules, facilitating macropinocytosis in a dynein-dependent manner. Importantly, cell fitness impairment caused by aPKC depletion is rescued by the restoration of macropinocytosis and aPKCs support PDAC growth in vivo. Our findings enhance our understanding of the mechanistic underpinnings that control macropinocytic uptake in the context of metabolic stress.


Conflict of interest statement

Competing interests: C.C. is an inventor on a U.S. patent titled “Cancer diagnostics, therapeutics, and drug discovery associated with macropinocytosis,” Patent number: US-11209420-B2. The remaining authors declare no competing interests.

Figures
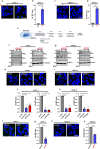
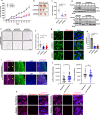
Fig. 1
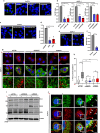
Fig. 1. PKCζ and PKCι are required for glutamine stress-induced macropinocytosis in PDAC cells.
a, b Representative fluorescent microscopy images from a FITC-dextran (green) macropinocytosis assay (a) and macropinocytosis quantification (b) in AsPC-1 cells cultured in glutamine-replete (2 mM, + Q) or glutamine-starved (0 mM, -Q) media for 24 h. Nuclei are stained with DAPI (blue). Data are shown relative to + Q. N = 3. Scale bar, 20 μm. *P(+Q vs -Q) = 0.0142. c, d Representative images (c) and quantification (d) of macropinocytosis in HPAF-II cells cultured in glutamine-replete (+ Q) or glutamine-starved (− Q) media. N = 3. Scale bar, 20 μm. **P(+Q vs -Q) = 0.0026. e Schematic depicting the steps employed for the siRNA kinome-wide screen in glutamine-stressed AsPC-1 cells. Created in BioRender. Commisso, C. (2022) BioRender.com/o37o964. f, g Immunoblots assessing PKCζ and PKCι levels in AsPC-1 (f) and HPAF-II (g) cells after transfection with non-targeting control siRNA (siCTRL) or siRNAs targeting PRKCZ (siPRKCZ#1 and siPRKCZ#2) and PRKCI (siPRKCI#1 and siPRKCI#2). β-actin was used as a loading control except for AsPC-1 cells transfected with PRKCI siRNAs, where α-tubulin was used. h, i Representative images of macropinocytosis in glutamine-starved AsPC-1 (h) and HPAF-II (i) cells transfected with the indicated siRNAs. Scale bar, 20 μm. j Quantification of macropinocytosis in glutamine-starved AsPC-1 cells transfected with the indicated siRNAs. Data are shown relative to siCTRL. N = 3. *P(siCTRL vs siPRKCZ#1) = 0.0234; *P(siCTRL vs siPRKCZ#2) = 0.0154; **P(siCTRL vs siPRKCI#1) = 0.0065; **P(siCTRL vs siPRKCI#2) = 0.0011). k Quantification of macropinocytosis in glutamine-starved HPAF-II cells transfected with the indicated siRNAs. Data are shown relative to siCTRL. N = 3. **P(siCTRL vs siPRKCZ#1) = 0.0035; *P(siCTRL vs siPRKCZ#2) = 0.0151; **P(siCTRL vs siPRKCI#1) = 0.0028; *P(siCTRL vs siPRKCI#2) = 0.0107. l, m Representative images (l) and quantification (m) of macropinocytosis in glutamine-starved AsPC-1 cells treated with vehicle (water) or ACPD at 4 μM for 72 hrs. Data are shown relative to the vehicle. N = 3. Scale bar, 20 μm. *P (Vehicle vs ACPD) = 0.0102. n, o Representative images (n) and quantification (o) of macropinocytosis in glutamine-starved HPAF-II cells treated with vehicle or ACPD at 25 μM for 72 hrs. Scale bar, 20 μm. **P (Vehicle vs ACPD) = 0.002. Statistical significance was calculated using unpaired two-tailed Student’s t test with Welch’s correction. *P < 0.05, **P < 0.01. All data are presented as the mean ± SEM. N indicates independent experiments. Source data are provided as a Source Data file.
Fig. 2
Fig. 2. Par polarity proteins and the microtubule network are required for macropinocytosis.
a, b Representative images (a) and quantification (b) of macropinocytosis in glutamine-starved AsPC-1 cells transfected with the indicated siRNAs. Data are shown relative to siCTRL. N = 3. Scale bar, 20 μm **P(siCTRL vs siPAR1a#1 = 0.007); *P(siCTRL vs siPAR1a#2=0.0192); *P(siCTRL vs siPARD3#1 = 0.0368); **P (siCTRL vs siPARD3#2 = 0.0044); ***P(siCTRL vs siPARD6B#1 = 0.0004); **P(siCTRL vs siPARD6B#2 = 0.001). c, d Representative images (c) and quantification (d) of macropinocytosis in glutamine-starved AsPC-1 cells treated for 18 hrs with vehicle (water) or the microtubule inhibitors colchicine (COL, 100 ng/mL) and paclitaxel (PTX, 200 nM). Data are shown relative to the vehicle. N = 3. Scale bar, 20 μm. *P(vehicle vs COL = 0.0104); *P(vehicle vs PTX) = 0.0138). e, f Representative images (e) and quantification (f) of macropinocytosis in glutamine-starved AsPC-1 cells treated with vehicle (water) or the dynein inhibitor Ciliobrevin D (Ciliob D) for 30 minutes at 50 μM. Data are shown relative to the vehicle. N = 3. Scale bar, 20 μm. **P(vehicle vs Ciliob D = 0.0027). g Par3 protein (red) and Tubulin (green) immunostaining in AsPC-1 cells transfected with the indicated siRNAs and cultured in glutamine-replete (+) or glutamine-free (−) media. Nuclei are stained with DAPI (blue). Images are representative of N = 2. Scale 20 μm. The bottom row is higher magnification images of the boxed areas. Scale bar, 4 μm. h Quantification of the percent of Par3 protein found in subcellular puncta versus the cytoplasm in cells transfected with siCTRL (n = 42 cells/ + Q, n = 44 cells/-Q), siPRKCZ (n = 40 cells/ + Q, n = 35 cells/ − Q) or siPRKCI (n = 39 cells/ + Q, n = 38 cells/-Q). For data presentation, outliers were removed using a ROUT method test. All significant P were < 0.0001; nsP(siPRKCZ+Q vs siPRKCZ -Q) = 0.89); nsP(siPRKCI+Q vs siPRKCI -Q) = 0.291). i Immunoblot of Par3 and aPKCs proteins for the conditions described in (g). β-actin is used as a loading control. Data are representative of N = 3. j Dynein (green) and Par3 (red) protein immunostaining in AsPC-1 cells cultured in glutamine-replete (+) or free (-) media. Images are representative of N = 2. Scale bar, 10 μm. The second and fourth columns are higher magnification images of the boxed areas. Scale bar, 2 μm. Statistical significance was calculated using unpaired two-tailed Student’s t test with Welch’s correction. Ns, non-significant, *P < 0.05, **P < 0.01, ***P < 0.001. Data are presented as the mean ± SEM except for (h), where data are presented as a minimum to maximum box-and-whisker plot with the median indicated by the center line. N indicates independent experiments. Source data are provided as a Source Data file.
Fig. 3
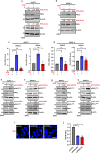
Fig. 3. Glutamine deprivation primes aPKCs for activation through the EGFR signaling pathway.
a, b Immunoblots assessing PKCζ and PKCι total protein levels in AsPC-1 (a) and HPAF-II (b) cells cultured for 24 hrs in glutamine-replete media treated with vehicle (water) or 2 mM DON or cultured in glutamine-free conditions. β-actin was used as a loading control. Data are representative of at least N = 3. Densitometry quantifications are presented relative to the vehicle control and normalized to β-actin. c Relative PRKCZ and PRKCI mRNA levels as assessed by RT-qPCR in AsPC-1 cells cultured in the conditions described in (a) and (b). Data are shown relative to the vehicle control. N = 3. PRKCZ: *P(Vehicle control vs DON) = 0.017); nsP(Vehicle control vs -Q) = 0. 0.7738; PRKCI: *P (Vehicle control vs DON) = 0.0233); nsP(Vehicle control vs -Q) = 0.7411. d Relative PRKCZ and PRKCI mRNA levels as assessed by RT-qPCR in HPAF-II cells cultured in the conditions described in (a) and (b). Data are shown relative to the vehicle control. N = 4. PRKCZ: *P(Vehicle control vs DON) = 0.0335); nsP(Vehicle control vs -Q) = 0.9124; PRKCI: *P(Vehicle control vs DON) = 0.0356; nsP(Vehicle control vs -Q) = 0.6503. e, f Immunoblots assessing levels of the phospho-proteins p-PKCζT560 and p-PKCιT555, and total PKCζ and PKCι protein levels in AsPC-1 (e) and HPAF-II (f) cells cultured in glutamine-replete or glutamine-free media. β-actin was used as a loading control. Densitometry quantifications are presented relative to the glutamine-replete condition and values for the phospho-forms are normalized to the total protein. Data are representative of at least N = 3. g, h Similar immunoblots as in (e) and (f) in AsPC-1 (g) and HPAF-II (h) cells cultured in glutamine-replete media treated with vehicle or DON. Densitometry quantifications are presented relative to vehicle and values for the phospho-forms are normalized to the total protein. Data are representative of N = 2. i, j Representative images (i) and quantification (j) of macropinocytosis in AsPC-1 cells transfected with the indicated siRNAs and cultured in glutamine-replete media treated with EGF at 100 nM for 10 min. Data are shown relative to siCTRL. N = 3. Scale bar, 20 μm.**P(siCTRL vs siPRKCZ) = 0.0026); *P(siCTRL vs siPRKCI) = 0.0106. Statistical significance was calculated using unpaired two-tailed Student’s t test with Welch’s correction. ns, non-significant, *P < 0.05, **P < 0.01. All data are presented as the mean ± SEM. N indicates independent experiments. Source data are provided as a Source Data file.
Fig. 4
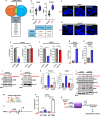
Fig. 4. DON upregulates aPKC expression through the transcription factor CREM.
a Predicted transcription factors binding to the PRKCZ and PRKCI promoters based on the ChEA dataset. b Top: Violin plot showing CREM and RCOR3 transcript counts in AsPC-1 cells treated with vehicle or DON (2 mM, 24 h) as assessed by RNA-seq. Bottom: Fold-change relative to vehicle and q-values for CREM and RCOR3 transcripts. c, d Representative images of macropinocytosis in DON-treated AsPC-1 (c) and HPAF-II (d) cells transfected with indicated siRNAs. Scale bar, 20 µm. e Quantification of macropinocytosis in AsPC-1 cells under the conditions described in (c). Values are relative to siCTRL. N = 4 (siCREM) or N = 3 (siRCOR3). **P(siCTRL vs siCREM) = 0.0019; nsP(siCTRL vs siRCOR3) = 0.5820. f Quantification of macropinocytosis in HPAF-II cells under the conditions described in (d). Values are relative to siCTRL. N = 3. **P(siCTRL vs siCREM) = 0.0086; nsP(siCTRL vs siRCOR3) = 0.5718. g Relative CREM mRNA levels measured by RT-qPCR in AsPC-1 cells treated with vehicle or DON (2 mM, 24 h). N = 3. **P(Vehicle vs DON) = 0.0049. h Relative CREM mRNA levels measured by RT-qPCR in HPAF-II cells in conditions described in (g). N = 3. *P(Vehicle vs DON) = 0.0314. i, j Immunoblots assessing CREM protein levels in AsPC-1 (i) and HPAF-II (j) cells cultured in glutamine-replete media containing vehicle or DON (2 mM, 24 h). β-actin was used as a loading control. Data are representative of N = 3. Densitometry quantifications are presented relative to vehicle and values are normalized to β-actin. k Relative PRKCZ and PRKCI mRNA levels assessed by RT-qPCR in the vehicle and DON-treated AsPC-1 cells transfected with indicated siRNAs. N = 3. PRKCZ: *P(siCTRL vehicle vs siCTRL DON) = 0.0153; *P(siCTRL DON vs siCREM DON) = 0.0498; nsP(siCREM vehicle vs siCREM DON) = 0.2779; PRKCI: **P(siCTRL vehicle vs siCTRL DON) = 0.002; *P(siCTRL vehicle vs siCREM DON) = 0.0479; nsP(siCREM vehicle vs siCREM DON) = 0.7431. l Immunoblots assessing aPKC total protein levels in AsPC-1 cells cultured in glutamine-replete media containing vehicle or DON. β-actin was used as a loading control. Data are representative of at least N = 3. Densitometry quantifications are presented relative to vehicle and values are normalized to β-actin. m Consensus sequence of CREM binding motif obtained from the JASPAR CORE database. n Location of the CRE consensus sequence in the PRKCZ promoter. o Fold enrichment of CREM binding to PRKCZ gene promoter in AsPC-1 cells cultured in glutamine-replete media containing vehicle or DON. N = 3. ***P(DON + IgG vs DON + CREM) = 0.0004; ***P(Vehicle + CREM vs DON + CREM) = 0.0002; nsP(Vehicle + IgG vs Vehicle + CREM) = 0.0743. p Graphical depiction of macropinocytosis regulated by aPKC isoforms during glutamine stress. Statistical significance was determined by unpaired two-tailed Student’s t test with Welch’s correction. ns, non-significant, *P < 0.05, **P < 0.01, ***P < 0.001. All data are presented as the mean ± SEM. N indicates independent experiments. Source data are provided as a Source Data file.
Fig. 5
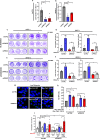
Fig. 5. aPKCs modulate PDAC cell fitness and sensitivity to glutamine scarcity through macropinocytosis.
a Relative cell growth of AsPC-1 cells transfected with the indicated siRNAs and cultured in low glutamine (0.1 mM) media for 6 days. Cell number was assessed by Syto60 staining and values are relative to the day 0 timepoint. N = 4. *P(siCTRL vs siPRKCZ) = 0.0138; *P(siCTRL vs siPRKCI) = 0.0365. b Relative cell growth of HPAF-II cells transfected with the indicated siRNAs and cultured in low glutamine (0.05 mM) media for 6 days. Cell number was assessed by crystal violet staining and values are relative to the day 0 timepoint. N = 4.***P(siCTRL vs siPRKCZ) = 0.0003; ***P(siCTRL vs siPRKCI) = 0.0003. c, d Representative crystal violet staining (c) and cell growth quantification (d) of AsPC-1 cells cultured for 6 days with 0 mM glutamine, with and without 2% BSA. Cell number values are relative to the day 0 timepoint. N = 3. *P(siCTRL vs siCTRL+BSA) = 0.0234; *P(siCTRL +BSA vs siPRKCZ + BSA) = 0.0397; nsP(siPRKCZ vs siPRKCZ +BSA) = 0.1699; *P(siCTRL +BSA vs siPRKCI + BSA) = 0.038); nsP(siPRKCI vs siPRKCI +BSA) = 0.1246. e, f Representative crystal violet staining (e) and cell growth quantification (f) in HPAF-II cells cultured for 6 days with 0.05 mM glutamine, with and without 2% BSA. Cell number values are relative to the day 0 timepoint. N = 3. *P(siCTRL vs siCTRL+BSA) = 0.0432; **P(siCTRL +BSA vs siPRKCZ + BSA) = 0.0054; nsP(siPRKCZ vs siPRKCZ +BSA) = 0.8177; *P(siCTRL +BSA vs siPRKCI + BSA) = 0.0101; nsP(siPRKCI vs siPRKCI +BSA) = 0.321. g, h Representative images of macropinocytosis (g) and quantification (h) in AsPC-1 cells cultured for 6 days in 0.1 mM glutamine and co-transfected with indicated siRNAs and either empty vector (EV) or Myc-Pak1-WT/T423E. Values are relative to siCTRL + EV. N = 3. Scale bar, 20 μm.*P(siCTRL vs siCTRL+Pak1 WT) = 0.0333; *P(siCTRL vs siCTRL+Pak1 T423E) = 0.0225; *P(siCTRL vs siPRKCZ) = 0.0122; **P(siPRKCZ vs siPRKCZ+Pak1 WT) = 0.0096; *P(siPRKCZ vs siPRKCZ+Pak1 T423E) = 0.0451. i Quantification of cell growth for the conditions described in (g) and (h) with and without supplementation of BSA. Cell number was assessed by crystal violet after 12 days. Data are shown relative to the day 0 timepoint. N = 3. *P(siCTRL vs siCTRL +BSA) = 0.0187; nsP(siCTRL+BSA vs siCTRL+Pak1 WT+BSA) = 0.3109; nsP(siCTRL+BSA vs siCTRL+Pak1 T423E+BSA) = 0.4076; **P(siCTRL+BSA vs siPRKCZ + BSA) = 0.0071; *P(siPRKCZ+BSA vs siPRKCZ + Pak1 WT+BSA) = 0.0152; *P(siPRKCZ+BSA vs siPRKCZ + Pak1 T423E+BSA) = 0.0173; nsP(siPRKCZ vs siPRKCZ + BSA) = 0.5386; *P(siPRKCZ+Pak1 WT vs siPRKCZ + Pak1 WT+BSA) = 0.0364; *P(siPRKCZ+Pak1 T423E vs siPRKCZ + Pak1 T423E+BSA) = 0.041. Statistical analysis used unpaired two-tailed Student’s t test. Welch’s correction in (h). ns, non-significant, *P < 0.05, **P < 0.01, ***P < 0.001. All data are presented as mean ± SEM. N indicates independent experiments. Source data are provided as a Source Data file.
Fig. 6
Fig. 6. aPKCs support tumor growth and are required for macropinocytosis in vivo.
a Growth curves for AsPC-1-derived heterotopic xenograft tumors expressing the indicated Doxycycline (Dox)-inducible shRNAs. Dox was provided in the drinking water and diet. A total of n = 8 tumors were measured per condition. ***P(shCTRL vs shPRKCZ)< 0.0001; ***P(shCTRL vs shPRKCI)< 0.0001. b Representative photos of the xenograft tumors at termination. c Measurement of tumor weights at termination for n = 8 tumors per condition. ***P(shCTRL vs shPRKCZ)<0.0001; ***P(shCTRL vs shPRKCI) = 0.0003. d Immunoblots assessing PKCζ and PKCι protein levels in the tumors at termination. n = 5 and n = 4 knockdown tumors for PKCζ and PKCι, respectively, were analyzed relative to two different control tumors. e Representative images of p-HistoneH3 staining in two different tumors per condition. Scale bar, 100 μm. f Quantification of p-HistoneH3 staining in tumor sections of shCTRL (n = 44 fields), shPRKCZ (n = 46 fields) and shPRKCI (n = 43 fields). Fields were quantified from n = 3 tumors for each condition. ***P(shCTRL vs shPRKCZ)< 0.0001; ***P(shCTRL vs shPRKCI)< 0.0001. g Representative images of macropinocytosis in tumors expressing the indicated shRNAs, with macropinosomes labeled with TMR-dextran (red) and tumor cells labeled with CK8 (green). Nuclei are stained with DAPI (blue). Scale bar, 20 µm. h Macropinocytosis quantification in n = 6 tumors (shCTRL and shPRKCZ) and n = 5 tumors (shPRKCI). Data are shown relative to shCTRL. ***P(shCTRL vs shPRKCZ)<0.0001; ***P(shCTRL vs shPRKCI)< 0.0001. i Immunofluorescent staining of p-PKCζT560 or total PKCζ (purple) in control tumors, with CK8 (green) delineating peripheral and non-peripheral regions. Pictures are representative of n = 4 tumors from the control group. Scale bar,100 µm. j Quantification of peripheral and non-peripheral staining for p-PKCζT560 (n = 57 fields/periphery, n = 62 fields/non-periphery) and total PKCζ (n = 50 fields/periphery, n = 51 fields/non-periphery) in control tumors. p-PKCζT560: ***P(non-periphery vs periphery)<0.0001); PKCζ: nsP(non-periphery vs periphery) = 0.1385. k Representative co-staining images of p-PKCζT560 and total PKCζ (purple) with macropinosomes (red) in peripheral and non-peripheral regions. Nuclei labeled with DAPI (blue). Scale bar, 20 µm Statistical significance was calculated using two-way ANOVA with Tukey’s multiple comparison test for (a) at day 47. For (c, f, h, and j), statistical significance was calculated using an unpaired two-tailed Student’s t test. ns, non-significant, *P < 0.05, **P < 0.01, ***P < 0.001. All data are presented as the mean ± SEM. Source data are provided as a Source Data file.
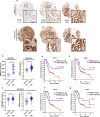
Fig. 7
Fig. 7. aPKCs and Par polarity proteins are upregulated in PDAC patient tumors, and their high expression correlates with worse prognosis.
a Representative immunohistochemical staining for p-PKCζT560 and total PKCζ from clinical samples on a tissue microarray (TMA) containing 152 surgically resected human PDAC specimens. Individual patient samples stained with p-PKCζT560 were pathologically classified according to staining intensity. Images of the TMA samples from the same patient are aligned in columns. Scale bars: 200 μm (low magnification) and 50 μm (high magnification). b, c PRKCI (b) and PARD6B and PAR1a (c) transcript levels in PDAC human samples and normal pancreatic tissue (adjacent non-neoplastic tissue) from the indicated GSE datasets. Number of patient samples for each group is indicated in parentheses. GSE16515: PRKCI: ***P(normal vs tumor) < 0.0001; GSE62452: PRKCI: ***P(normal vs tumor)  <0.0001; PAR1a: ***P(normal vs tumor) < 0.0001; PAR1a: **P(normal vs tumor) = 0.0075. d, e Overall survival in patients with high and low expression of PRKCI (d) and PRKCZ (e). Number of patients included in each group is indicated in parentheses. f, g Overall survival in patients with high and low expression of PARD6B (f) and PARD3 (g). Number of patients included in each group is indicated in parentheses. Statistical significance was calculated using unpaired two-tailed Student’s t test for (b, c). For (dg), P-values were determined with the Log-rank test. **P < 0.01, ***P < 0.001. Data are presented as the mean ± SEM in (b, c).

Update of

References

    1. Bloomfield, G. & Kay, R. R. Uses and abuses of macropinocytosis. J. Cell Sci.129, 2697–2705 (2016). - PubMed
    1. Recouvreux, M. V. & Commisso, C. Macropinocytosis: A metabolic adaptation to nutrient stress in cancer. Front. Endocrinol.8, 261 (2017). - PMC - PubMed
    1. Palm, W. Metabolic functions of macropinocytosis. Philos. Trans. R. Soc. Lond. B Biol. Sci.374, 20180285 (2019). - PMC - PubMed
    1. Commisso, C. et al. Macropinocytosis of protein is an amino acid supply route in Ras-transformed cells. Nature497, 633–637 (2013). - PMC - PubMed
    1. Lee, S. W. et al. EGFR-Pak signaling selectively regulates glutamine deprivation-induced macropinocytosis. Dev. Cell50, 381–392 (2019). - PMC - PubMed

Publication types

MeSH terms

Associated data