. 2024 Dec 3;15(1):10380.
doi: 10.1038/s41467-024-54564-9.

Multiple insular-prefrontal pathways underlie perception to execution during response inhibition in humans

Affiliations

Multiple insular-prefrontal pathways underlie perception to execution during response inhibition in humans

Takahiro Osada et al. Nat Commun. .

Abstract

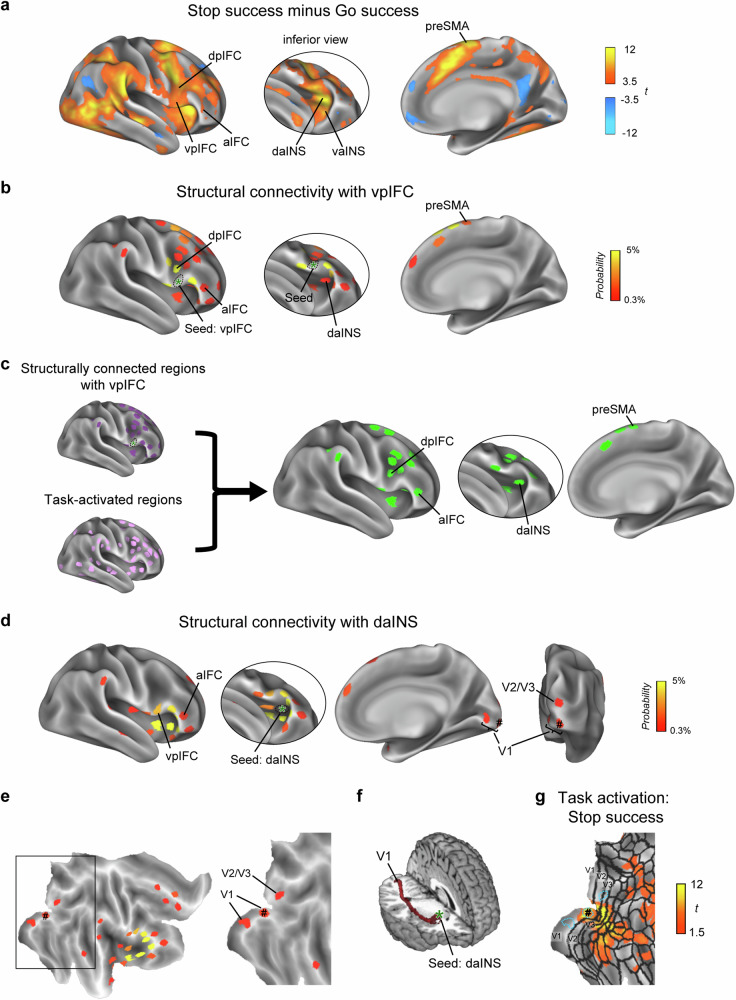
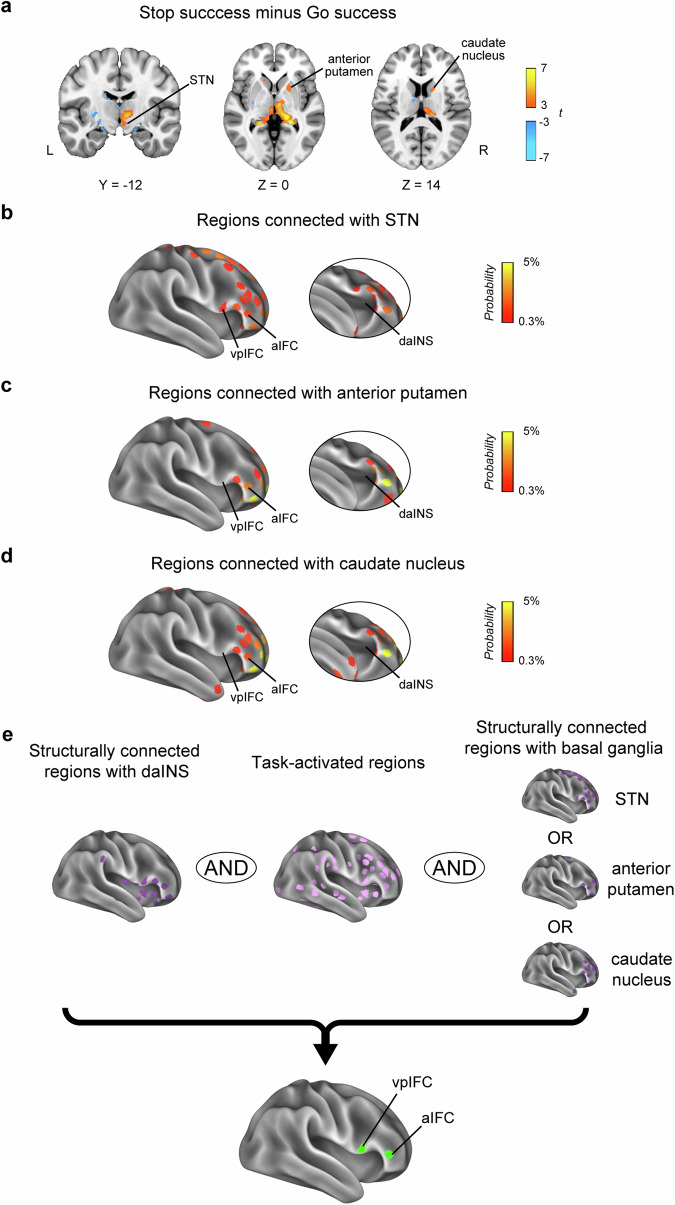
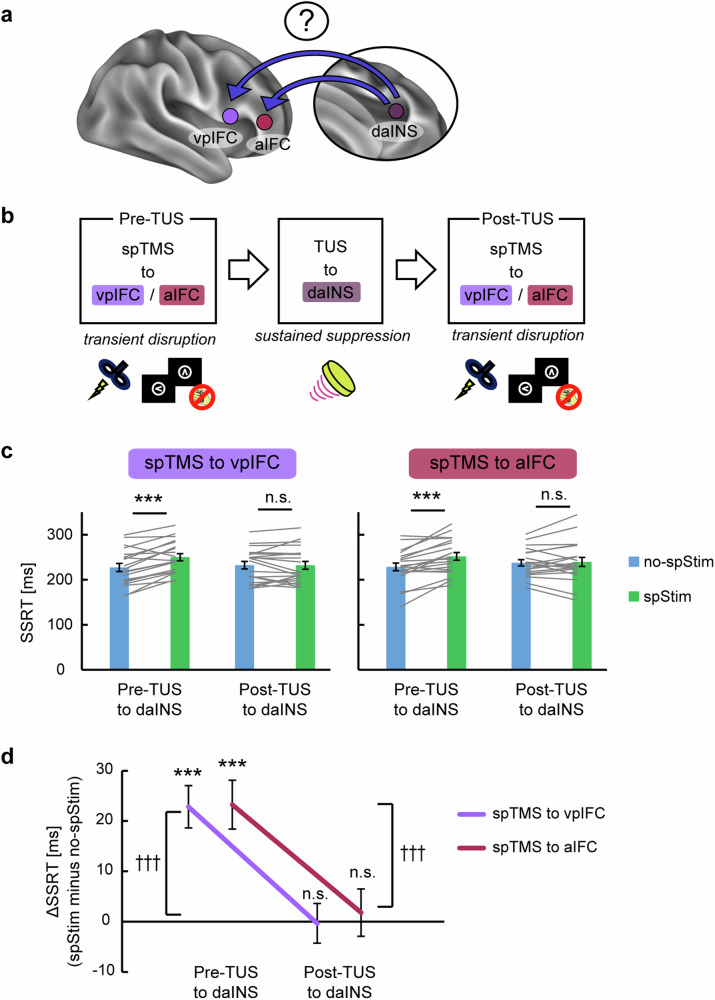
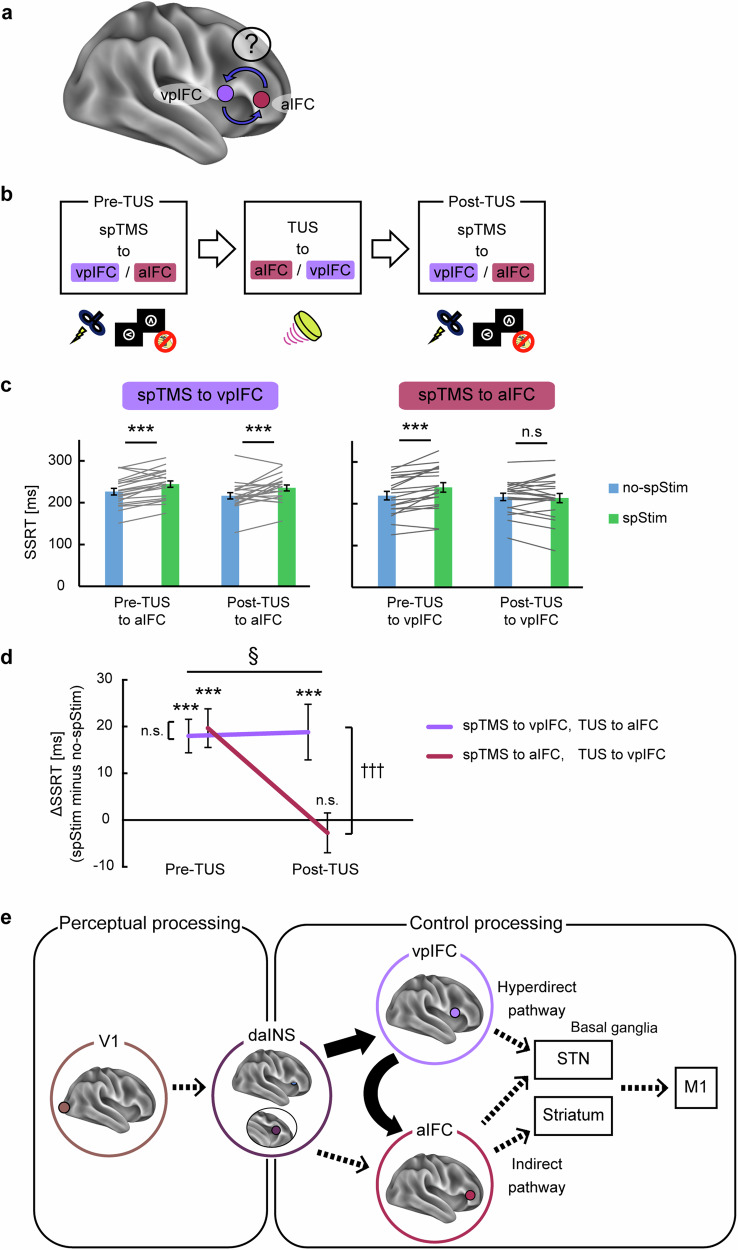
Inhibiting prepotent responses in the face of external stop signals requires complex information processing, from perceptual to control processing. However, the cerebral circuits underlying these processes remain elusive. In this study, we used neuroimaging and brain stimulation to investigate the interplay between human brain regions during response inhibition at the whole-brain level. Magnetic resonance imaging suggested a sequential four-step processing pathway: initiating from the primary visual cortex (V1), progressing to the dorsal anterior insula (daINS), then involving two essential regions in the inferior frontal cortex (IFC), namely the ventral posterior IFC (vpIFC) and anterior IFC (aIFC), and reaching the basal ganglia (BG)/primary motor cortex (M1). A combination of ultrasound stimulation and time-resolved magnetic stimulation elucidated the causal influence of daINS on vpIFC and the unidirectional dependence of aIFC on vpIFC. These results unveil asymmetric pathways in the insular-prefrontal cortex and outline the macroscopic cerebral circuits for response inhibition: V1→daINS→vpIFC/aIFC→BG/M1.


Conflict of interest statement

Competing interests: The authors declare no competing interests.

Figures

Fig. 1
Fig. 1. Experiment overview.
a The coordination of the response inhibition process involves intricate interactions between perceptual and control processing. Perceptual processing originates in the primary visual cortex (V1), whereas control processing is mediated by the inferior frontal cortex (IFC) of the prefrontal cortex, the basal ganglia, and the primary motor cortex (M1). The cerebral pathway through which information travels from the V1 to the prefrontal cortex and subsequently to the basal ganglia/M1 remains elusive. b Functional and diffusion magnetic resonance imaging (MRI) were used to trace the upstream pathway relative to the ventral part of the posterior IFC (vpIFC), bridging the vpIFC and V1 (left). Subsequently, transcranial ultrasound stimulation (TUS) and transcranial magnetic stimulation (TMS) were employed to investigate the behavioral causality of the identified region (right). c Functional and diffusion MRI were employed to track the downstream pathway to the basal ganglia (left). Subsequently, TUS and TMS were used to investigate the behavioral causality of the identified regions and the interaction among them (right). Elements in (b, c) are adapted from refs. ,.
Fig. 2
Fig. 2. Brain activity during response inhibition and structural connectivities between the vpIFC and cerebrocortical regions and between the daINS and V1.
a Group-level vertex-wise brain activity during response inhibition (Stop success vs. Go success) on an inflated surface of the right cerebral cortex. The data were calculated from 50 subjects in our experiment. Color scales indicate the t values in the vertices. Left: lateral view, middle: inferior view to show the inside of the lateral sulcus, right: medial view. vpIFC ventral posterior inferior frontal cortex, dpIFC dorsal posterior inferior frontal cortex, aIFC anterior inferior frontal cortex, daINS dorsal anterior insula, vaINS ventral anterior insula, preSMA presupplementary motor area. b The spatial distribution of the regions of interest (ROIs) of the cerebrocortical parcels (i.e., functional areas) for the structural connectivity when the right vpIFC was set as a seed using probabilistic tractography. The data were calculated from 50 subjects in the Human Connectome Project (HCP) database. Color scales indicate the probability of structural connectivity. c The tractography data were underwent thresholding based on the functional MRI task activation data. In total, 19 regions showed both structural connectivity with the vpIFC and task-related activation during response inhibition. d The spatial distribution of the ROIs of the cerebrocortical parcels for the structural connectivity when the right daINS was set as a seed. The data were calculated from 50 subjects in the HCP database. The foveal V1 region is indicated with #. e The distribution of structural connectivity is shown on a flat map of the right cerebral cortex. Left: a flat map of the right hemisphere, right: an enlarged view highlighting the occipital visual cortex. f Tracts connecting the daINS and V1 in the right hemisphere are shown in a 3D view from a representative subject. g Group-level vertex-wise brain activity during the stop-signal task on the flat map (Stop success). Blue dotted lines delineate ROIs of the cerebrocortical parcels for V1 and V2/V3. Black lines delineate the boundaries of the parcellated areas reported in ref. .
Fig. 3
Fig. 3. TUS effects on the anterior insula during response inhibition.
a The dorsal anterior insula (daINS) was targeted by transcranial ultrasound stimulation (TUS) while the ventral anterior insula (vaINS) was examined as a control. b Experimental procedures. Subjects performed the stop-signal task before and after TUS. Three and five runs were conducted before and after TUS, respectively (pre- and post-TUS). c Simulated intracranial intensity for the daINS and vaINS in horizontal and coronal slices in the normalized MNI space from a representative subject. ls, lateral sulcus. d Time courses of the stop-signal reaction times (SSRTs) before and after TUS (n = 20 subjects). A dashed line indicates baseline SSRTs in pre-TUS. Error bars indicate the standard error of means (SEM) of the subject. *P < 0.05, ***P < 0.001, paired t-test, two-sided. e SSRTs before and after TUS (n = 20 subjects). Gray lines indicate data from each subject. Error bars indicate SEM. The daINS showed the sustained disruption of response inhibition performance after TUS (mean difference in SSRT: 12.1 ms, 95% confidence interval (CI) = [6.6, 17.7], t(19) = 4.5, P = 2.2 × 10−4, paired t-test). The vaINS did not exhibit significant disruption of response inhibition performance (mean difference: 4.7 ms, 95% CI = [−0.3, 9.7], t(19) = 2.0, P = 0.06, paired t-test). The significance level of the daINS overcame the multiple comparisons by Bonferroni correction by 2 fold (number of areas). Source data are provided as a Source Data file. Elements in (b) are adapted from refs. ,.
Fig. 4
Fig. 4. Brain activity in the basal ganglia and structural connectivity between the basal ganglia and IFC areas.
a Group-level voxel-wise brain activity during response inhibition (Stop success vs. Go success) in the basal ganglia. Only activation with the subcortical regions is shown for display purposes. STN, subthalamic nucleus. The spatial distributions of the ROIs of the cerebrocortical parcels for the structural connectivity when the right STN (b), anterior putamen (c), and caudate nucleus (d) were set as a seed using probabilistic tractography. e Cerebrocortical regions were explored that met the following three criteria: (i) structural connectivity with the daINS, (ii) task-related functional MRI activation, and (iii) structural connectivity with any of the three basal ganglia regions. Two regions were found to meet these criteria: the vpIFC and aIFC.
Fig. 5
Fig. 5. Effects of single-pulse TMS on the areas in the IFC.
a The anterior IFC (aIFC) and the ventral posterior IFC (vpIFC). b Experimental design. Single-pulse transcranial magnetic stimulation (spTMS) was applied to half of the Go and Stop trials. The timing of TMS in spStim trials was derived based on the stop-signal reaction time (SSRT) in no-spStim trials. ΔSSRT: difference in the SSRT between spStim and no-spStim trials. c ΔSSRT across different time windows for spTMS to the aIFC (n = 20 subjects). Error bars indicate SEM. Circles indicate data from each subject. ***P < 0.001, paired t-test, two-sided. Significant ΔSSRT was specifically observed in the time window of −90 to −60 ms (mean: 19.1 ms, 95% CI = [12.9, 25.4], t(19) = 6.4, P = 4.0 × 10−6, paired t-test). The significance level overcame the multiple comparisons by Bonferroni correction by 4-fold (number of time windows). d Reaction times for Go success in spStim and no-spStim trials in each time window (n = 20 subjects). Error bars indicate SEM. Gray lines indicate data from each subject. Note that reaction time for Go success was prolonged in the time window of −90 to −60 ms (mean difference: 12.6 ms, 95% CI = [6.0, 19.2], t(19) = 4.1, P = 6.4 × 10−4, paired t-test). ΔSSRT analyses with reduced time windows of 15 ms for spTMS to the aIFC (e) and to the vpIFC (f). Error bars indicate SEM. Circles indicate data from each subject. *P < 0.05, paired t-test, two-sided. Significant ΔSSRT was were observed in the −90 to −75 ms and −75 to −60 ms time windows for the aIFC (mean: 20.8 ms, 95% CI = [13.8, 27.9], t(11) = 6.5, P = 4.4 × 10−5, paired t-test; mean: 16.6 ms, 95% CI = [2.6, 30.6], t(7) = 2.8, P = 0.03, paired t-test) and the vpIFC (mean: 18.5 ms, 95% CI = [9.2, 27.9], t(8) = 4.6, P = 1.8 × 10−3, paired t-test; mean: 22.2 ms, 95% CI = [7.7, 36.6], t(10) = 3.4, P = 6.6 × 10−3, paired t-test). Source data are provided as a Source Data file. Elements in (b) are adapted from refs. ,.
Fig. 6
Fig. 6. Combined single-pulse and TUS for the hierarchical structure of daINS–vpIFC and daINS–aIFC.
a The hierarchical positioning of the daINS relative to the vpIFC and aIFC during response inhibition was investigated. Specifically, the causal influence of the daINS to the vpIFC and aIFC was examined. b Experimental design. Transcranial ultrasound stimulation (TUS) was applied to the daINS, and changes in the transient disruption effects in the vpIFC or aIFC were examined by comparing the effects before and after TUS (pre- and post-TUS, respectively). spTMS, single-pulse transcranial magnetic stimulation. c The stop-signal reaction time (SSRT) in spStim and no-spStim trials when spTMS was applied to the vpIFC or aIFC in pre- or post-TUS (n = 20 subjects). Error bars indicate SEM. Gray lines indicate data from each subject. ***P < 0.001, paired t-test, two-sided. In pre-TUS, SSRT was prolonged significantly for spTMS to the vpIFC (mean: 22.8 ms, 95% CI = [14.1, 31.6], t(19) = 5.5, P = 2.9 × 10−5, paired t-test) and to the aIFC (mean: 23.3 ms, 95% CI = [13.1, 33.4], t(19) = 4.8, P = 1.3 × 10−4, paired t-test). However, in post-TUS, a significant difference in SSRT was not observed (for the vpIFC, mean: −0.3 ms, 95% CI = [−8.6, 7.9], t(19) = −0.1, P = 0.93, paired t-test; for the aIFC, mean: 1.8 ms, 95% CI = [−8.0, 11.6], t(19) = 0.4, P = 0.70, paired t-test). d Differences in the SSRT between spStim and no-spStim trials (ΔSSRT) in pre- and post-TUS (n = 20 subjects). Error bars indicate SEM. †††P < 0.001, paired t-test for ΔSSRT (pre- vs. post-TUS), two-sided. Significant differences were observed both in the vpIFC and aIFC (for the vpIFC, mean difference: −23.2 ms, 95% CI = [−33.7, −12.7], t(19) = −4.6, P = 1.8 × 10−4, paired t-test; for the aIFC, mean difference: −21.5 ms, 95% CI = [−36.0, −6.9], t(19) = −3.1, P = 6.0 × 10−3, paired t-test). Source data are provided as a Source Data file. Elements in (b) are adapted from refs. ,.
Fig. 7
Fig. 7. Combined single-pulse and TUS for the relationship between the vpIFC and aIFC.
a The relationship between the vpIFC and aIFC, downstream areas of the daINS, was investigated. b Experimental design. Transcranial ultrasound stimulation (TUS) was applied to either the aIFC or vpIFC, and changes in the transient disruption effects in the vpIFC or aIFC, respectively, were investigated by comparing the effects in pre- and post-TUS. spTMS, single-pulse transcranial magnetic stimulation. c The stop-signal reaction time (SSRT) in spStim and no-spStim trials when spTMS was applied to the vpIFC or aIFC in pre- or post-TUS (n = 20 subjects). Error bars indicate SEM. Gray lines indicate data from each subject. ***P < 0.001, paired t-test, two-sided. In pre-TUS, a significant increase in SSRT was observed for spTMS to the vpIFC (mean: 18.0 ms, 95% CI = [10.5, 25.5], t(19) = 5.0, P = 7.8 × 10−5, paired t-test) and to the aIFC (mean: 19.7 ms, t(19) = 4.7, 95% CI = [11.0, 28.3], P = 1.4 × 10−4, paired t-test). After TUS to the aIFC, the SSRT was still prolonged by spTMS to the vpIFC (mean: 18.8 ms, 95% CI = [6.4, 31.3], t(19) = 3.2, P = 5.1 × 10−3, paired t-test). In contrast, after TUS to the vpIFC, the SSRT was not prolonged by spTMS to the aIFC (mean: −2.7 ms, 95% CI = [−11.6, 6.1], t(19) = −0.6, P = 0.53, paired t-test). d Differences in the SSRT between spStim and no-spStim trials (ΔSSRT) in pre- and post-TUS (n = 20 subjects). Error bars indicate SEM. †††P < 0.001, paired t-test for ΔSSRT (pre- vs. post-TUS), two-sided; §P < 0.05, an interaction effect in a two-way ANOVA. A significant interaction effect was observed between the area (spTMS to vpIFC/aIFC) and the pre/post-TUS condition in a two-way ANOVA(F(1,19) = 10.0, P = 0.01). spTMS to the aIFC resulted in a significant decrease in ΔSSRT (mean difference: −22.2 ms, 95% CI = [−32.3, −12.2], t(19) = −4.6, P = 1.8 × 10−4, paired t-test), while spTMS to the vpIFC did not (mean difference: 0.8 ms, 95% CI = [−12.5, 14.1], t(19) = 0.1, P = 0.90, paired t-test). e Information processing during response inhibition. Perceptual information undergoes initial processing in the V1 before being subsequently relayed to the daINS. From the daINS, information is directed to either the vpIFC or aIFC and subsequently to the basal ganglia/M1. There exists a unidirectional dependence of the aIFC on the vpIFC. Source data are provided as a Source Data file. Elements in (b) are adapted from refs. ,.

References

    1. Verbruggen, F. & Logan, G. D. Response inhibition in the stop-signal paradigm. Trends Cogn. Sci.12, 418–424 (2008). - PMC - PubMed
    1. Bari, A. & Robbins, T. W. Inhibition and impulsivity: behavioral and neural basis of response control. Prog. Neurobiol.108, 44–79 (2013). - PubMed
    1. Hannah, R. & Aron, A. R. Towards real-world generalizability of a circuit for action-stopping. Nat. Rev. Neurosci.22, 538–552 (2021). - PMC - PubMed
    1. Ikarashi, K. et al. Response inhibitory control varies with different sensory modalities. Cereb. Cortex32, 275–285 (2022). - PubMed
    1. Friehs, M. A. et al. A touching advantage: cross-modal stop-signals improve reactive response inhibition. Exp. Brain Res.242, 599–618 (2024). - PMC - PubMed

Publication types