. 2024 Dec 3;15(1):10378.
doi: 10.1038/s41467-024-54246-6.

Loss of NUMB drives aggressive bladder cancer via a RHOA/ROCK/YAP signaling axis

Affiliations

Loss of NUMB drives aggressive bladder cancer via a RHOA/ROCK/YAP signaling axis

F A Tucci et al. Nat Commun. .

Abstract

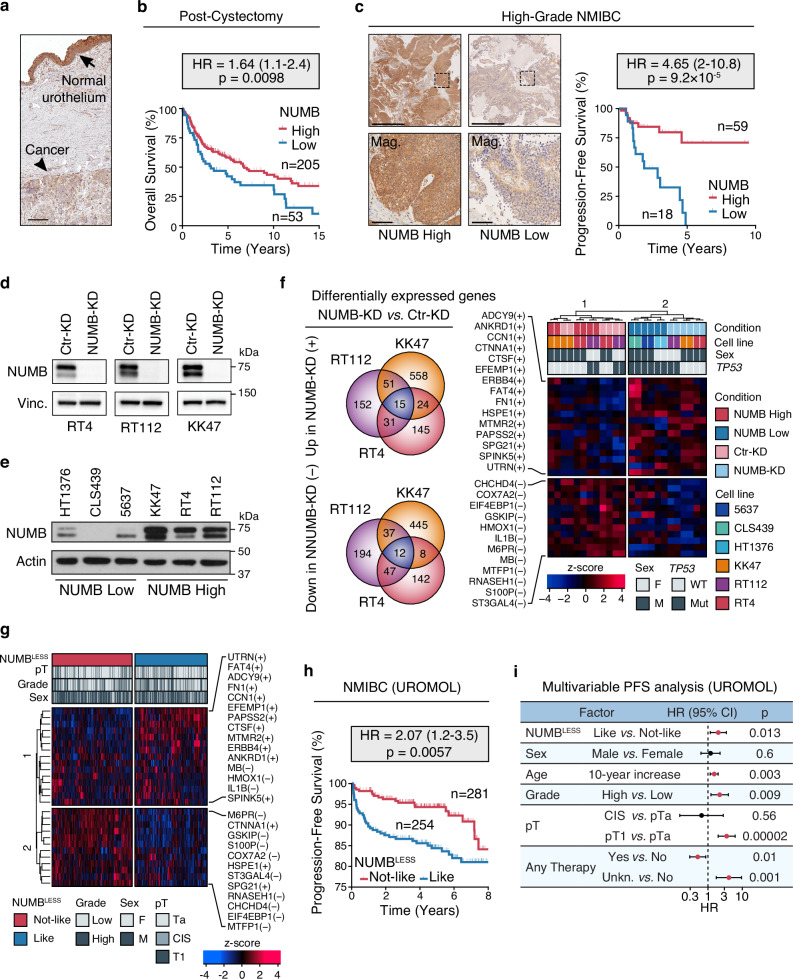
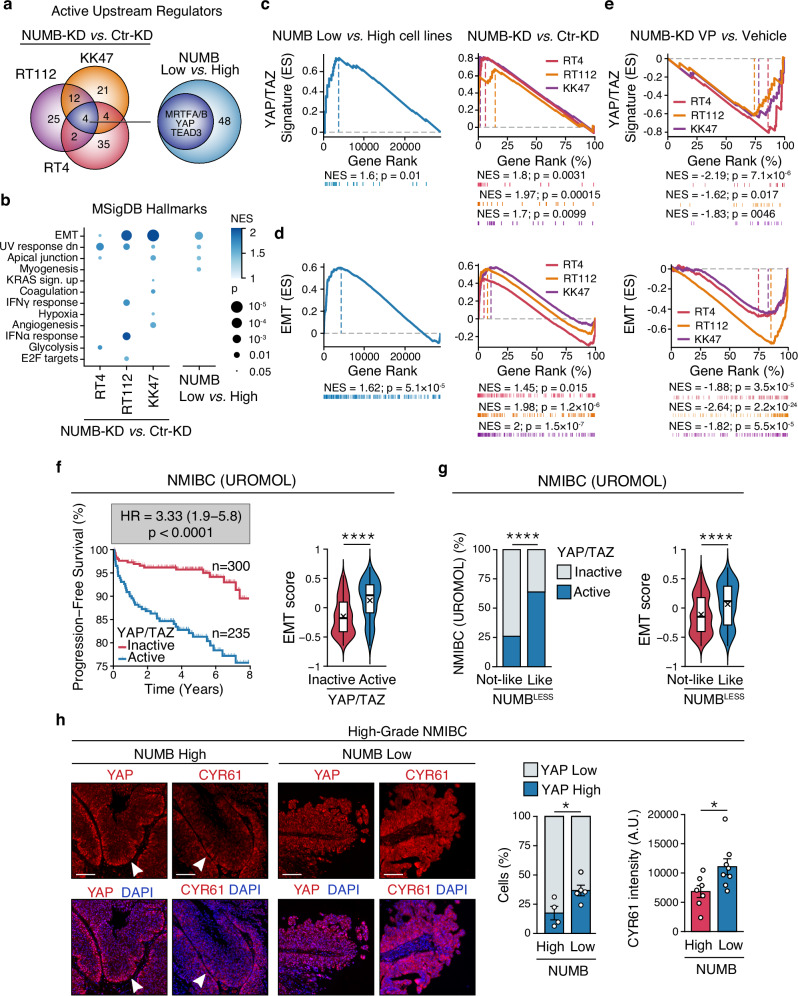
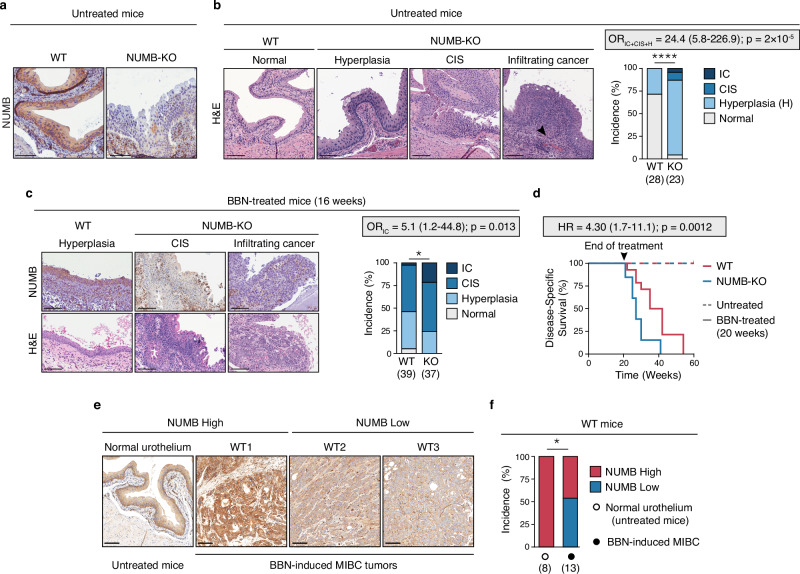
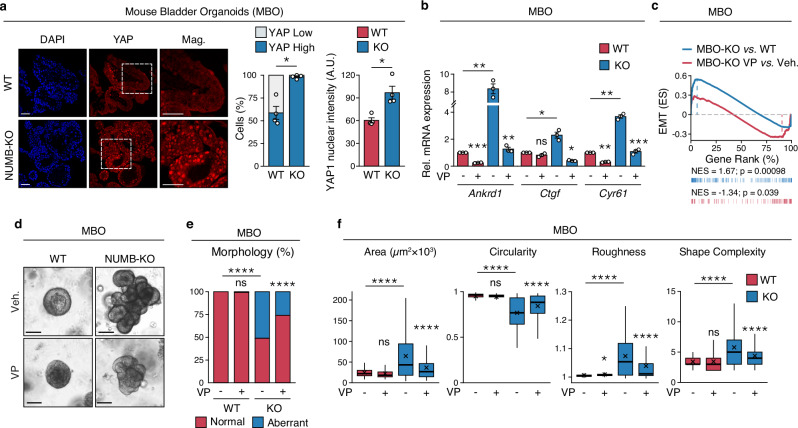
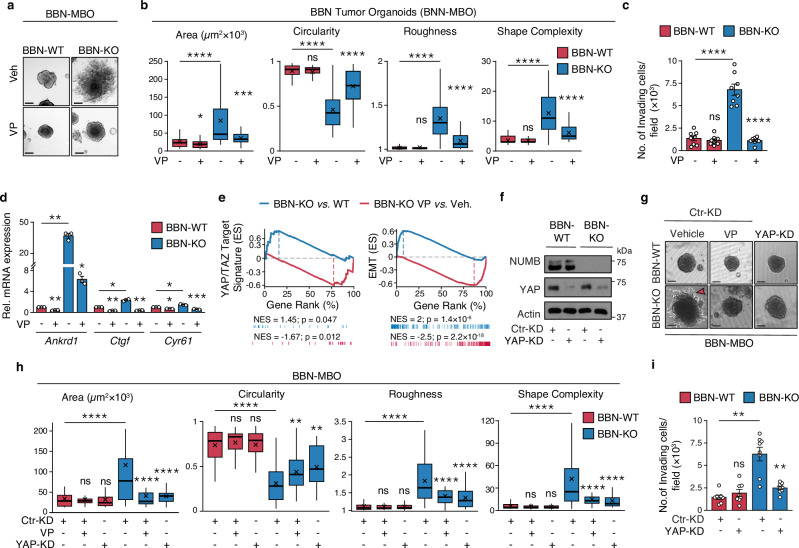
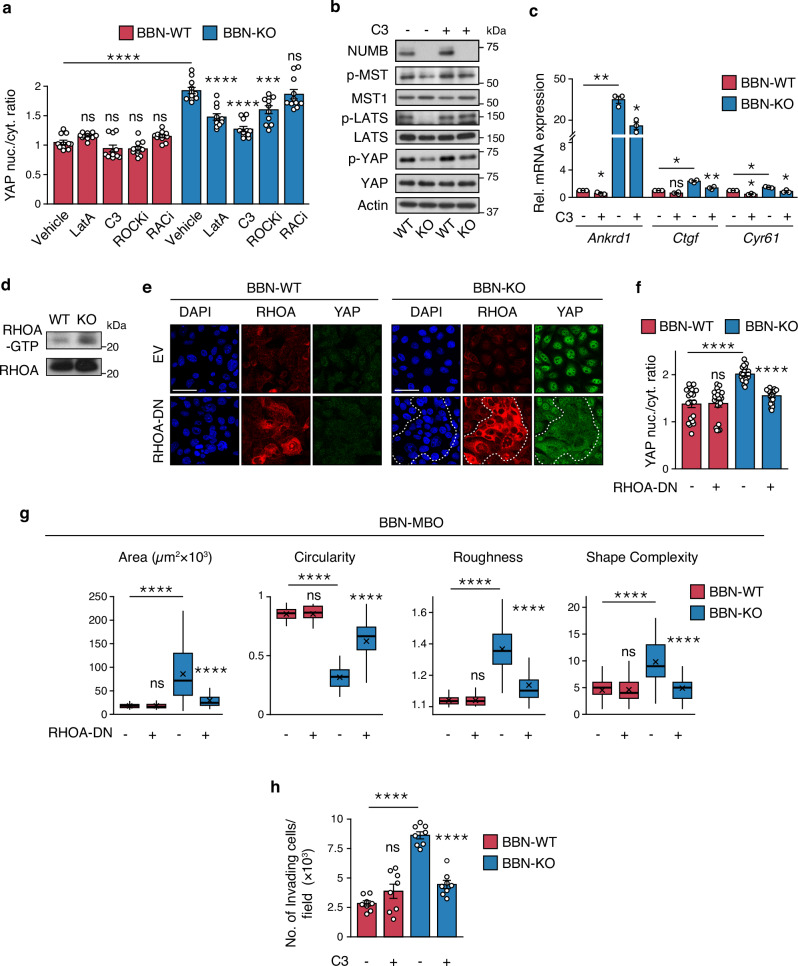
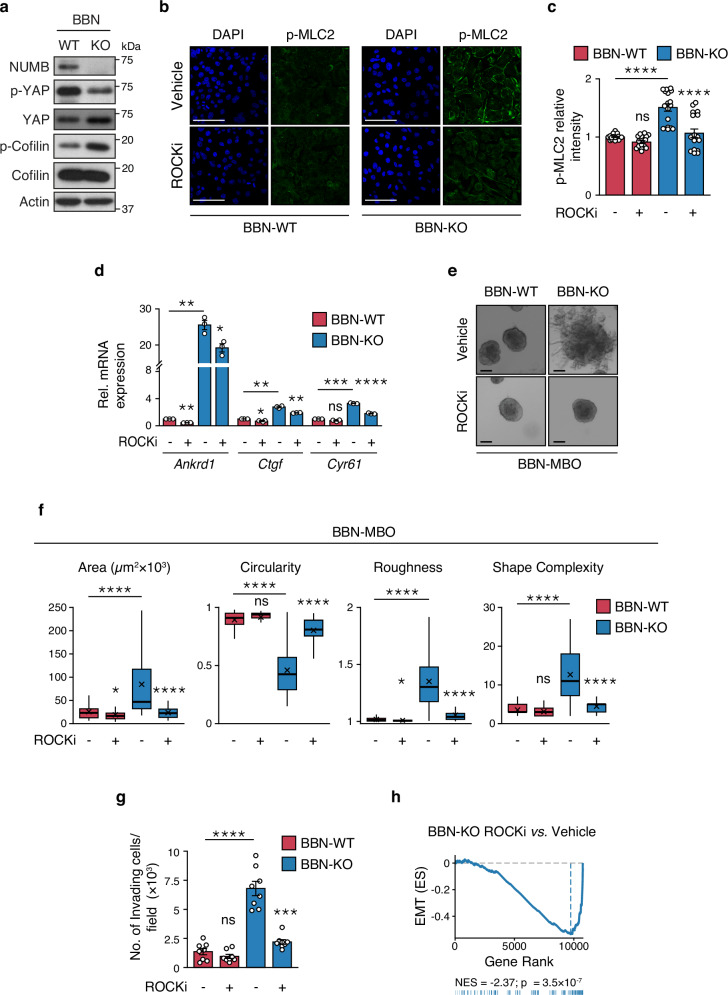
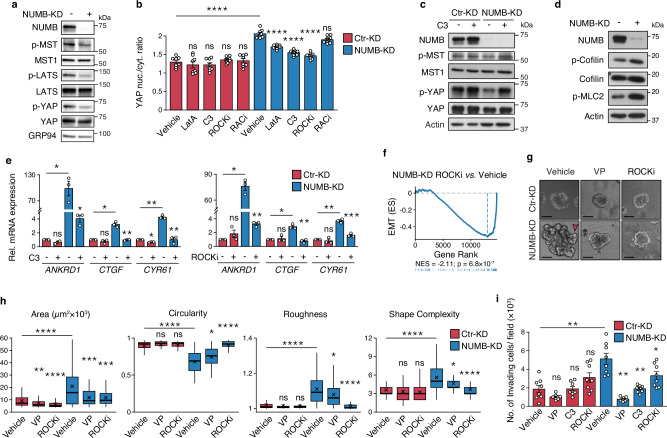
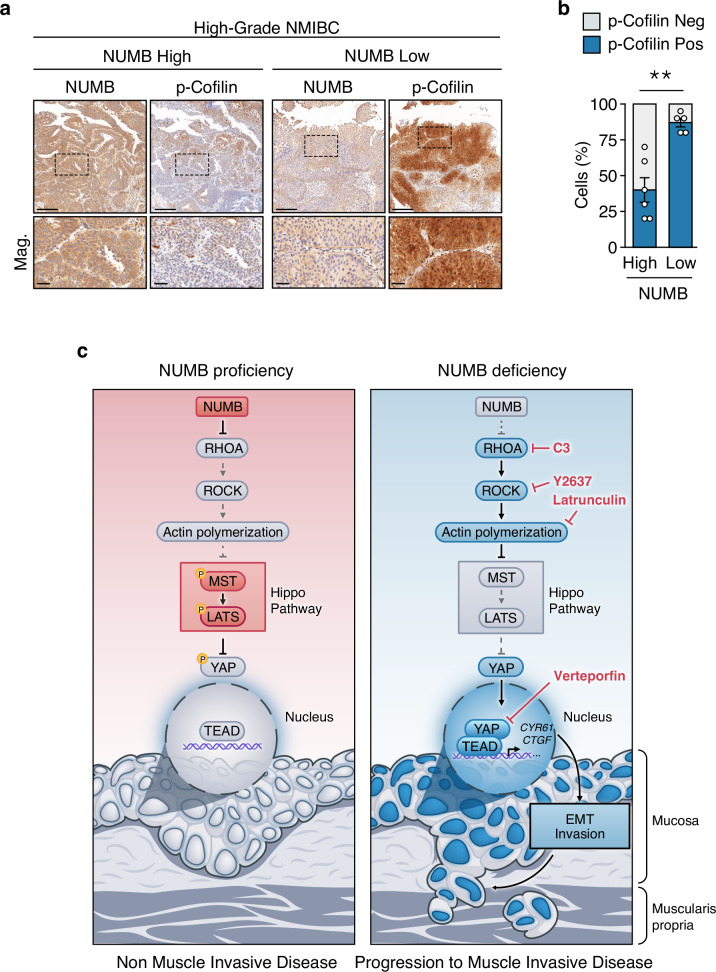
Advances in bladder cancer (BCa) treatment have been hampered by the lack of predictive biomarkers and targeted therapies. Here, we demonstrate that loss of the tumor suppressor NUMB promotes aggressive bladder tumorigenesis and worsens disease outcomes. Retrospective cohort studies show that NUMB-loss correlates with poor prognosis in post-cystectomy muscle-invasive BCa patients and increased risk of muscle invasion progression in non-muscle invasive BCa patients. In mouse models, targeted Numb ablation induces spontaneous tumorigenesis and sensitizes the urothelium to carcinogenic insults, accelerating tumor onset and progression. Integrative transcriptomic and functional analyses in mouse and human BCa models reveal that upregulation of YAP transcriptional activity via a RHOA/ROCK-dependent pathway is a hallmark of NUMB-deficient BCa. Pharmacological or genetic inhibition of this molecular pathway selectively inhibits proliferation and invasion of NUMB-deficient BCa cells in 3D-Matrigel organoids. Thus, NUMB-loss could serve as a biomarker for identifying high-risk patients who may benefit from targeted anti-RHOA/ROCK/YAP therapies.


Conflict of interest statement

Competing interests: G. Renne, G. Vago, D. Tosoni and S. Pece are co-inventors of a patent (EP24191940.6) related to this work, pending to the European Institute of Oncology and University of Milan. All the other authors declare no competing interests.

Figures

Fig. 1
Fig. 1. NUMB loss is prognostic in human BCa and correlates with NMIBC progression.
a Representative IHC image of a NUMB-deficient MIBC (arrowhead) bordering the normal urothelium expressing NUMB (arrow). Bar, 400 μm. b Overall survival of post-cystectomy patients stratified by NUMB expression (NUMBHigh vs. NUMBLow) determined by IHC. HR, hazard ratio (95% confidence interval); p, two-sided log-rank test p-value; n, patient number; in this and all other relevant panels. c Left, Representative IHC images of NUMB expression in high-grade NUMBHigh and NUMBLow NMIBC. Boxed areas are magnified (Mag.) below. Bars, 1 mm; Mag. 100 µm. Right, progression-free survival of NMIBC patients stratified by NUMB expression. p, two-sided log-rank test p-value. d NUMB expression in RT4, RT112 and KK47 NIMBC cells knocked down for NUMB by siRNA (NUMB-KD) or mock siRNA in controls (Ctr-KD). Vinculin (Vinc.), loading control. Results are representative of two independent experiments. e NUMB expression in MIBC NUMBLow cell lines (HT1376, CLS439, 5637) and NMIBC NUMBHigh cell lines (KK47, RT4, RT112). Actin, loading control. Results are representative of two independent experiments. f Definition of the NUMBLESS signature. The Venn diagrams on the left show the intersection of genes up and down-regulated in the independent comparison of the NUMBHigh RT4, RT112 and KK47 NIMBC cells, NUMB-KD vs. Ctr-KD. Right, unsupervised hierarchical clustering of NUMBHigh and NUMBLow, and NUMB-KD and Ctr-KD BCa cell lines, based on the expression levels of the 15 genes consistently upregulated (+) and 12 genes consistently downregulated (-) (NUMBLESS signature). The color code scale indicates the z-score of log-normalized transcript abundance, in this and other relevant panels in the figure. g Unsupervised clustering of the 535 NMIBC patients from the UROMOL cohort, stratified by the NUMBLESS signature (NUMBLESS-Like vs. -Not-Like, corresponding to a NUMB-deficient or NUMB-proficient status, respectively). h Progression-free survival of NMIBC patients of the UROMOL cohort categorized as NUMBLESS-Like and NUMBLESS-Not-Like. p, two-sided log-rank test p-value. i. Multivariable progression-free survival (PFS) analysis of the association between the indicated factors and good (HR < 1) or poor (HR > 1) prognosis in the UROMOL cohort (n = 535). Significant associations are marked in red. HR, multivariable hazard ratios with error bars representing 95% confidence intervals (CI) by Cox proportional hazards model; p, two-sided Wald-test p-value. Source data are provided as Source Data file.
Fig. 2
Fig. 2. NUMB loss is associated with YAP activation and EMT.
a Venn diagrams show the activated transcriptional regulators identified in NUMB-KD vs. Ctr-KD RT4, RT112 and KK47 NIMBC cells (left) and in NUMBLow vs. NUMBHigh cell lines (right). The blue circle indicates the 4 common YAP/TAZ transcriptional regulators in the two paired comparisons. b Hallmark gene sets from MSigDB positively enriched by GSEA in NUMBLow vs. NUMBHigh cell lines and NUMB-KD vs. Ctr-KD RT4, RT112 and KK47 NIMBC cells. NES, Normalized Enriched Score; p, FDR adjusted two-sided permutation test p-value; n = 2. c, d Active YAP/TAZ (c) and EMT (d) gene signature by GSEA of the 3 NUMBLow vs. 3 NUMBHigh cell lines (left panels), and NUMB-KD vs. Ctr-KD RT4, RT112 and KK47 cells (right panels). ES, Enrichment Score; NES, Normalized Enrichment Score; p, two-sided permutation test p-value; n  =  2. e GSEA showing downregulation of an active YAP/TAZ (top) and EMT (bottom) gene signature in the indicated NUMBHigh NUMB-KD cell lines treated with 500 nM verteporfin (VP) vs. vehicle for 24 h. ES, Enrichment Score; NES, Normalized Enrichment Score; p, two-sided permutation test p-value; n = 1. f Left, progression-free survival of the UROMOL patient cohort categorized as YAP/TAZ active or inactive by the 22-gene YAP/TAZ signature. HR, hazard ratio (95% confidence interval); p, two-sided log-rank test p-value; n, patient number. Right, box-violin plot showing the EMT score in the YAP/TAZ active and inactive groups. Boxplots are delimited by 25th and 75th percentiles and show the median (horizontal line) and the mean (X). The whiskers span from the smallest and largest data values within a 1.5 interquartile range. ****, p < 0.0001 by two-sided Welch’s t-test. g Left, association between the NUMBLESS and the 22-gene YAP/TAZ signatures in the UROMOL cohort (n = 535). ****, p < 0.0001, by two-sided Fisher’s exact test. Right, box-violin plot (see legend to Fig. 2f) showing the EMT score in the NUMBLESS-Like or NUMBLESS-Not-Like groups. ****, p < 0.0001 by two-sided Welch’s t-test. h Left, Immunofluorescence of YAP and CYR61 expression (red) and DAPI nuclear stain (blue) in high-grade NUMBHigh vs. NUMBLow NMIBC tumors. Bars, 100 μm. Right, quantification of the % of YAP-high vs. -low expressing cells in 4 NUMBHigh and 5 NUMBLow NIMBC, and CYR61 mean cytoplasmic intensity (arbitrary units, A.U.) of 7 NUMBHigh and 8 NUMBLow NIMBC. Values are expressed as mean ± SEM. *, p = 0.038 for YAP, p = 0.035 for CYR61, by two-sided Welch’s t-test for YAP and two-sided two-sample t-test for CYR61. Source data are provided as Source Data file.
Fig. 3
Fig. 3. NUMB loss drives spontaneous malignant transformation of the normal urothelium and accelerates carcinogen-induced bladder tumorigenesis.
a NUMB expression in the urothelium of untreated adult WT (WT) and NUMB-KO (KO) mice. Bars, 100 μm. Images are representative of the bladders of 28 WT and 23 NUMB-KO mice examined. b Left, Representative H&E images of the normal WT urothelium, and preneoplastic (Hyperplasia) and neoplastic (carcinoma in situ, CIS; invasive cancer, IC) urothelial lesions from NUMB-KO mice. The black arrowhead indicates IC. Bars, 100 μm. Right, Incidence (%) of histological phenotypes in the urothelium of untreated, aged-matched 4- to 12-month old WT (n = 28) and NUMB-KO (n = 23) mice. ****, p = 0.00002 by two-sided Pearson’s Chi-squared test. Odds ratio (OR) with 95% CI and associated two-sided p-value by Fisher’s exact test is shown. c Aged-matched 8- to 16-week-old WT (n = 39) and NUMB-KO (n = 37) mice were exposed to 0.05% BBN in the drinking water for 16 weeks followed by a 2-week washout period. Bladder tissues were harvested and examined for histological changes (H&E) and NUMB expression (IHC). Left, Representative images of a preneoplastic (Hyperplasia) lesion from BBN-WT mice and neoplastic (CIS and IC) lesions from BBN-NUMB-KO mice. Right, Incidence (%) of histological phenotypes in WT vs. KO mice at the end of treatment. Bars, 100 μm. *, p = 0.025 by two-sided Pearson’s Chi-squared test; OR (95% CI) with associated two-sided p-value by Fisher’s exact test is shown. d Kaplan–Meier plot showing the disease-specific survival (%) of aged-matched 8- to 16-week-old WT (n = 14) and NUMB-KO (n = 13) mice treated for 20 weeks with BBN before switching to regular drinking water. Mice were sacrificed according to endpoints. Dashed-line, WT (n = 10) and NUMB-KO (n = 10) untreated mice. HR, (95% CI) with two-sided p-value by Log Rank test are shown. e MIBC lesions excised from BBN-WT mice (n = 13) were compared to the normal urothelium of untreated WT mice (n = 8) for NUMB expression by IHC. Shown are three MIBC lesions, one NUMBHigh (WT1) and two NUMBLow (WT2, WT3), and the normal NUMBHigh urothelium of untreated mice. Bars, 100 μm. f Quantification of the experiment in ‘e’ showing the incidence (%) of NUMBLow vs. NUMBHigh MIBC tumors induced by BBN treatment in WT mice. *, p = 0.018 by two-sided Fisher’s exact test. Source data are provided as Source Data file.
Fig. 4
Fig. 4. NUMB loss induces invasive phenotypes and YAP signaling activation in normal urothelial cells.
a Left, Representative confocal IF images of endogenous YAP expression in FFPE sections of WT and NUMB-KO mouse bladder organoids (MBOs) grown in 3D-Matrigel. Nuclei are stained with DAPI. Bars, 100 μm; Mag., 50 μm. The % of YAP-positive cells (middle) and the mean nuclear YAP intensity (arbitrary units, A.U.) (right) are expressed as mean ± SEM, n = 4 fields/condition from one experiment, representative of two independent experiments. *, p = 0.011 (left), 0.017 (right) by two-sided Welch’s t-test. b RT-qPCR for the indicated YAP transcriptional targets in WT- and NUMB-KO MBO grown in 3D-Matrigel in the presence of vehicle (Veh) or 200 nM verteporfin (VP) for 48 hr. Graphs show the relative mean fold expression ± SEM from three independent experiments. p-values by FDR-adjusted two-sided one-sample t-test (vs. vehicle-treated MBO-WT): Ankrd1, MBO-WT VP, p = 0.00086 (***); MBO-KO Veh, p = 0.0083 (**); Ctgf, MBO-WT VP, p = 0.13 (ns, not significant); MBO-KO Veh, p = 0.041 (*); Cyr61, MBO-WT VP, p = 0.0017 (**); MBO-KO Veh, p = 0.0032 (**). p-values by two-sided Welch’s t-test (VP- vs. vehicle-treated MBO-KO samples): Ankrd1, p = 0.004 (**); Ctgf, p = 0.013 (*); Cyr61, p = 0.00011 (***). c GSEA enrichment plot of the EMT gene signature in RNA-seq data from WT- vs. NUMB-KO MBO cells (n = 6 for each condition) and NUMB-KO MBO treated with 200 nM VP vs. vehicle for 48 hr. (n = 1 for each condition). ES, Enrichment Score; NES, Normalized Enrichment Score; p, two-sided permutation test p-value. d Representative images of 3D-Matrigel WT- and NUMB-KO MBO grown in the presence of vehicle (Veh) or 25 nM verteporfin (VP) for 10 days. Bar, 100 μm. e Frequency of occurrence of normal and aberrant multiacinar morphology in MBO in ‘c’. MBO-WT+Veh, n = 219; MBO-WT + VP, n = 119; MBO-KO+Veh, n = 174; MBO-KO + VP, n = 189, obtained from three independent experiments. ****, p < 0.0001; ns, not significant (p = 0.35), relative to matching condition by FDR-adjusted pairwise two-sided Fisher’s t-test. f Analysis of morphometric parameters (Area, Circularity, Roughness, and Shape Complexity) of WT vs. NUMB-KO MBO treated as in ‘d’. Values are reported, in this and other relevant panels in the figure, as boxplots delimited by 25th and 75th percentiles and showing the median (horizontal line) and the mean (X). The whiskers span from the smallest and largest data values within a 1.5 interquartile range. MBO-WT+Veh, n = 219; MBO-WT + VP, n = 119; MBO-KO+Veh, n = 174; MBO-KO + VP, n = 189, obtained from three independent experiments. ****, p < 0.0001; *, p = 0.027; ns, not significant (p = 0.058 for Area, 0.15 for Circularity and 0.9 for Shape Complexity), relative to matching condition, by FDR-adjusted pairwise two-sided Welch’s t-test. Source data are provided as Source Data file.
Fig. 5
Fig. 5. NUMB loss induces invasive phenotypes and YAP signaling activation in tumor urothelial cells.
a, b Morphology of 3D-Matrigel BBN-WT and BBN-KO tumor MBO exposed to 25 nM VP or vehicle for 7 days. Bar, 100 μm. Graphs in ‘b’ show the quantitation of the indicated morphometric parameters (see legend to Fig. 4f). BBN-WT+Veh, n = 47; BBN-WT + VP, n = 57; BBN-KO+Veh, n = 46; BBN-KO + VP, n = 45, obtained from three independent replicates. ****, p < 0.0001; ***, p = 0.0002; *, p = 0.023; ns, not significant (p = 0.42 for Circularity, 0.52 for Roughness and 0.87 for Shape Complexity), relative to matching condition by FDR-adjusted pairwise two-sided Welch’s t-test. c Transwell Matrigel invasion assay of BBN-WT and BBN-KO cells treated with VP (100 nM, 18 h) or vehicle. Number of invading cells/field expressed as the mean ± SEM of 8 microscope fields covering the entire migratory area, from two independent experiments. ****, p < 0.0001; not significant (ns), p = 0.54 by FDR-adjusted pairwise two-sided Welch’s t-test. d RT-qPCR for the indicated YAP transcriptional targets in BBN-WT vs. BBN-KO cells treated with VP (100 nM, 12 h) or vehicle. Graphs show the relative mean fold expression ± SEM from three independent experiments. p-values by FDR-adjusted two-sided one-sample t-test (vs. vehicle-treated BBN-WT): Ankrd1, BBN-WT VP, p = 0.0098 (**); BBN-KO vehicle, p = 0.0098 (**); Ctgf, BBN-WT VP, p = 0.0062 (**); BBN-KO vehicle, p = 0.011 (*); Cyr61, BBN-WT VP, p = 0.017 (*); BBN-KO vehicle, p = 0.017 (*). p-values by FDR-adjusted two-sided Welch’s t-test (VP- vs. vehicle-treated BBN-KO samples): Ankrd1, p = 0.01 (*); Ctgf, p = 0.005 (**); Cyr61, p = 0.00093 (***). e GSEA enrichment plot of the YAP (left) and EMT (right) gene signatures in RNA-seq data from BBN-KO vs. BBN-WT cells (n = 3) and BBN-KO cells treated with VP vs. vehicle (n = 1). ES, Enrichment Score; NES, Normalized Enrichment Score; p, two-sided permutation test p-value. f Efficiency of YAP silencing in BBN-WT and BBN-KO lentivirally silenced for YAP (YAP-KD) or control-silenced (Ctr-KD). Actin, loading control. Results are representative of two independent experiments. g Morphology of 3D-Matrigel BBN-MBO from cells in ‘f’. Ctr-KD BBN-WT and BBN-KO MBO were also treated with vehicle or 25 nM verteporfin (VP). Bar, 100 μm. The red arrowhead indicates invading protrusions. h Quantification of morphometric parameters of BBN-MBO in ‘g’ (see legend to Fig. 4f). BBN-WT Ctr-KD+Veh, n = 48; BBN-WT Ctr-KD + VP, n = 40; BBN-WT YAP-KD+Veh, n = 42; BBN-KO Ctr-KD+Veh, n = 59; BBN-KO Ctr-KD + VP, n = 35; BBN-KO YAP-KD+Veh, n = 33, obtained from two independent experiments. ****, p < 0.0001; **, p = 0.008 for BBN-KO Ctr-KD + VP, p = 0.001 for BBN-KO YAP-KD+Veh; not significant (ns) p-values are: for BBN-WT Ctr-KD + VP, p = 0.83 (Area), 0.47 (Circularity), 0.77 (Roughness) and 0.59 (Shape Complexity); for BBN-WT YAP-KD+Veh, p = 0.83 (Area), 0.89 (Circularity), 0.67 (Roughness) and 0.16 (Shape Complexity), vs. matching condition, by FDR-adjusted pairwise two-sided Welch’s t-test. i Transwell Matrigel invasion assay of BBN-WT and BBN-KO cells in ’f’. Number of invading cells/field 24 h after seeding, expressed as the mean ± SEM of 8 fields from two independent experiments. **, p = 0.001 for BBN-KO Ctr-KD cells, p = 0.003 for BBN-KO YAP-KD cells; ns, not significant (p = 0.31), vs. matching controls by FDR-adjusted pairwise two-sided Welch’s t-test.
Fig. 6
Fig. 6. RHOA/ROCK-dependent actin remodeling is involved in YAP hyperactivation downstream of NUMB loss.
a Quantification of YAP nuclear/cytoplasmic ratio in BBN-WT and BBN-KO tumor cells treated with LatA (500 nM, 6 h), C3 transferase (3 µg/ml, 6 h), Y-27632 (ROCKi, 10 µM, 12 h), NSC-23766 (RACi, 10 µM, 12 h) or vehicle and co-stained for YAP, NUMB and DAPI. Graphs show the mean/field ± SEM, n = 11 fields/condition, from two independent experiments. ****, p < 0.0001; ***, p = 0.00064; not significant (ns) p-values are: p = 0.89, 0.91, 0.88 and 0.92, for BBN-WT cells treated with LatA, C3, ROCKi and RACi, respectively; p = 1 for BBN-KO cells treated with ROCKi, relative to matching controls by two-sided Tukey’s HSD test. Representative confocal images are shown in Supplementary Fig. 8. b Expression and phosphorylation status of the indicated Hippo pathway components in BBN-WT vs. BBN-KO cells, treated with C3 transferase (3 µg/ml, 6 h) or vehicle. Actin, loading control. Blots shown are representative of two independent experiments. c RT-qPCR for the indicated YAP transcriptional targets in BBN-WT vs. BBN-KO cells treated as in ‘b’. Graphs show the relative mean fold expression ± SEM from three independent experiments. p-values by FDR-adjusted two-sided one-sample t-test (vs. vehicle-treated BBN-WT): Ankrd1, BBN-WT C3, p = 0.043 (*); BBN-KO Veh, p = 0.0098 (**); Ctgf, BBN-WT C3, p = 0.068 (ns, not significant); BBN-KO Veh, p = 0.012 (*); Cyr61, BBN-WT C3; p = 0.017 (*); BBN-KO Veh, p = 0.017 (*). p-values by FDR-adjusted two-sided Welch’s t-test (C3- vs. vehicle-treated BBN-KO samples): Ankrd1, p = 0.01 (*); Ctgf, p = 0.006 (**); Cyr61, p = 0.027 (*). d Pull-down assay of activated RHOA in BBN-WT vs. BBN-KO cells. Blots are representative of two independent experiments. e Representative confocal fluorescence images of BBN-WT and BBN-KO tumor cells lentivirally transduced with RHOA-DN or empty vector (EV) and co-stained for RHOA, YAP and DAPI. Bars, 50 µm. Dashed line delineates a cluster of RHOA-DN overexpressing cells in BBN-KO cells. f Quantification of YAP nuclear/cytoplasmic ratio in BBN-WT- and BBN-KO cells treated as in ‘e’. Graphs show the mean/field ± SEM, n = 20 fields/condition, from two independent experiments. ****, p < 0.0001; ns, not significant (p = 1), relative to matching controls by two-sided Tukey’s HSD test. g Morphometric analysis of tumor BBN-MBO generated from cells described in ‘e’ (see legend to Fig. 4f). BBN-WT EV, n = 48; BBN-WT RHOA-DN, n = 48; BBN-KO EV, n = 37; BBN-KO RHOA-DN, n = 45, obtained from three independent experiments. ****, p < 0.0001; not significant (ns) p-values are: p = 1, 0.97, 0.91 and 0.82 for Area, Circularity, Roughness and Shape Complexity, respectively, relative to matching condition by FDR-adjusted pairwise two-sided Welch’s t-test. h Transwell Matrigel invasion assay of BBN-WT and BBN-KO cells treated with C3 transferase (3 µg/mL, 18 h) or vehicle. Number of invading cells/field expressed as the mean ± SEM of 8 microscope fields covering the migration area, from two independent experiments. ****, p < 0.0001; ns, not significant (p = 0.17), relative to matching controls by FDR-adjusted pairwise two-sided Welch’s t-test. Source data are provided as Source Data file.
Fig. 7
Fig. 7. ROCK inhibition prevents YAP hyperactivation induced by loss of NUMB.
a Immunoblot of total and phosphorylated cofilin and YAP in BBN-WT vs. BBN-KO cells. Actin, loading control. Data are representative of two independent experiments. b Representative confocal images of BBN-WT and BBN-KO cells treated with vehicle or ROCKi, Y-27632 (10 µM, 12 h) and co-stained for phosphorylated MLC2 (p-MLC2) and DAPI. Bar, 50 µm. c Quantification of the experiment in ‘b’. Graphs show the relative intensity of p-MLC2 in BBN-KO vs. BBN-WT cells expressed as the mean/field ± SEM, n = 18 random fields/condition from two independent experiments. ****, p < 0.0001; not significant (ns), p = 0.59, relative to matching controls by two-sided Tukey’s HSD test. d RT-qPCR of the indicated YAP transcriptional targets in BBN-KO vs. BBN-WT cells treated with ROCKi Y-27632 (10 µM, 8 h) or vehicle. Graphs show the relative mean fold expression ± SEM from three independent experiments. p-values by FDR-adjusted two-sided one-sample t-test (vs. vehicle-treated BBN-WT): Ankrd1, BBN-WT ROCKi, p = 0.0013 (**); BBN-KO Veh, p = 0.0038 (**); Ctgf, BBN-WT ROCKi, p = 0.041 (*); BBN-KO Veh, p = 0.0047 (**); Cyr61, BBN-WT ROCKi, ns, not significant (p = 0.081); BBN-KO Veh, p = 0.00079 (***). In ROCKi- vs. vehicle-treated BBN-KO samples, p-values by FDR-adjusted two-sided Welch’s t-test are: Ankrd1, p = 0.022 (*); Ctgf, p = 0.0089 (**); Cyr61, p = 0.000026 (****). e Representative images of tumor BBN-MBOs generated from BBN-WT and BBN-KO cells treated with ROCKi (Y-27632, 10 µM). Bars, 100 µm. f Morphometric analysis of the indicated parameters in BBN-MBO cell treated as in ‘f’ (see legend to Fig. 4f); BBN-WT+Vehicle, n = 47; BBN-WT+ROCKi, n = 65; BBN-KO+Vehicle, n = 46; BBN-KO+ROCKi, n = 58, obtained from three independent experiments. ****, p < 0.0001; *, p = 0.023, 0.024 for Area and Roughness measures, respectively; not significant (ns), p = 0.07, 0.074 for Circularity and Shape Complexity measures, respectively, relative to matching condition by FDR-adjusted pairwise two-sided Welch’s t-test. g Transwell Matrigel invasion assay of BBN-WT and BBN-KO cells treated with ROCKi Y-27632 (10 µM, 18 h) or vehicle. Number of invading cells/field expressed as the mean ± SEM of 8 random microscope fields covering the entire migration area, from two independent experiments. ****, p < 0.0001; ***, p = 0.00023; not significant (ns), p = 0.33, relative to matching controls by FDR-adjusted pairwise two-sided Welch’s t-test. h GSEA enrichment plot of the EMT gene signature in BBN-KO vs. WT cells and BBN-KO cells treated with ROCKi 10 μM vs. vehicle. n = 2. ES, Enrichment Score; NES, Normalized Enrichment Score; p, two-sided permutation test p-value. Source data are provided as Source Data file.
Fig. 8
Fig. 8. Loss of NUMB triggers RHOA/ROCK-dependent YAP hyperactivation in human RT4 BCa cells.
a Expression of NUMB and the indicated Hippo pathway components in control- (Ctr-KD) and NUMB-silenced (NUMB-KD) RT4 cells. GRP94, loading control. Data are representative of two independent experiments. b Quantification of YAP nuclear/cytoplasmic ratio in Ctr-KD and NUMB-KD RT4 cells treated with LatA (500 nM, 6 h), C3 transferase (3 µg/ml, 6 h), Y-27632 (ROCKi, 10 µM, 12 h), NSC-23766 (RACi, 10 µM, 12 h) or vehicle and co-stained for endogenous YAP and DAPI. Representative confocal images are shown in Supplementary Fig. 10a. Data are shown as the mean/field ± SEM, n = 8 fields/condition, from two independent experiments. ****, p < 0.0001; not significant (ns) p-values are: p = 0.98, 0.98, 1 and 1, for RT4 Ctr-KD cells treated with LatA, C3, ROCKi and RACi, respectively, p = 0.33 for RT4 NUMB-KD cells treated with RACi, relative to matching controls by two-sided Tukey’s HSD test. c Expression of NUMB, and total and phosphorylated YAP and MST1 in Ctr-KD vs. NUMB-KD RT4 cells treated with vehicle or C3 transferase (3 μg/mL, 6 h). Actin, loading control. Data are representative of two independent experiments. d Immunoblot of NUMB, total and phosphorylated cofilin, and phosphorylated MLC2 (p-MLC2), in Ctr-KD vs. NUMB-KD RT4 cells. Actin, loading control. Blots are representative of two independent experiments. e RT-qPCR of the indicated YAP transcriptional targets in NUMB-KD vs. Ctr-KD RT4 cells treated with C3 (3 µg/ml, 6 h) (left) or ROCKi Y-27632 (50 µM, 8 h) (right), or vehicle. Graphs show the relative mean fold expression ± SEM from three independent experiments. p-values by FDR-adjusted two-sided one-sample t-test (vs. vehicle-treated RT4 Ctr-KD): ANKRD1, Ctr-KD C3, not significant (ns, p = 0.076); NUMB-KD Veh, p = 0.042 (*); CTGF, Ctr-KD C3, ns (p = 0.36); NUMB-KD Veh, p = 0.03 (*); CYR61, Ctr-KD C3, p = 0.011 (*); NUMB-KD Veh, p = 0.007 (**) (left); ANKRD1, Ctr-KD ROCKi, ns (p = 0.263); NUMB-KD Veh, p = 0.013 (*); CTGF, Ctr-KD ROCKi, ns, (p = 0.7); NUMB-KD Veh, p = 0.034 (*); CYR61, Ctr-KD ROCKi, ns (p = 0.52); NUMB-KD Veh, p = 0.009 (**) (right). p-values by FDR-adjusted two-sided Welch’s t-test: C3- vs. vehicle-treated NUMB-KD (left), ANKRD1, p = 0.03 (*); CTGF, p = 0.0072 (**); CYR61, p = 0.0022 (**); ROCKi- vs. vehicle-treated NUMB-KD (right): ANKRD1, p = 0.0045 (**); CTGF, p = 0.0016 (**); CYR61, p = 0.00057 (***). f Enrichment of the EMT gene signature by GSEA in NUMB-KD RT4 cells treated with ROCKi vs. vehicle as in ‘e’. n = 1. ES, Enrichment Score; NES, Normalized Enrichment Score; p, two-sided permutation test p-value. g Morphology of organoids from stable Ctr-KD vs. NUMB-KD RT4 cells treated with vehicle (Veh), verteporfin (VP, 25 nM) or ROCKi Y-27632 (10 µM). The red arrow points to invasive protrusions in NUMB-KD RT4 cells. Bar, 100 µm. h Morphometric analysis of the experiment in ‘g’ (see legend to Fig. 4f). Ctr-KD+Vehicle, n = 122; Ctr-KD + VP, n = 77; Ctr-KD+ROCKi, n = 59; NUMB-KD+Vehicle, n = 68; NUMB + VP, n = 54; NUMB+ROCKi, n = 50, obtained from two independent experiments. ****, p < 0.0001; ***, p = 0.00032; **, p = 0.006; *, p = 0.024 (Circularity), 0.034 (Roughness), 0.034 (Shape Complexity); not significant (ns) p-values are: p = 0.2, 0.37 and 0.19, for Circularity, Roughness and Shape Complexity, respectively, for RT4 Ctr-KD cells treated with VP; p = 0.37, 0.17 and 0.12, for Circularity, Roughness and Shape Complexity, respectively, for RT4 Ctr-KD cells treated with ROCKi, relative to matching condition by FDR-adjusted pairwise two-sided Welch’s t-test. i Transwell Matrigel invasion assay of Ctr-KD and NUMB-KD RT4 cells treated with vehicle, VP (100 nM), C3 (3 µg/mL) and ROCKi Y-27632 (10 µM) for 48 h. Number of invading cells/field expressed as the mean ± SEM of 8 microscope fields from two independent experiments. **, p = 0.003, 0.002 and 0.003, for RT4 NUMB-KD cells treated with vehicle, VP and C3, respectively; *, p = 0.046; not significant (ns) p-values are: p = 0.091, 0.99 and 0.091, for RT4 Ctr-KD cells treated with VP, C3 and ROCKi, respectively, vs. matching condition by FDR-adjusted pairwise two-sided Welch’s t-test. Source data are provided as Source Data file.
Fig. 9
Fig. 9. Loss of NUMB expression correlates with increased p-cofilin levels in NMIBC patients.
a Representative IHC staining of phosphorylated cofilin (p-Cofilin) and NUMB in NUMBHigh and NUMBLow high-grade NMIBC TUR specimens. Magnifications (Mag.) of the boxed areas are shown in the lower panels. Bars, 500 µm; Mag, 100 µm. b Quantification of the % of p-cofilin positive cells in 6 NUMBHigh vs. 5 NUMBLow high-grade NMIBC TUR specimens. Values are expressed as mean ± SEM. **, p = 0.0019 by two-sided Welch’s t-test. c Schematic representation of the molecular events influencing the Hippo/YAP pathway activation state in the bladder urothelium in NUMB-proficient or -deficient conditions. In NUMB-proficient conditions (NUMB proficiency), the presence of NUMB keeps in check RHOA/ROCK signaling to the actin machinery, leading to activation of the Hippo pathway, with ensuing YAP phosphorylation, cytoplasmic retention and transcriptional inactivation. In NUMB-deficient conditions (NUMB deficiency), the absence of NUMB leads to activation of RHOA/ROCK signaling to the actin machinery, which in turn suppresses the Hippo pathway, resulting in nuclear translocation of unphosphorylated YAP and ensuing transcription of its target genes via TEAD interaction. Through its transcriptional targets, CYR61 and CTGF, YAP induces EMT, which likely underlies the acquisition of mesenchymal/invasive traits responsible for the biological aggressiveness of NUMB-deficient BCa. Source data are provided as Source Data file.

References

    1. Siegel, R. L., Miller, K. D., Fuchs, H. E. & Jemal, A. Cancer Statistics, 2021. CA Cancer J. Clin.71, 7–33 (2021). - PubMed
    1. Kaufman, D. S., Shipley, W. U. & Feldman, A. S. Bladder cancer. Lancet374, 239–249 (2009). - PubMed
    1. Robertson, A. G. et al. Comprehensive molecular characterization of muscle-invasive bladder cancer. Cell174, 1033 (2018). - PMC - PubMed
    1. Kamat, A. M. et al. Bladder cancer. Lancet388, 2796–2810 (2016). - PubMed
    1. Witjes, J. A. et al. European Association of Urology Guidelines on Muscle-invasive and Metastatic Bladder Cancer: Summary of the 2020 Guidelines. Eur. Urol.79, 82–104 (2021). - PubMed

Publication types

MeSH terms

Associated data