. 2024 Dec 3;15(1):10496.
doi: 10.1038/s41467-024-55005-3.

ATAD5-BAZ1B interaction modulates PCNA ubiquitination during DNA repair

Affiliations

ATAD5-BAZ1B interaction modulates PCNA ubiquitination during DNA repair

Yeongjae Kim et al. Nat Commun. .

Abstract

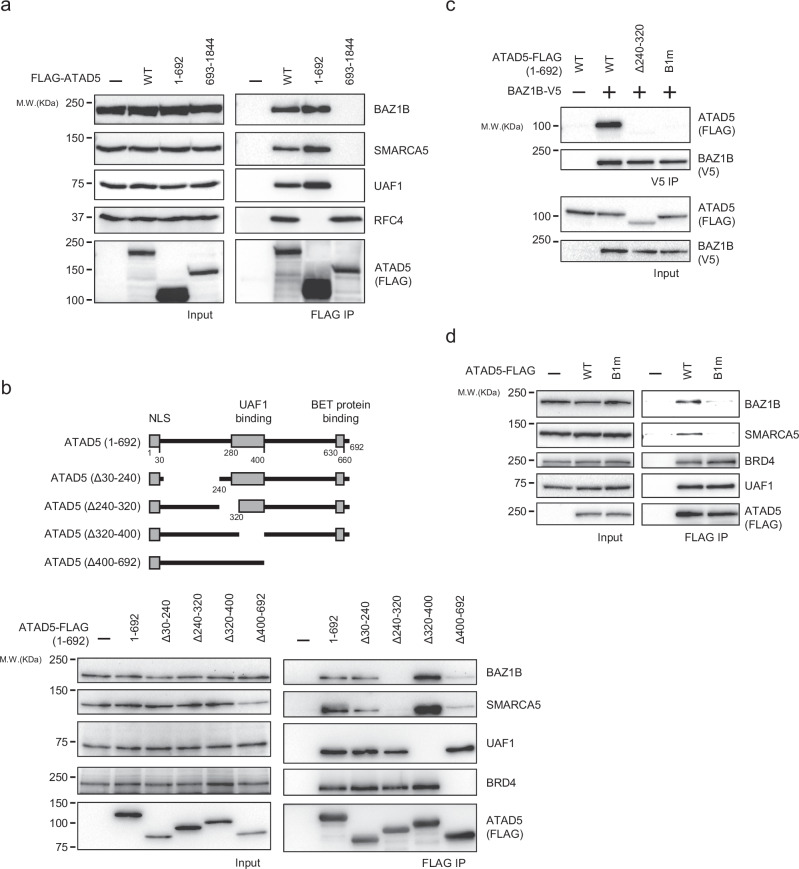
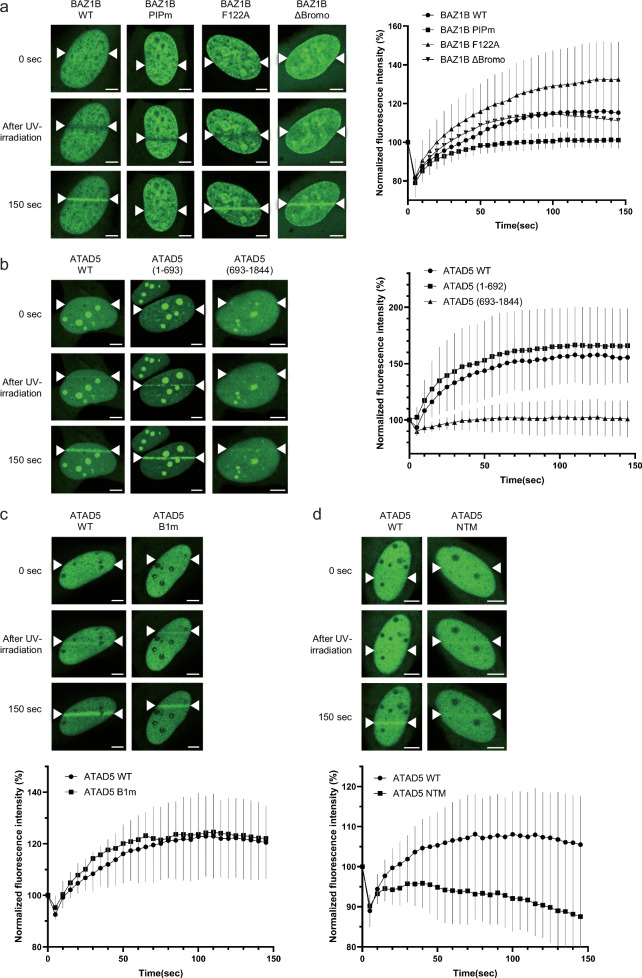
Mono-ubiquitinated PCNA (mono-Ub-PCNA) is generated when replication forks encounter obstacles, enabling the bypass of DNA lesions. After resolving stalled forks, Ub-PCNA must be de-ubiquitinated to resume high-fidelity DNA synthesis. ATAD5, in cooperation with the UAF1-USP1 complex, is responsible for this de-ubiquitination. However, the precise regulation of timely Ub-PCNA de-ubiquitination remains unclear. Our research reveals that BAZ1B, a regulatory subunit of the BAZ1B-SMARCA5 chromatin-remodeling complex (also known as the WICH complex), plays a crucial role in fine-tuning the de-ubiquitination process of Ub-PCNA. The BAZ1B binding region of ATAD5 encompasses the UAF1-binding domain of ATAD5. Disruption of the ATAD5-BAZ1B interaction results in premature de-ubiquitination of Ub-PCNA following treatment with hydrogen peroxide. Cells with impaired BAZ1B binding to ATAD5 display increased sensitivity to oxidative stress compared to wild-type cells. These findings suggest that BAZ1B prevents premature Ub-PCNA de-ubiquitination, thereby safeguarding genome integrity.


Conflict of interest statement

Competing interests: The authors declare no competing interests.

Figures

Fig. 1
Fig. 1. BAZ1B interacts with ATAD5.
a BAZ1B-SMARCA5 binds to ATAD5. ATAD5 was affinity-purified using Strep-Tactin beads from ATAD5 knock-out cells that re-express CLIP-ATAD5-FLAG-StrepII. The co-isolated proteins were identified through Mass Spectrometry. b BAZ1B is co-precipitated with ATAD5. ATAD5 was affinity purified from the indicated cells, and co-purified proteins were analyzed using immunoblotting. c ATAD5 binds to BAZ1B-SMARCA5. Transiently expressed BAZ1B-FLAG was immunoprecipitated using anti-FLAG beads and the co-isolated proteins were identified by Mass Spectrometry. BAZ1B binds to ATAD5. Transiently expressed BAZ1B-FLAG, (d), or endogenous BAZ1B, (e), was immunoprecipitated using anti-FLAG beads or anti-BAZ1B antibody, respectively. The isolated proteins were examined by immunoblotting. f BAZ1B depletion abolished the interaction between SMARCA5 and ATAD5. FLAG-ATAD5 and SMARCA5-V5 were transiently expressed, with or without BAZ1B depletion as indicated, to assess interactions. g Oxidative stress does not affect ATAD5-BAZ1B interaction. Wild-type ATAD5 cells were treated with 1 mM hydrogen peroxide for 20 min, followed by incubation in fresh media for the indicated time period. ATAD5 was immunoprecipitated using anti-FLAG beads. The numbers below the BAZ1B blot indicate the relative amount of BAZ1B co-precipitating. Source data are provided as a Source Data file.
Fig. 2
Fig. 2. ATAD5 de-ubiquitination domain interacts with BAZ1B.
a BAZ1B binds to the N-terminal domain of ATAD5. FLAG-tagged truncated mutants of ATAD5 were transiently expressed, followed by FLAG-immunoprecipitation. b The region of ATAD5 upstream UAF1-binding domain is important for BAZ1B binding. Top, Diagram illustrating ATAD5 (1–692) and its deletion variants. Bottom, the indicated FLAG-ATAD5 (1–692) variants were transiently expressed, and FLAG-immunoprecipitation was performed.  c–d ATAD5 264TVSYEEF270 is crucial for its interaction with BAZ1B. The indicated FLAG-tagged variants of ATAD5 (1–692), (c), or full-length FLAG-tagged ATAD5 variants, (d), were transiently expressed, and FLAG-immunoprecipitation was performed. The ATAD5 B1m variant denotes a mutation that changes 264TVSYEEF270 to AVAYAA (see Supplementary Fig. 2b). Source data are provided as a Source Data file.
Fig. 3
Fig. 3. BAZ1B N-terminal domains bind to ATAD5 and PCNA.
a ATAD5 binds to the N-terminal domain of BAZ1B. Top, Diagram of BAZ1B variants analyzed for their interaction with ATAD5. Bottom, the indicated BAZ1B-V5 fragments were transiently expressed, followed by V5-immunoprecipitation. SMARCA5 bound to BAZ1B (501–1483), but ATAD5 did not. b BAZ1B 118EECDF122 (A5BM1) and 221KYDVK225 (A5BM2) are important for ATAD5 interaction. Top, Diagram illustrating the ATAD5 binding motifs on BAZ1B (see Supplementary Fig. 3b). Bottom, the indicated CLIP-BAZ1B-StrepII-FLAG variants were transiently expressed, and FLAG-immunoprecipitation was performed. A5BM1m and A5BM2m denote mutations where 18EECDF122 is changed to AAAAA and 221KYDVK225 is changed to AAAAA, respectively. c F122 in A5BM1 is crucial for ATAD5 interaction. The CLIP-BAZ1B-StrepII-FLAG variants containing single amino acid mutations in A5BM1 were transiently expressed, followed by FLAG-immunoprecipitation. d PCNA binds to BAZ1B (323–466). Top, Diagram of BAZ1B variants analyzed for their interaction with PCNA. Bottom, the indicated BAZ1B-V5 fragments were transiently expressed, and V5-immunoprecipitation was performed. e BAZ1B binds to PCNA and ATAD5 independently. Wild-type or PIPm (436KQMTL440 changed to AAGAG) CLIP-BAZ1B-StrepII-FLAG variant were transiently expressed, and FLAG-immunoprecipitation was performed. The PIPm mutation abolished PCNA binding but did not affect the interaction with ATAD5. Source data are provided as a Source Data file.
Fig. 4
Fig. 4. BAZ1B and ATAD5 independently localize to DNA damage sites.
a BAZ1B is recruited to micro-irradiated sites via PCNA. Indicated BAZ1B-FLAG-mNeonGreen variants were expressed in U2OS cells, which were then subjected to 355 nm UV laser micro-irradiation to the area indicated by the white arrowheads. The mean intensity of biological replicates (n = 8 for wild-type, n = 6 for PIPm, n = 8 for F122A and n = 7 for ΔBromo) are depicted as points, while the bands represent the standard deviation of all data points. b The N-terminal domain of ATAD5 is recruited to DNA damage sites. The indicated mNeonGreen-ATAD5 variants were expressed in U2OS cells, which were then subjected to 355 nm UV laser micro-irradiation to the area indicated by the white arrowheads. The mean intensity of biological replicates (n = 7 for wild-type, n = 8 for ATAD5 (1–692), and n = 12 for ATAD5 (693–1844)) are depicted as points, while the bands represent the standard deviation of all data points. c The interaction between ATAD5 and BAZ1B is not essential for the recruitment of ATAD5 to damage sites. Wild-type or B1m ATAD5-FLAG-mNeonGreen was expressed in U2OS cells, which were then subjected to 355 nm UV laser micro-irradiation to the area indicated by the white arrowheads. The mean intensity of biological replicates (n = 6 for wild-type and n = 6 for B1m) are depicted as points, while the bands represent the standard deviation of all data points. d The N-terminal region of ATAD5 is important for damage-site recruitment. Wild-type or NTM ATAD5-FLAG-mNeonGreen was expressed in U2OS cells, which were then subjected to 355 nm UV laser micro-irradiation to the area indicated by the white arrowheads. The mean intensity of biological replicates (n = 9 for wild-type and n = 7 for NTM) are depicted as points, while the bands represent the standard deviation of all data points. Refer to Supplementary Fig. 5d for the information on NTM. The scale bar in representative micrographs of (ad) is 5 µm. Source data are provided as a Source Data file.
Fig. 5
Fig. 5. BAZ1B regulates Ub-PCNA de-ubiquitination through ATAD5 interaction.
a BAZ1B depletion decreases Ub-PCNA levels after H2O2 treatment. BAZ1B or SMARCA5 was depleted, and cells were treated with 1 mM H2O2 for 20 min. Following incubation in fresh media for the indicated times, chromatin fractions were prepared and analyzed by immunoblotting. The right panel shows the quantified relative amount of Ub-PCNA. Error bars represent the standard deviation of the mean from three independent replicates. Statistical analysis: Ordinary one-way ANOVA; ****P ≤ 0.0001 and ns: not significant. b Abrogation of the ATAD5-BAZ1B interaction reduces Ub-PCNA levels after oxidative stress. ATAD5 knock-out cells expressing either wild-type ATAD5 or ATAD5 B1m were treated with 0.3 mM H2O2 for 20 min. After incubating in fresh media for the indicated times, cells were harvested, and chromatin fractions were prepared. The right panel shows the quantified relative amount of Ub-PCNA. Error bars represent the standard deviation of the mean from three independent replicates. Statistical analysis: Ordinary one-way ANOVA; ****P ≤ 0.0001, **P ≤ 0.01, and ns: not significant. c BAZ1B regulates Ub-PCNA de-ubiquitination by USP1. Cells with USP1 depletion, expressing either wild-type ATAD5 or ATAD5 B1m, were treated with 0.3 mM H2O2 for 20 min. Following incubation in fresh media for the indicated times, chromatin fractions were prepared and analyzed by immunoblotting. The right panel shows the quantified relative amount of Ub-PCNA. Error bars represent the standard deviation of the mean from three independent replicates. Statistical analysis: Two-way ANOVA; ****P ≤ 0.0001, ***P ≤ 0.001, and ns: not significant. Source data are provided as a Source Data file.
Fig. 6
Fig. 6. BAZ1B-SMARCA5 interferes with Ub-PCNA de-ubiquitination in vitro.
a ATAD5 (1–603) interacts with BAZ1B-SMARCA5 in vitro. MBP-tagged ATAD5 (1–603) (20 nM) and various amounts of BAZ1B-SMARCA5 were mixed, and MBP-ATAD5 (1–603) was isolated using amylose resin. b–c BAZ1B-SMARCA5 interferes with the interaction between UAF1 and ATAD5. Wild-type, (b), or B1m MBP-ATAD5 (1–603), (c), were mixed with UAF1-USP1 and BAZ1B-SMARCA5, followed by amylose resin pull down. d BAZ1B-SMARCA5 inhibits Ub-PCNA de-ubiquitination by the ATAD5-UAF1-USP1 complex in vitro. A Ub-PCNA de-ubiquitination assay was performed using DNA-loaded Ub-PCNA and either wild-type or B1m MBP-ATAD5 (1–603) in the presence or absence of BAZ1B-SMARCA5. The bottom panel shows the quantified relative amounts of de-ubiquitinated PCNA. Error bars represent the standard deviation of the mean from three independent replicates. Statistical analysis: Two-way ANOVA; **P ≤ 0.01 and ns: not significant. Source data are provided as a Source Data file.
Fig. 7
Fig. 7. ATAD5-BAZ1B interaction is important for maintaining genomic integrity.
a DNA replication is more severely inhibited in ATAD5 B1m cells compared to wild-type under oxidative stress. Cells were labeled with EdU for 30 min and treated with H2O2 for 20 min as indicated. Following the Click reaction, EdU intensity was measured by flow cytometry. The relative decrease in the percentage of EdU-positive cells was calculated from three independent experiments. Error bars represent the standard deviation of the mean from three independent replicates. Statistical analysis: Two-way ANOVA; ****P ≤ 0.0001. b Phosphorylation of CHK1 and CHK2 increases in ATAD5 B1m cells after hydrogen peroxide treatment. The indicated cells were fractionated following treatment with hydrogen peroxide at the indicated concentration for 20 min. The bottom panel shows the quantified relative amounts of Ub-PCNA, phospho-CHK1, and phospho-CHK2. Error bars represent the standard deviation of the mean from three independent replicates. Statistical analysis: Two-way ANOVA; ****P ≤ 0.0001, ***P ≤ 0.001, *P ≤ 0.05, and ns: not significant. c Abrogation of the ATAD5-BAZ1B interaction results in more DNA breaks after oxidative stress. An alkaline comet assay was performed on wild-type or B1m ATAD5 cells after treatment with 0.1 mM H2O2 for 1 h. The scale bar in representative micrographs is 100 µm. The right panel shows the quantification of the tail moment. At least 150 nuclei were quantified for each condition and red lines indicate the corresponding mean values. Statistical analysis: Two-way ANOVA; ****P ≤ 0.0001. d Abrogation of the ATAD5-BAZ1B interaction increases sensitivity to H2O2. A clonogenic survival assay was conducted with wild-type or B1m ATAD5 cells following treatment with H2O2 (0–0.5 mM for 16 h). Error bars represent the standard deviation of the mean from three independent replicates. Statistical analysis: Ordinary one-way ANOVA; ***P ≤ 0.001 and **P ≤ 0.01. Source data are provided as a Source Data file.

References

    1. Sirbu, B. M. et al. Identification of proteins at active, stalled, and collapsed replication forks using isolation of proteins on nascent DNA (iPOND) coupled with mass spectrometry. J. Biol. Chem.288, 31458–31467 (2013). - PMC - PubMed
    1. Sirbu, B. M. et al. Analysis of protein dynamics at active, stalled, and collapsed replication forks. Genes Dev.25, 1320–1327 (2011). - PMC - PubMed
    1. Aleksandrov, R. et al. Protein Dynamics in Complex DNA Lesions. Mol. Cell69, 1046–1061.e5 (2018). - PubMed
    1. Ribeyre, C. et al. Nascent DNA Proteomics Reveals a Chromatin Remodeler Required for Topoisomerase I Loading at Replication Forks. Cell Rep.15, 300–309 (2016). - PubMed
    1. Wessel, S. R., Mohni, K. N., Luzwick, J. W., Dungrawala, H. & Cortez, D. Functional Analysis of the Replication Fork Proteome Identifies BET Proteins as PCNA Regulators. Cell Rep.28, 3497–3509.e4 (2019). - PMC - PubMed

Publication types

MeSH terms

Substances

LinkOut - more resources