. 2024 Dec 3;15(1):10516.
doi: 10.1038/s41467-024-54937-0.

Epi-microRNA mediated metabolic reprogramming counteracts hypoxia to preserve affinity maturation

Affiliations

Epi-microRNA mediated metabolic reprogramming counteracts hypoxia to preserve affinity maturation

Rinako Nakagawa et al. Nat Commun. .

Abstract

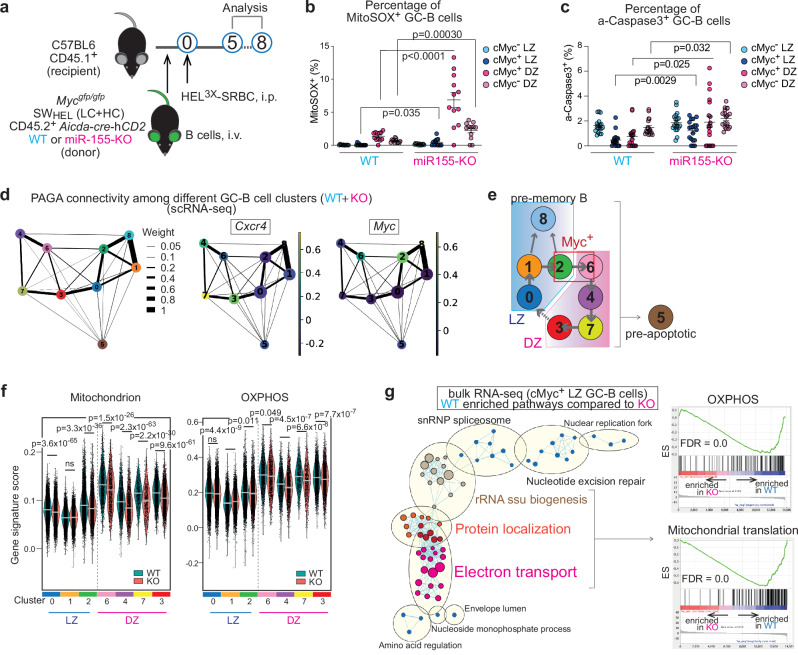
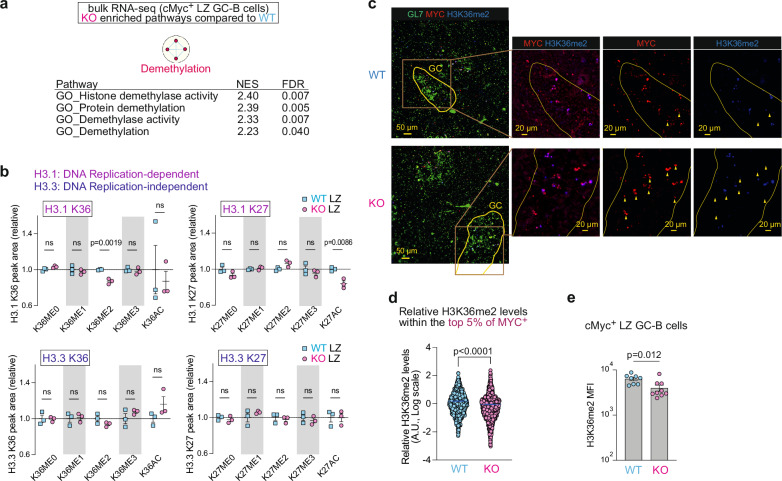
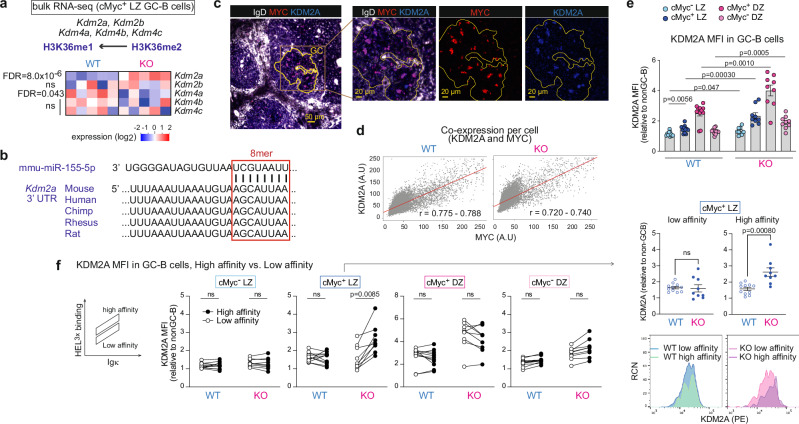
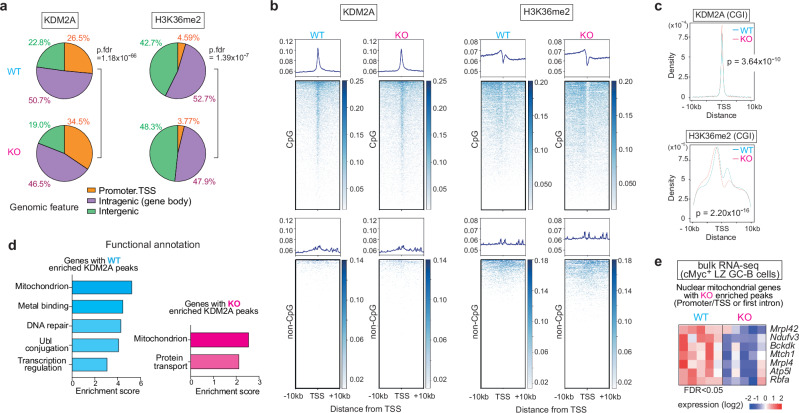
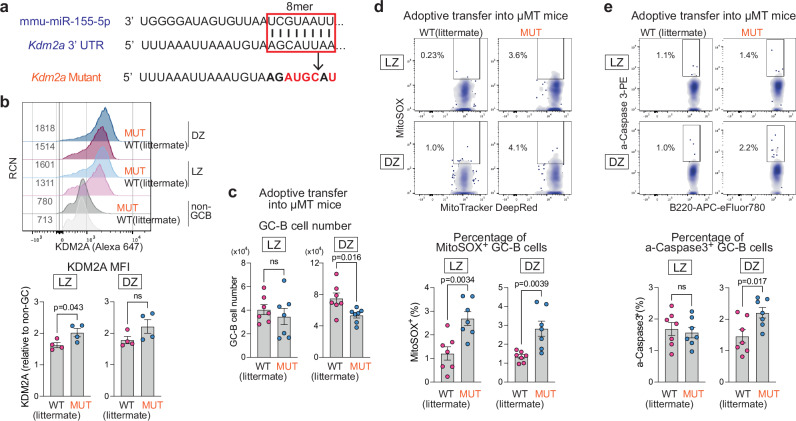
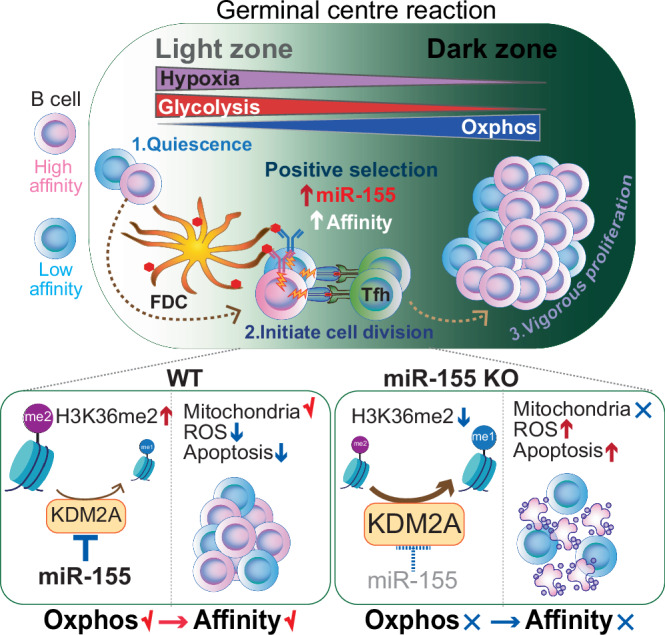
To increase antibody affinity against pathogens, positively selected GC-B cells initiate cell division in the light zone (LZ) of germinal centers (GCs). Among these, higher-affinity clones migrate to the dark zone (DZ) and vigorously proliferate by utilizing energy provided by oxidative phosphorylation (OXPHOS). However, it remains unknown how positively selected GC-B cells adapt their metabolism for cell division in the glycolysis-dominant, cell cycle arrest-inducing, hypoxic LZ microenvironment. Here, we show that microRNA (miR)-155 mediates metabolic reprogramming during positive selection to protect high-affinity clones. Mechanistically, miR-155 regulates H3K36me2 levels in hypoxic conditions by directly repressing the histone lysine demethylase, Kdm2a, whose expression increases in response to hypoxia. The miR-155-Kdm2a interaction is crucial for enhancing OXPHOS through optimizing the expression of vital nuclear mitochondrial genes under hypoxia, thereby preventing excessive production of reactive oxygen species and subsequent apoptosis. Thus, miR-155-mediated epigenetic regulation promotes mitochondrial fitness in high-affinity GC-B cells, ensuring their expansion and consequently affinity maturation.


Conflict of interest statement

Competing interests: The authors declare no direct competing financial or nonfinancial interests.

Figures

Fig. 1
Fig. 1. MiR-155 is required for promoting mitochondrial fitness in GC-B cells.
a Experimental design for all the experiments for Fig. 1. b Percentage of MitoSOX+ GC-B cells five days after HEL3 × -SRBC immunization. Pooled from three independent experiments (WT n = 12; KO n = 12). Unpaired student’s t-test, two-tailed. c Percentage of active-Caspase 3+ GC-B cells at seven days after HEL3 × -SRBC immunization. Pooled from two independent experiments (WT n = 18; KO n = 19). Unpaired student’s t-test, two-tailed. d The PAGA algorithm generates a topology-preserving map of single cells along with the sequential changes of gene expression. PAGA graphs were constructed using a k-nearest neighbors’ algorithm to show relationships between clusters. The Ball-and-stick representation displays PAGA connectivity among GC-B cell clusters identified though scRNA-seq. Ball size represents cluster size, and edge thickness indicates connectivity between clusters. Normalized gene expression for Cxcr4 or Myc is shown in the PAGA graph. e Predicted relationship between the clusters identified in scRNA-seq of GC-B cells. f Violin plots showing gene signature scores for “Mitochondrion” and “OXPHOS”. The bar represents median value. Wilcoxon rank sum test, two-sided, n.s., not significant. g, Enrichment map visualizing GSEA results of the bulk RNA-seq data from WT and KO cMyc+ LZ GC-B cells. GC-B cells were sorted five days after HEL3 × -SRBC immunization. WT-enriched pathways (q < 0.0001) were used. Nodes represent gene sets, and edges represent mutual overlap. Highly redundant gene sets were grouped as clusters (left). ES; enriched score, FDR; false discovery rate. Unless otherwise stated, mean ± SEM is indicated.
Fig. 2
Fig. 2. MiR-155 regulates H3K36me2 levels in dividing LZ GC-B cells.
a Enrichment map visualizing GSEA results of bulk RNA-seq data from WT and KO cMyc+ LZ GC-B cells. KO-enriched pathways (q < 0.1) were used. b The relative abundance of histone PTMs, including histone H3.1 K36, H3.3 K36, H3.1 K27 and H3.3 K27 in LZ GC-B cells from WT and KO mice. Donor-derived GC-B cells were sorted five days after HEL3 × -SRBC immunization for analysis. Triplicate samples were used for both WT and KO backgrounds. Unpaired student’s t-test, two-tailed. c Splenic sections of C57BL/6 mice, in the presence and absence of miR-155, seven days after SRBC immunization were stained for GL7 (green), MYC (red) and H3K36me2 (blue). Yellow wedges represent cells that are positive for MYC but negative for KDM2A. Scale bar, 50 µm. Representative images from two experiments (WT n = 4; KO n = 4). d Relative H3K36me2 levels determined by calculating the ratio of H3K36me2 MI to MYC MI from Supplementary Fig. 2c. The top 5% of MYC intensity values, representing the highest MYC expressing cells, were selected from each batch of two independent experiments. The bar represents mean. Unpaired student’s t-test, two-tailed. A.U., arbitrary unit. e MFI of H3K36me2 in cMyc+ LZ GC-B cells. Pooled from three independent experiments (WT n = 8; KO n = 9). Unpaired student’s t-test, two-tailed. Unless otherwise stated, mean ± SEM is indicated. n.s., not significant.
Fig. 3
Fig. 3. MiR-155 primarily controls KDM2A expression in high affinity cMyc+ LZ GC-B cells.
a Heat map showing the transcript levels of the enzymes involved in the demethylation of histone H3K36me2. The bulk RNA-seq dataset from WT and KO cMyc+ LZ GC-B cells was used. FDR values are shown. b Sequence alignment of a part of the 3’UTR of Kdm2a. The 8-mer miR-155 binding site is highlighted in a box. c Immunofluorescence staining of splenic section from a WT mouse seven days after SRBC immunization, showing IgD (white), MYC (red) and KDM2A (blue). Scale bar, 50 µm. Representative section images from two experiments (WT n = 4; KO n = 4). d Scatter plots show the MI of MYC and KDM2A within segmented GC cells in spleen sections from immunized WT and KO mice. The Pearson correlation coefficient (r) is presented with a 95% confidence interval in red. A.U., arbitrary unit. e Relative MFI of KDM2A in cells from four GC-B cell subpopulations. GC-B cells were derived from WT or KO donor B cells seven days after HEL3 × -SRBC immunization. Pooled from two independent experiments (WT n = 11; KO n = 9). Unpaired student’s t-test, two-tailed. f Relative MFI of KDM2A in cells from four GC-B cell subpopulations. GC-B cells were derived from WT or KO donor B cells seven days after HEL3 × -SRBC immunization. Low and high affinity were determined based on HEL3 × binding within Igκ+ GC-B cells. Pooled from two independent experiments (WT n = 11; KO n = 9). RCN, relative cell number. Paired student’s t-test, two-tailed. Unless otherwise stated, mean ± SEM is indicated. n.s., not significant.
Fig. 4
Fig. 4. The regulatory activity of miR-155 is revealed under hypoxia.
a Representative flow cytometric histograms of hypoxia dye, MAR vs. relative cell number (RCN) (left). Relative MFI of MAR (right) in GC-B and non-GC-B cells. GC-B and non-GC-B cells were isolated from inguinal lymph nodes of C57BL/6 mice. One-way ANOVA. Pooled from three independent experiments (n = 6). b KDM2A MFI of B cells from WT and KO mice cultured under normoxia (21% O2) or hypoxia (1% O2) for the indicated time periods. Unpaired student’s t-test, two-tailed. Pooled from three independent experiments (WT n = 5; KO n = 5). c Representative flow cytometric histograms of CTV vs. RCN at day 2 and 4 (top). CTV MFI of B cells from WT and KO mice cultured under normoxia or hypoxia for the indicated time periods (bottom). Unpaired student’s t-test, two-tailed. Pooled from five independent experiments (WT n = 5; KO n = 5). d Representative image of B cells from WT and KO mice cultured under normoxia or hypoxia for two days, followed by staining with MitoTracker Deep Red (Red) and MitoTracker Orange CM-H2 TMRos (green). DAPI (blue) was used as a nuclear counterstaining. Scale bar, 10 µm. Representative images are shown. e Quantification of relative MitoTracker Orange CMTMRos levels. Each dot represents one cell. One-way ANOVA. Pooled from two independent experiments (WT n = 4; KO n = 4). f Relative ATP levels in B cells from WT and KO mice. The replated cells were cultured for two hours in hypoxia with indicated media for ATP measurement. The luminescence values of each type of B cells cultured in media containing glucose for two hours in hypoxia were used to calculate relative ATP levels. One-way ANOVA. Pooled data from three experiments (WT n = 3; KO n = 3). Unless otherwise stated, mean ± SEM is indicated. n.s., not significant.
Fig. 5
Fig. 5. MiR-155 optimizes nuclear mitochondrial gene expression through Kdm2a-mediated control of H3K36me2 levels.
a Genomic distribution of KDM2A and H3K36me2 ChIP-seq peaks in B cells from WT and KO mice cultured for two days under hypoxia is shown as pie charts. The average percentage of the ChIP-seq triplicate samples is displayed. Promoter regions are defined as ± 2 kb of the transcription start site (TSS). Two-sided, p.FDR values are shown. b Metagene analysis and heatmaps of KDM2A or H3K36me2 for CpG islands (CGIs) containing genes or genes without CGIs. Metagene analyses are displayed in ± 10kb windows. A representative sample is shown. c Plots showing the distribution of peak distance to the nearest TSS. The average ChIP-seq read occupancy for KDM2A or H3K36me2 surrounding the TSS of CGIs containing genes. Kolmogorov-Smirnov test. p-values are shown. d Analysis of genes with “WT-enriched” and “KO-enriched” KDM2A peaks using the DAVID Functional Annotation Clustering Tool. Pathways with a two-sided modified fisher exact p-value < 0.05 were used for the analysis. e A heat map showing transcript levels of seven mitochondrial genes with “KO-enriched” KDM2A peaks at the promoter/TSS regions or first introns near the TSS.
Fig. 6
Fig. 6. The miR-155-Kdm2a interaction regulates mitochondrial ROS and apoptosis in GC-B cells.
a Schematics representation of the 8-mer miR-155-binding site in the 3’UTR of the Kdm2a (boxed) and the introduced base changes (red letters) to disrupt miR-155 binding in Kdm2a mutant mice. b Representative flow cytometric histograms showing KDM2A vs. RCN (top). RCN, relative cell number. Relative MFI values of KDM2A in LZ and DZ GC-B cells are shown (bottom). GC-B cells were derived from WT and MUT mice seven days after SRBC immunization. Unpaired student’s t-test, two-tailed. Pooled from three independent experiments (WT n = 4; MUT n = 4). c Number of LZ and DZ GC-B cells from WT and MUT mice within the µMT adoptive transfer system. Unpaired student’s t-test, two-tailed. Pooled from two independent experiments (WT n = 7; MUT n = 7). d Representative flow cytometric plots of MitoTracker DeepRed vs. MitoSOX in GC-B cells from WT and MUT mice within the µMT adoptive transfer system (top). Percentage of MitoSOX+ GC-B cells (bottom). Unpaired student’s t-test, two-tailed. Pooled from two independent experiments (WT n = 7; MUT n = 7). e Representative flow cytometric plots of B220 vs. active-Caspase 3 in GC-B cells from WT and MUT mice within the µMT adoptive transfer system (top). Percentage of active-Caspase 3+ GC-B cells (bottom). Unpaired student’s t-test, two-tailed. Pooled from two independent experiments (WT n = 7; MUT n = 7). Unless otherwise stated, mean ± SEM is indicated. n.s., not significant.
Fig. 7
Fig. 7. Working model: miR-155-mediated epigenetic regulation control mitochondrial fitness during GC-B cell positive selection.
Following the reception of signals through BCR engagement and T cell help, LZ GC-B cells undergo a positive selection process that induces cell division. Positively selected GC-B cells, particularly high-affinity clones, migrate to the less hypoxic DZ and sustain their vigorous cell division by relying on OXPHOS for energy production. To promote the dynamic transition of GC-B cells from the hypoxic LZ to the DZ under hypoxia-induced stress, miR-155 plays a crucial role by repressing the hypoxia-induced expression of KDM2A. This repression mechanism enables precise regulation of H3K36me2 levels, leading to optimal expression of nuclear mitochondrial genes. As a result, mitochondrial remodeling is facilitated, and OXPHOS is enhanced in hypoxic conditions. Thus, the miR-155-Kdm2a interaction is indispensable for promoting mitochondrial fitness during positively selection, which provides robust mitochondrial in high-affinity clones to endure the high-rate of cell division in the DZ. This mechanism allows high-affinity clones to undergo clonal expansion, thus ensuring the process of affinity maturation.

Update of

References

    1. Berek, C., Berger, A. & Apel, M. Maturation of the immune response in germinal centers. Cell67, 1121–1129 (1991). - PubMed
    1. Jacob, J., Kelsoe, G., Rajewsky, K. & Weiss, U. Intraclonal generation of antibody mutants in germinal centres. Nature354, 389–392 (1991). - PubMed
    1. Kepler, T. B. & Perelson, A. S. Cyclic re-entry of germinal center B cells and the efficiency of affinity maturation. Immunol. Today14, 412–415 (1993). - PubMed
    1. Nakagawa, R. & Calado, D. P. Positive Selection in the Light Zone of Germinal Centers. Front Immunol.12, 661678 (2021). - PMC - PubMed
    1. Calado, D. P. et al. The cell-cycle regulator c-Myc is essential for the formation and maintenance of germinal centers. Nat. Immunol.13, 1092–1100 (2012). - PMC - PubMed

Publication types

MeSH terms

Associated data