. 2024 Dec 3;15(1):10537.
doi: 10.1038/s41467-024-54927-2.

Spint1 disruption in mouse pancreas leads to glucose intolerance and impaired insulin production involving HEPSIN/MAFA

Affiliations

Spint1 disruption in mouse pancreas leads to glucose intolerance and impaired insulin production involving HEPSIN/MAFA

Hsin-Hsien Lin et al. Nat Commun. .

Abstract

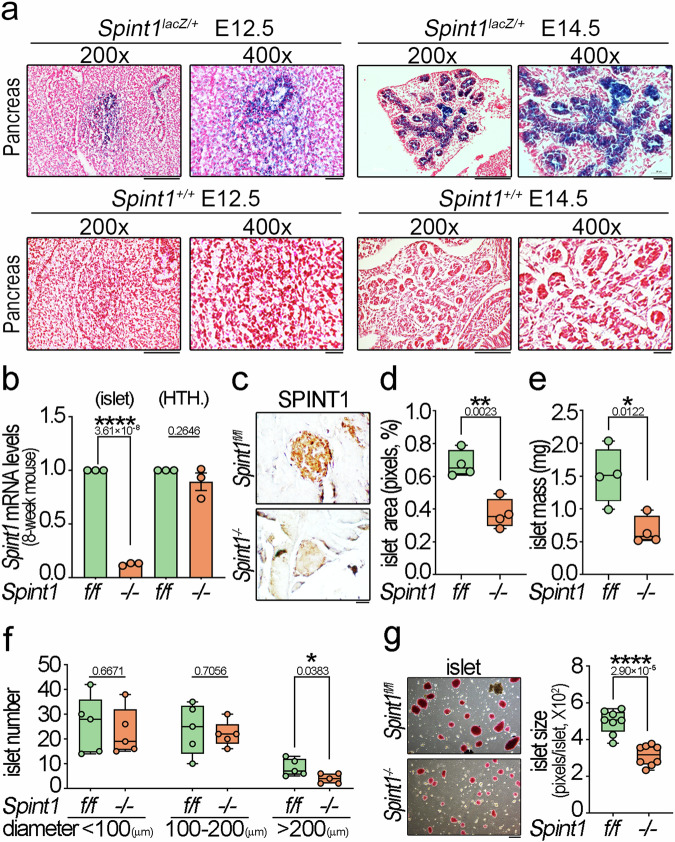
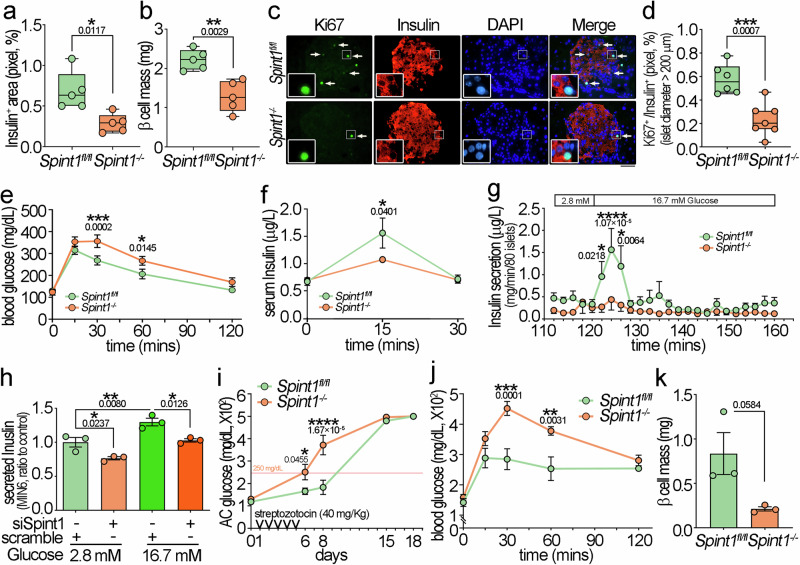
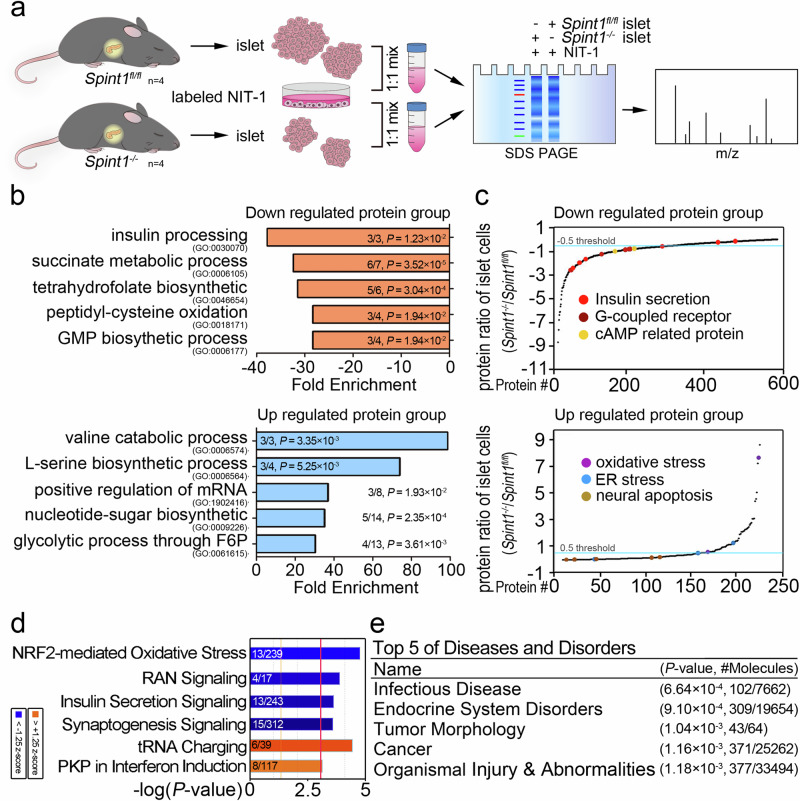
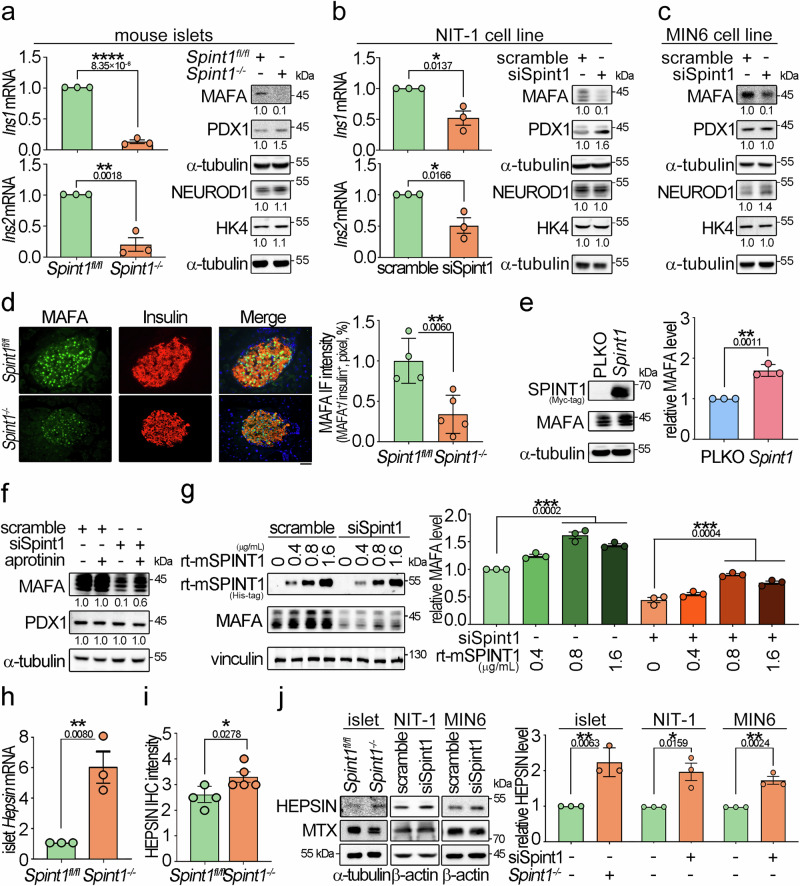
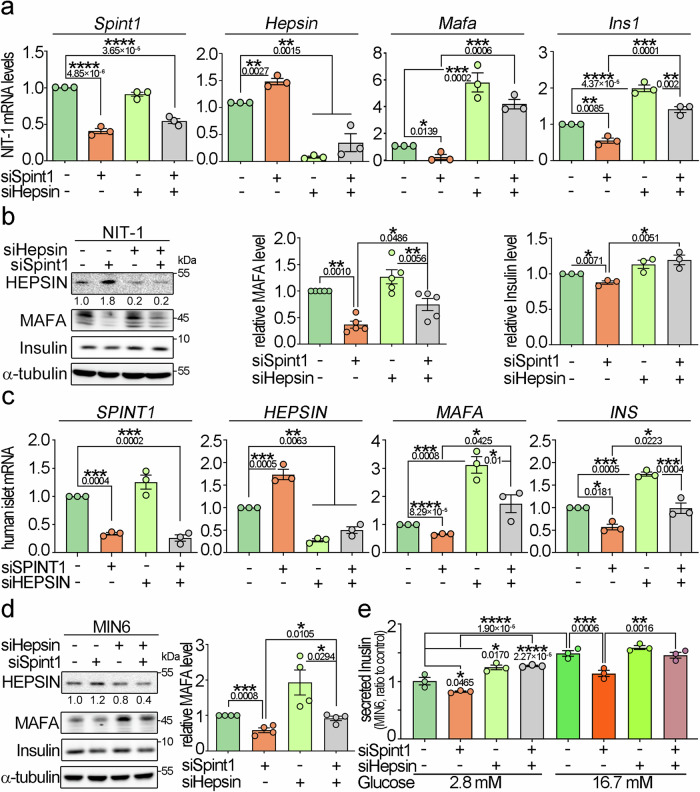
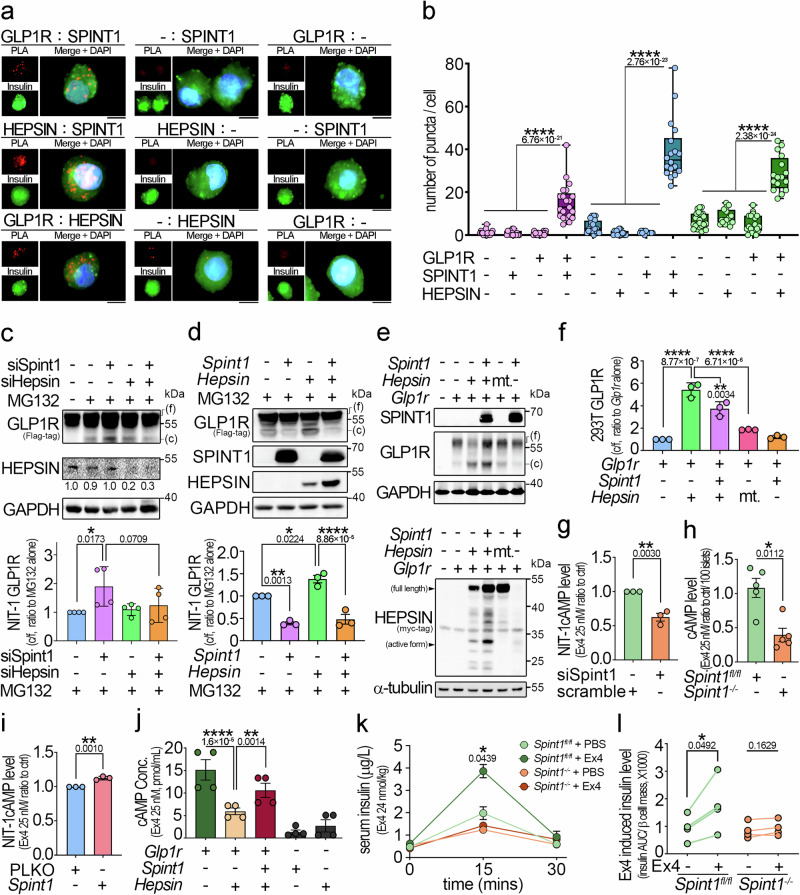
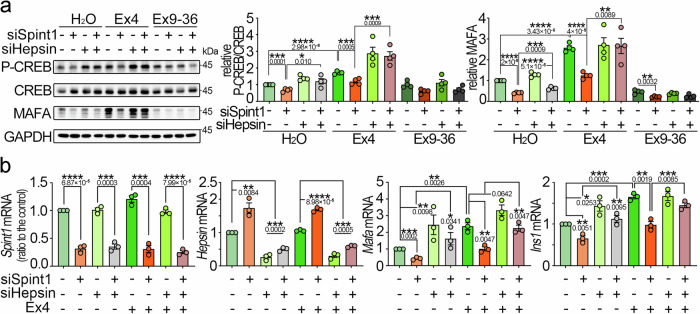
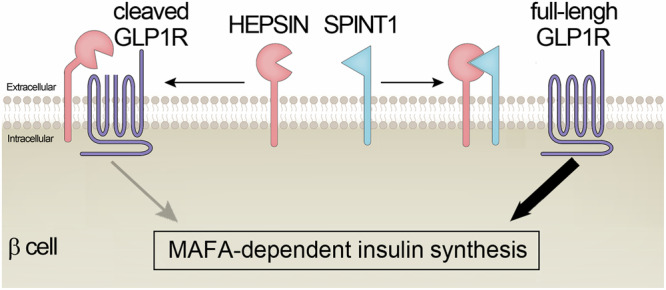
SPINT1, a membrane-anchored serine protease inhibitor, regulates cascades of pericellular proteolysis while its tissue-specific functions remain incompletely characterized. In this study, we generate Spint1-lacZ knock-in mice and observe Spint1 expression in embryonic pancreatic epithelium. Pancreas-specific Spint1 disruption significantly diminishes islet size and mass, causing glucose intolerance and downregulation of MAFA and insulin. Mechanistically, the serine protease HEPSIN interacts with SPINT1 in β cells, and Hepsin silencing counteracts the downregulation of Mafa and Ins1 caused by Spint1 depletion. Furthermore, we demonstrate a potential interaction between HEPSIN and GLP1R in β cells. Spint1 silencing or Hepsin overexpression reduces GLP1R-related cyclic AMP levels and Mafa expression. Spint1-disrupted mice also exhibit a significant reduction in Exendin-4-induced insulin secretion. Moreover, SPINT1 expression increases in islets of prediabetic humans compared to non-prediabetic groups. The results unveil a role for SPINT1 in β cells, modulating glucose homeostasis and insulin production via HEPSIN/MAFA signaling.


Conflict of interest statement

Competing interests: The authors declare no competing interests.

Figures

Fig. 1
Fig. 1. Expression patterns of Spint1-lacZ in Spint1lacZ/+ mouse embryonic pancreas and the islet phenotypes resulting from pancreas-specific Spint1-deficiency in 8-week-old mice.
a Representative LacZ-stained sections showed distinctive Spint1-lacZ expression patterns in the pancreas of E12.5 and E14.5 Spint1lacZ/+ embryos. Notably, prominent LacZ signals were observed in the E14.5 pancreas, encompassing the primordial pancreatic duct, its branches, and the acini-like structures budding from the ductal tip region. The bottom panel illustrated images of Spint1+/+ counterparts. Scale bar, 100 μm for 200× panels and 20 μm for 400× panels. b Validation of tissue-specific disruption of Spint1 in the mouse pancreatic islets using Q-RT-PCR. RNAs were extracted from the 8-week-old Spint1fl/fl and Spint1/− mouse pancreatic islets (left panel) and hypothalamus (HTH., right panel) and subjected to reverse transcription and Q-RT-PCR with normalization to Gapdh. Data were obtained from three independent experiments (three mice per group). c Immunohistochemical analysis of SPINT1 in the pancreatic islets of 8-week-old Spint1fl/fl and Spint1−/ mice. Scale bar, 20 μm. d Quantification of islet area percentage in 8-week-old Spint1fl/fl and Spint1/− mice. Each pancreas was serially sectioned (300 sections per pancreas, 5 μm per section), and one out of every 60 serial sections (300 μm intervals) was taken for H&E staining to reveal islet areas. ImageJ determined the percentage of islet area in a whole pancreas area based on the merged full-view microscopic images of 6 sections per mouse (four mice per group). e Analysis of islet mass in 8-week-old Spint1fl/fl and Spint1−/ mice. The islet mass was calculated by multiplying the islet area percentage in (d) by pancreas weight in Supplementary Fig. 3g (n = 4 per group). f Measurement of islet numbers in the pancreas of 8-week-old Spint1fl/fl and Spint1−/ mice. The islets with a diameter below 100 μm were defined as small islets, those with a diameter between 100 and 200 μm as medium islets, and those with a diameter above 200 μm as large islets. The islet numbers with different diameters were measured using microscopic images from H&E-stained sections using ImageJ (one out of every 300 μm interval from serial sections of each pancreas, 6 sections per mouse, 5 mice per group). g Quantification of islets sizes in 8-week-old Spint1fl/fl and Spint1/ mice. Pancreatic islets were isolated after collagenase perfusion (details in the Methods section) and stained with dithizone solution (7.5 mg/mL). The islet images (left panel, 4 low-power fields per pancreas) were taken under a dissecting microscope and subjected to size measurement (average islet area in pixels per islet) using ImageJ (right panel, n = 8 per group). Statistical significance was assessed by a two-tailed Student’s t-test for all quantifications. For the bar plot, bars are represented as mean ± SEM. In the box plots, the boxes span from the 25th to the 75th percentiles, with a line indicating the median. Whiskers extend to values within 1.5 times the interquartile range, defined as the difference between the 25th and 75th percentiles. Scale bar, 50 μm. *P < 0.05; **P < 0.01; ****P < 0.0001. Below the asterisks are the precise statistical results. Source data are provided as a Source Data file.
Fig. 2
Fig. 2. Dysfunction of β cells and glucose tolerance in pancreas-specific Spint1-deficiency mice.
a Percentages of insulin-positive area in 8-week-old Spint1fl/fl and Spint1/ mice. Mouse pancreas sections were immunohistochemically stained using an anti-insulin antibody. The merged full-view microscopic images (Supplementary Fig. 4) were analyzed to obtain the percentage of the insulin-positive area over the total pancreas area using ImageJ (one out of every 300 μm interval from serial sections per pancreas, 6 sections per mouse, 5 mice per group). b Analysis of β cell mass between 8-week-old Spint1fl/fl and Spint1−/ mice. The β cell mass was calculated by multiplying the insulin-positive area percentage in (a) by the pancreas weight in Supplementary Fig. 3g. (5 mice per group). c Representative immunofluorescence images of Ki67+ β cells in large islets (>200 μm in diameters) of 8-week-old Spint1fl/fl and Spint1−/ mice. Pancreatic sections were subjected to immunofluorescence microscopy to detect Ki67 (green) and insulin (red, β cells). Nuclei were counterstained with DAPI (blue). White arrows mark the Ki67+ β cells in the Ki67 and merged images. Higher magnification images are shown in the inset at the lower left corner of each panel. Scale bar, 20 μm. d Percentages of Ki67+ β cells in large islets (>200 μm in diameters) of Spint1fl/fl (n = 6) and Spint1−/− (n = 7) mice (6 sections per pancreas). The percentages of Ki67+ β cells in middle and small islets were shown in Supplementary Fig. 5c. e Analysis of glucose tolerance in 8-week-old Spint1fl/fl and Spint1−/− mice. Mice were fasted for 8 h and then intraperitoneally injected with 20% glucose solution (2 g glucose/kg body weight). The tail blood was then taken at 15, 30, 60, and 120 min after injection and examined for glucose level using a glucometer (n = 11 per group). f Measurement of glucose-induced serum insulin in 8-week-old Spint1fl/fl and Spint1−/− mice. Serum was collected from the submandibular region before (0 min), 15, and 30 min after the oral gavage of glucose (2 g/kg body weight), and insulin levels were measured using an ELISA kit (n = 4 per group). g Kinetics of insulin secretion in perfused islets from 8-week-old Spint1fl/fl and Spint1−/− mice. Pancreatic islets were isolated from mice using collagenase perfusion, and 80 pancreatic islets per mouse were handpicked. The islets were first perfused with a low concentration of glucose (2.8 mM) for 120 min and then challenged with a high concentration of glucose (16.7 mM) for 40 min (details in the Methods section). The secreted insulin levels in the conditioned media were measured every 2 min using an ELISA kit (n = 12 for Spint1fl/fl mice and n = 9 for Spint1/− mice). h Analysis of the secreted levels of insulin in Spint1-silenced MIN6 cells. Cells were transfected with siRNAs (siSpint1) to knock down Spint1. Control cells were transfected with scrambled siRNAs (scramble). Cells were then incubated in a medium containing 2.8 mM glucose for 2 h, followed by culture in a medium containing 16.7 mM glucose for 40 min. The conditioned media were collected, diluted 200 times, and examined for insulin levels using an ELISA kit. These results were statistically analyzed from three independent experiments (n = 3). i Early onset of diabetes in streptozotocin-induced 8-week-old Spint1/− mice. Mice were intraperitoneally injected with streptozotocin (40 mg/kg body weight) for 5 consecutive days and provided with 10% sucrose drinking water. Ante cibum blood glucose levels (AC glucose) were measured before streptozotocin treatment (day 0) and on days 6, 8, 15, and 18 after the treatment (n = 5 per group). These results were statistically analyzed from three independent experiments. j Aggravated glucose intolerance in streptozotocin-treated 8-week-old Spint1−/ mice compared to Spint1fl/fl mice. The streptozotocin-treated mice in (i) were fasted and intraperitoneally injected with 20% glucose solution (2 g/kg body weight). Blood glucose levels were measured at 15, 30, 60, and 120 min after glucose injection using a glucometer (n = 5 per group). k Analysis of β cell mass between streptozotocin-treated 8-week-old Spint1fl/fl and Spint1−/− mice. Mouse pancreas sections were immunohistochemically stained using an anti-insulin antibody, and β cell mass was calculated using the protocol in (b). Statistical significance was assessed by a two-tailed Student’s t-test for (a, b, d, k), and a two-way ANOVA followed by Sidak’s multiple comparison analysis for (ej). All data were represented as mean ± SEM. For bar plots, bars are represented as mean ± SEM. In the box plots, the boxes span from the 25th to the 75th percentiles, with a line indicating the median. Whiskers extend to values within 1.5 times the interquartile range, defined as the difference between the 25th and 75th percentiles. *P < 0.05; **P < 0.01; ***P < 0.001; ****P < 0.0001. Below the asterisks are the precise statistical results. Source data are provided as a Source Data file.
Fig. 3
Fig. 3. Quantitative proteomic analysis of Spint1fl/fl and Spint1/ islets using an alternative SILAC method.
a SILAC workflow for the proteomic analysis of Spint1fl/fl and Spint1−/− islets (4 mice per group). b Gene ontology (GO) analysis of the biological processes for differentially regulated proteins in the SILAC analysis of Spint1fl/fl and Spint1−/− islets. The biological processes significantly affected the downregulated and upregulated protein groups in Spint1−/− pancreatic islets compared to Spint1fl/fl islets listed in the upper and lower panels, respectively. The fractions in the histograms represent the proportion of identified proteins (numerator) in our dataset that correspond to those pathways, with the denominator indicating the total number of proteins in each pathway. c Protein abundance differences between Spint1fl/fl and Spint1−/− islets. The graph was generated using the Kyoto Encyclopedia of Genes and Genomes (KEGG) analysis of the biological pathways for the differentially regulated proteins between Spint1fl/fl and Spint1/ islets. The differentially regulated proteins were divided into the downregulated (upper panel) and upregulated (lower panel) groups in Spint1/ islets. The biological pathways with significant alteration in this study (e.g., insulin-related pathways) are highlighted with color dots in the graphs. d Analysis of the most highly regulated signal pathways using ingenuity pathway analysis (IPA) to examine the proteins differentially expressed in Spint1−/ islets relative to Spint1fl/fl islets. The top six differentially regulated signal pathways were identified using the threshold of −log (P value) >3. Downregulated pathways are represented by blue bars, while upregulated pathways are indicated by orange bars in Spint1−/ islets compared to Spint1fl/fl islets. The fractions in the histograms show the proportion of the identified proteins (numerator) in our database that correspond to those pathways, with the denominator indicating the total number of proteins in each pathway. e Top five diseases and disorders identified through IPA of the differentially regulated proteins in Spint1−/− islets compared to Spint1fl/fl islets. The fractions in the table represent the number of the identified proteins associated with various diseases and disorders (numerator) relative to the total number of proteins for the corresponding disease and disorder in the IPA dataset (denominator). Statistical analysis was performed using a two-sided Fisher’s exact test, and the false discovery rate was controlled using the Benjamini–Hochberg procedure to correct p values (P) for (b, d, e). Source data are provided as a Source Data file.
Fig. 4
Fig. 4. Downregulation of MAFA in Spint1-depleted mouse β cells accompanied by HEPSIN upregulation.
a Expression levels of Ins1/2 mRNA, three key transcription factors for insulin expression, and a glucose sensor in Spint1fl/fl and Spint1−/− mouse islets. The expression levels of insulin (Ins1 and Ins2) in mouse islets were examined using Q-RT-PCR with normalization to Gapdh (n = 3 per group, left panels). The protein levels of transcription factors (MAFA, PDX1, and NEUROD1) for insulin expression and a glucose sensor (glucokinase, HK4) were analyzed in collected mouse islets using immunoblot assays (n = 6 mice per group). α-tubulin was used as a loading control. b Effect of Spint1 silencing on the expression levels of Ins1, Ins2, MAFA, PDX1, NEUROD1, HK4, and α-tubulin in NIT-1 cells (n = 3 per group). c Effect of Spint1 silencing on the expression levels of MAFA, PDX1, NEUROD1, HK4, and α-tubulin in MIN6 cells (n = 3 per group). d Immunofluorescence staining of MAFA and insulin in 8-week-old Spint1fl/fl and Spint1−/− mouse islets. Pancreatic sections were subjected to immunofluorescence staining of MAFA (green) and insulin (red). The images were then taken using a fluorescence microscope. Scale bar, 20 μm. The right histogram represented the relative intensity of MAFA in β cells (three sections per pancreas, four mice for Spint1fl/fl, five mice for Spint1−/ mice). e Effect of Spint1 overexpression on MAFA expression in NIT-1 cells. Cells were transiently transfected with Spint1 plasmids with a MYC tag and control vectors (PLKO). Cell lysates were subjected to immunoblot analysis using anti-MYC and anti-MAFA antibodies. α-tubulin was used as a loading control. MAFA protein levels were then quantified and statistically calculated from three independent experiments with normalization to α-tubulin and relative to PLKO control (right panel, n = 3). f Effect of a broad serine protease inhibitor (aprotinin) on the expression of MAFA in Spint1-silencing NIT-1 cells. siSpint1- or scrambled siRNA-transfected NIT-1 cells were treated with or without 40 μg/mL aprotinin for 24 h. Cell lysates were subjected to immunoblot analysis using anti-MAFA and anti-PDX1 antibodies. α-tubulin was used as a loading control. MAFA and PDX1 protein levels were statistically calculated from three independent experiments and shown at the bottom of each image. g Effects of recombinant mouse SPINT1 proteins (rt-mSPINT1) on the MAFA expression in Spint1-depleted NIT-1 cells. Cells were transfected with siSpint1 and scramble siRNAs, cultured for 24 h, and then treated with 0, 0.4, 0.8, and 1.6 μg/mL rt-mSPINT1 for another 24 h. Cell lysates were subjected to immunoblot analysis using anti-MAFA and anti-His-tag antibodies. Vinculin was used as a loading control. MAFA protein levels were statistically calculated from three independent experiments with normalization to vinculin (right panel). The recombinant protein and anti-His-tag antibody products are listed in Supplementary Table 3. h Analysis of Hepsin expression in 8-week-old Spint1fl/fl and Spint1−/− mouse islets using Q-RT-PCR. Results were statistically calculated from three independent experiments. i Quantification of HEPSIN IHC intensity in Spint1fl/fl and Spint1−/− mouse islets. HEPSIN protein levels in Spint1fl/fl and Spint1−/ mouse islets were examined using IHC and shown in Supplementary Fig. 6e. HEPSIN intensities in Spint1fl/fl and Spint1−/ mouse islets were statistically calculated using ImageJ from three sections per mouse pancreas (n = 4 for Spint1fl/fl mice, n = 5 for Spint1−/− mice). j Immunoblot analysis of HEPSIN and matriptase (MTX) in mouse islets, NIT-1, and MIN6 cells. Lysates were collected from Spint1fl/fl and Spint1−/− mouse islets (left panel), NIT-1 and MIN6 cells (middle and right panels) with or without Spint1 silencing (siSpint1 versus scramble) and subjected to immunoblot analysis using anti-HEPSIN and anti-MTX antibodies. α-tubulin or β-actin was used as a loading control. The histogram (right panel) represents the quantification result of HEPSIN levels in the left panels. Data were statistically calculated with normalization to β-actin or α-tubulin from three independent experiments (n = 3 per group of mice or cell cultures). Statistical significance was assessed by a two-tailed Student’s t-test for all panels. All data were represented as mean ± SEM. *P < 0.05; **P < 0.01; ****P < 0.0001. Below the asterisks are the precise statistical results. Source data are provided as a Source Data file.
Fig. 5
Fig. 5. Hepsin involvement in Spint1-mediated expression of Mafa, Ins1, and their proteins, as well as insulin secretion.
a Q-RT-PCR analysis of Spint1, Hepsin, Mafa, and Ins1 expression in NIT-1 cells with depletion of Spint1, Hepsin, or both. Cells were transfected with siSpint1, siHepsin, both, or scramble siRNAs (control) and then subjected to RNA extraction and Q-RT-PCR, with normalization to Gapdh. Results were obtained from statistical calculations of three independent experiments (n = 3). b Immunoblot analysis of HEPSIN, MAFA, and insulin in NIT-1 cells with Spint1, Hepsin, or both silencing. The protein levels of MAFA (middle panel) and insulin (right panel) were statistically calculated with normalization to α-tubulin (n = 5 for MAFA, n = 3 for insulin). c Q-RT-PCR analysis of SPINT1, HEPSIN, MAFA, and INS1 expression in human primary islet cells with silencing of SPINT1, HEPSIN, or both. Cells were transfected with siSPINT1, siHEPSIN, both, or scramble siRNAs (control) and then subjected to RNA extraction and Q-RT-PCR, with normalization to GAPDH. Results were statistically calculated from three independent experiments (n = 3). d Effect of Spint1 or Hepsin silencing on MAFA and insulin expression in MIN6 cells. The histogram represents the quantitation data of western blots in the left panel. All data were statistically calculated from four independent experiments (n = 4), with normalization to α-tubulin. e Effect of Spint1 or Hepsin silencing on the glucose-stimulated insulin secretion in MIN6 cells. MIN6 cells were transfected with siSpint1 or siHepsin and then treated with 2.8 mM glucose or 16.7 mM glucose. The experimental details are described in the Methods section. The secreted insulin levels were statistically calculated from three independent experiments (n = 3) with normalization to the control (scramble, 2.8 mM glucose). Statistical significance was assessed using a two-tailed Student’s t-test for (d), a one-way ANOVA with Tukey’s post hoc test for (ac), and a two-way ANOVA followed by Sidak’s multiple comparison analysis for (e). All data were represented as mean ± SEM. *P < 0.05; **P < 0.01; ***P < 0.001; ****P < 0.0001. Below the asterisks are the precise statistical results. Source data are provided as a Source Data file.
Fig. 6
Fig. 6. SPINT1 inhibited HEPSIN-induced GLP1R cleavage and preserved GLP1R activity.
a Analysis of SPINT1, HEPSIN, and GLP1R interactions in human primary islet cells using proximity ligation assay (PLA). Human islet cells were incubated with three pairs of primary antibodies (anti-GLP1R and anti-SPINT1, anti-HEPSIN and anti-SPINT1, anti-GLP1R and anti-HEPSIN antibodies), with each antibody as a control. The interaction signals after PLA (red puncta) and insulin signals (green) were visualized using immunofluorescence microscopy. Nuclei were counterstained with DAPI (blue). Scale bar, 5 μm. b Quantitation of PLA signals in human islet cells. The numbers of red puncta in the insulin-positive area in (a) were counted and statistically calculated from three independent experiments, with three to eight cells counted for each independent experiment. c Western blot analysis of GLP1R in Glp1r-overexpressing NIT-1 cells with or without silencing of Spint1 or Hepsin. Glp1r-overexpressing NIT-1 cells were transfected with siSpint1, siHepsin, or both and then incubated with 35 μg/mL MG132 for 3 h. Cell lysates were then immunoblotted using anti-FLAG (GLP1R) and anti-HEPSIN antibodies. The ratios of cleaved to full-length (c/f) GLP1R band intensities from four independent experiments (n = 4), normalized to GAPDH and presented as the amount relative to MG132 treatment alone, were statistically analyzed (bottom panel). d Western blot analysis of GLP1R in Glp1r-overexpressing NIT-1 cells with overexpression of Spint1, Hepsin, or both. Glp1r-overexpressing NIT-1 cells were transfected with the indicated plasmids (Hepsin, Spint1, or both) and then incubated with 35 μg/mL MG132 for 3 h. Cell lysates were then subjected to immunoblot analysis using anti-FLAG (GLP1R), anti-SPINT1, and anti-MYC-tag (HEPSIN) antibodies. The ratios of cleaved to full-length (c/f) GLP1R band intensities from three independent experiments (n = 3), normalized to GAPDH and presented as the amount relative to MG132 treatment alone, were statistically analyzed (bottom panel). e Immunoblot analysis of SPINT1, HEPSIN, and GLP1R in Glp1r-overexpressing HEK293T cells with or without the plasmids encoding cDNA for Hepsin, protease-null Hepsin mutant (mt.) or Spint1. Cells were transiently transfected with the indicated plasmids (Glp1r, Hepsin, protease-null Hepsin mutant [S353A], and Spint1). Cell lysates were then collected and subjected to immunoblotting using anti-FLAG (GLP1R), anti-SPINT1, and anti-MYC-tag (HEPSIN) antibodies. GAPDH and α-tubulin were used as loading controls. f The histogram shows the quantitative GLP1R cleavage results from (e). The ratios of cleaved to full-length (c/f) GLP1R band intensities were statistically calculated from three independent experiments (n = 3) with normalization to GAPDH and presented as the relative values to that of Glp1r overexpression alone. gi Analysis of Spint1’s role in cellular cAMP levels in the islets from Spint1fl/fl and Spint1/− mice and in NIT-1 cells. All samples underwent treatment with 2.5 mM PAR2 antagonist to block background cAMP, followed by stimulation of 25 nM GLP1R agonist (Exendin-4, Ex4). Lysates were collected and subjected to cAMP level measurement using an ELISA kit. g NIT-1 cells were transiently transfected with siSpint1. Control cells were transfected with scramble siRNA. These results were statistically analyzed from three independent experiments (n = 3). h Mouse islets were collected from 8-week-old Spint1fl/fl and Spint1−/ mice (n = 5 per mouse group). i NIT-1 cells were transiently transfected with Spint1 plasmid and PLKO empty vector. These results were statistically analyzed from three independent experiments (n = 3). j Analysis of the roles of SPINT1 and HEPSIN in the GLP1R activity in HEK293T cells by measuring the production of cyclic AMP (cAMP). HEK293T cells were transiently transfected with plasmids containing the cDNA for Glp1r, Spint1, and Hepsin. These results were statistically analyzed from four independent experiments (n = 4). k Analysis of in vivo GLP1R function on stimulating insulin production in Spint1fl/fl and Spint1−/− mice after Ex4 treatment. Each mouse was intraperitoneally injected with 24 nmol/kg Ex4 for 30 min before an oral gavage of glucose (2 g/kg body weight). Blood samples were then collected and subjected to insulin measurement using ELISA. Control mice were injected with PBS (n = 4 per group). l Analysis of serum insulin levels normalized to β cell mass in Spint1fl/fl and Spint1−/− mice after Ex4 treatment. The Ex4-induced upregulation of insulin levels in each mouse in panel (k) was calculated as the insulin AUC (area under the curve) divided by their respective β cell mass. The connecting lines show the change in insulin levels for each mouse before and after Ex4 treatment (n = 4 per group). Statistical significance was determined using a one-way ANOVA with Tukey’s post hoc test for (c, d, f, j), a two-way ANOVA followed by Sidak’s multiple comparison analysis for (k), a two-tailed Student’s t-test for (b, g, h, i), and a two-tailed paired Student’s t-test for (l). For bar plots, bars are represented as mean ± SEM. In the box plots, the boxes span from the 25th to the 75th percentiles, with a line indicating the median. Whiskers extend to values within 1.5 times the interquartile range, defined as the difference between the 25th and 75th percentiles. *P < 0.05; ***P < 0.001; ****P < 0.0001. Below the asterisks are the precise statistical results. Source data are provided as a Source Data file.
Fig. 7
Fig. 7. Effect of Spint1 or Hepsin depletion on GLP1R signaling-induced phospho-CREB, Mafa, and Ins1 in β cells.
a Roles of Spint1 and Hepsin in Ex4-induced CREB phosphorylation and MAFA expression in NIT-1 cells. Cells were transfected with siSpint1 and siHepsin. Control cells were transfected with scramble siRNAs. After transfection, cells were starved for 24 h and then treated with or without 25 nM Ex4 or 25 nM Exendin 9–36 (Ex9–36, a GLP1R antagonist) for 24 h. Cell lysates were then collected and subjected to western blot analysis using anti-phospho-CREB, anti-CREB, and anti-MAFA antibodies. GAPDH served as a loading control. The ratios of phospho-CREB to total CREB levels (middle panel) and MAFA protein levels (right panel), normalized to GAPDH, were statistically analyzed across four independent experiments (n = 4). b Analysis of Spint1, Hepsin, Mafa, and Ins1 expression in NIT-1 cells silenced for Spint1, Hepsin, or both, with or without Ex4 treatment. Cells were transfected with siSpint1, siHepsin, or both. Controls were transfected with scramble siRNAs. Transfectants were serum-starved for 24 h and then treated with or without 25 nM Ex4 for another 24 h. RNA was then extracted and subjected to Q-RT-PCR analysis. Results were statistically analyzed by normalizing to Gapdh relative to the control from three independent experiments (n = 3). Statistical significance was determined using a two-tailed Student’s t-test for all panels. All data were represented as mean ± SEM. *P < 0.05; **P < 0.01; ***P < 0.001; ****P < 0.0001. Below the asterisks are the precise statistical results. Source data are provided as a Source Data file.
Fig. 8
Fig. 8. Schematic illustration of the mechanism for SPINT1-regulated insulin synthesis.
The serine protease inhibitor SPINT1 upholds MAFA-dependent insulin production by targeting the serine protease HEPSIN. Without SPINT1, overactivity of HEPSIN leads to proteolytic processing of its membrane substrate, such as GLP1R, suppressing the MAFA-insulin pathway in β cells. SPINT1 can inhibit HEPSIN’s activity in this regard, thereby augmenting MAFA-dependent insulin expression.

References

    1. Kirchhofer, D. et al. Tissue expression, protease specificity, and Kunitz domain functions of hepatocyte growth factor activator inhibitor-1B (HAI-1B), a new splice variant of HAI-1. J. Biol. Chem.278, 36341–36349 (2003). - PubMed
    1. Huang, H.-P. et al. Persistent elevation of hepatocyte growth factor activator inhibitors in cholangiopathies affects liver fibrosis and differentiation. Hepatology55, 161–72 (2012). - PubMed
    1. Antalis, T. M., Bugge, T. H. & Wu, Q. Membrane-anchored serine proteases in health and disease. Prog. Mol. Biol. Transl. Sci.99, 1–50 (2011). - PMC - PubMed
    1. Chambers, A. P. et al. The role of pancreatic preproglucagon in glucose homeostasis in mice. Cell Metab.25, 927–934.e923 (2017). - PMC - PubMed
    1. Song, Y. et al. Gut-proglucagon-derived peptides are essential for regulating glucose homeostasis in mice. Cell Metab.30, 976–986.e973 (2019). - PMC - PubMed

Publication types

MeSH terms

Associated data

LinkOut - more resources