

A systematic review of using population-level human mobility data to understand SARS-CoV-2 transmission
- PMID: 39627231
- PMCID: PMC11615209
- DOI: 10.1038/s41467-024-54895-7
A systematic review of using population-level human mobility data to understand SARS-CoV-2 transmission
Abstract
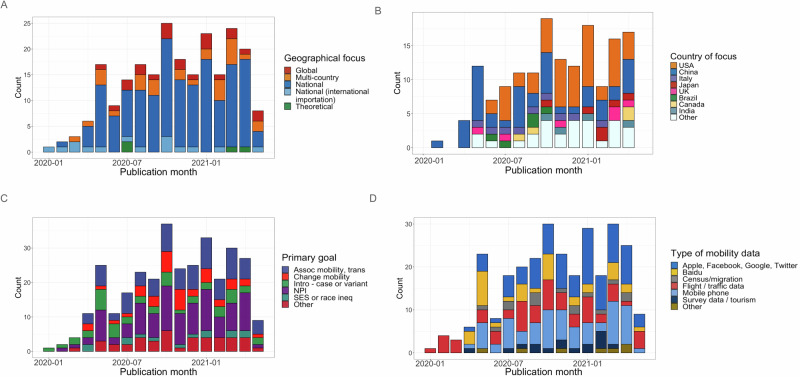
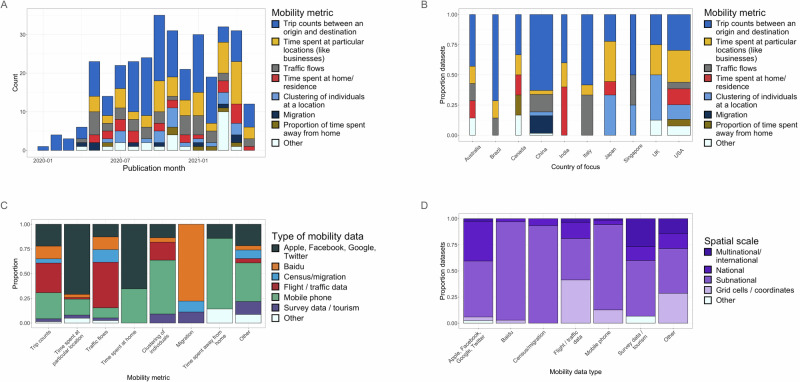
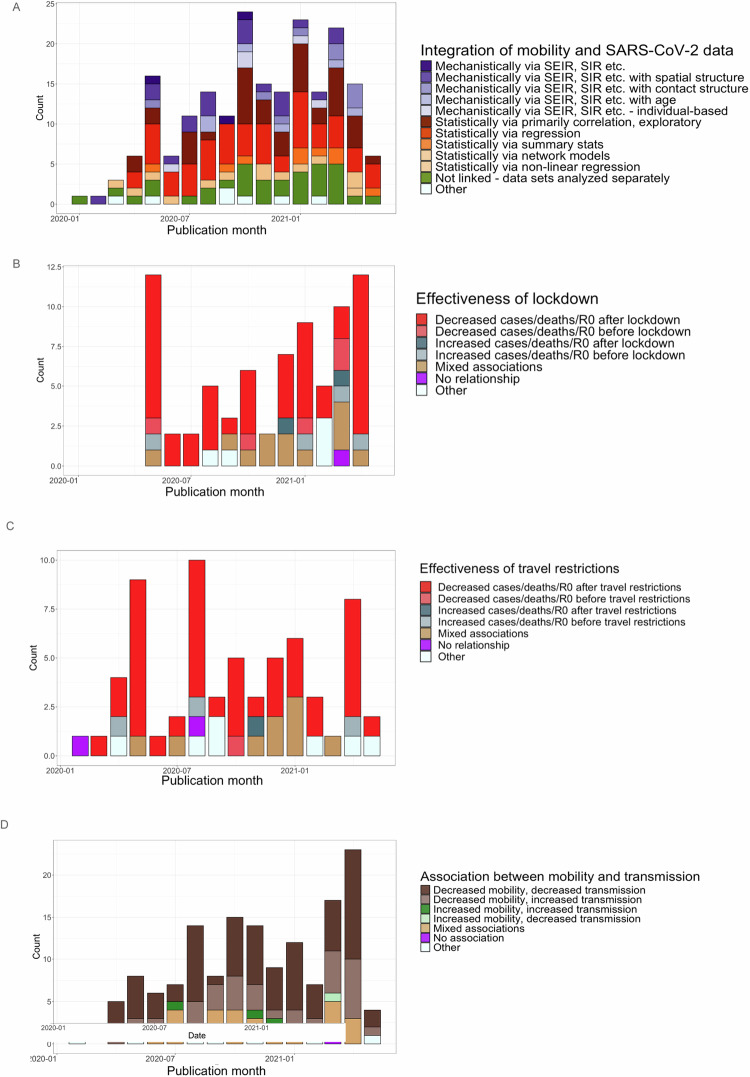
The emergence of SARS-CoV-2 into a highly susceptible global population was primarily driven by human mobility-induced introduction events. Especially in the early stages, understanding mobility was vital to mitigating the pandemic prior to widespread vaccine availability. We conducted a systematic review of studies published from January 1, 2020, to May 9, 2021, that used population-level human mobility data to understand SARS-CoV-2 transmission. Of the 5505 papers with abstracts screened, 232 were included in the analysis. These papers focused on a range of specific questions but were dominated by analyses focusing on the USA and China. The majority included mobile phone data, followed by Google Community Mobility Reports, and few included any adjustments to account for potential biases in population sampling processes. There was no clear relationship between methods used to integrate mobility and SARS-CoV-2 data and goals of analysis. When considering papers focused only on the estimation of the effective reproductive number within the US, there was no clear relationship identified between this measure and changes in mobility patterns. Our findings underscore the need for standardized, systematic ways to identify the source of mobility data, select an appropriate approach to using it in analysis, and reporting.
© 2024. The Author(s).
Conflict of interest statement
Competing interests: The authors declare no competing interests.
Figures
References
-
- Chen, W. et al. [Early containment strategies and core measures for prevention and control of novel coronavirus pneumonia in China]. Zhonghua Yu Fang Yi Xue Za Zhi54, 239–244 (2020). - PubMed
-
- Garcia, L. P. & Duarte, E. Nonpharmaceutical interventions for tackling the COVID-19 epidemic in Brazil. Epidemiol. Serv. Saude29, e2020222 (2020). - PubMed
Publication types
MeSH terms
Grants and funding
- 1015823.03/Burroughs Wellcome Fund (BWF)
- T32 AI165369/AI/NIAID NIH HHS/United States
- 1T32AI165369-01A1/U.S. Department of Health & Human Services | National Institutes of Health (NIH)
- 1R01AI160780-01/U.S. Department of Health & Human Services | National Institutes of Health (NIH)
- DP2 LM013102/LM/NLM NIH HHS/United States
LinkOut - more resources
Full Text Sources
Medical
Miscellaneous
