. 2024 Dec 3;15(1):10525.
doi: 10.1038/s41467-024-54894-8.

Biodegradable Janus sonozyme with continuous reactive oxygen species regulation for treating infected critical-sized bone defects

Affiliations

Biodegradable Janus sonozyme with continuous reactive oxygen species regulation for treating infected critical-sized bone defects

Zixuan Ou et al. Nat Commun. .

Abstract

Critical-sized bone defects are usually accompanied by bacterial infection leading to inflammation and bone nonunion. However, existing biodegradable materials lack long-term therapeutical effect because of their gradual degradation. Here, a degradable material with continuous ROS modulation is proposed, defined as a sonozyme due to its functions as a sonosensitizer and a nanoenzyme. Before degradation, the sonozyme can exert an effective sonodynamic antimicrobial effect through the dual active sites of MnN4 and Cu2O8. Furthermore, it can promote anti-inflammation by superoxide dismutase- and catalase-like activities. Following degradation, quercetin-metal chelation exhibits a sustaining antioxidant effect through ligand-metal charge transfer, while the released ions and quercetin also have great self-antimicrobial, osteogenic, and angiogenic effects. A rat model of infected cranial defects demonstrates the sonozyme can rapidly eliminate bacteria and promote bone regeneration. This work presents a promising approach to engineer biodegradable materials with long-time effects for infectious bone defects.


Conflict of interest statement

Competing interests: The authors declare no competing interests.

Figures

Fig. 1
Fig. 1. Schematic representation of the mechanism via which the Janus sonozyme treats infected critical-sized bone defects.
Before degradation, the sonozyme can exert an effective sonodynamic antimicrobial effect through the dual active sites of MnN4 and Cu2O8. Furthermore, it can promote anti-inflammation by superoxide dismutase- and catalase-like activities. Following degradation, quercetin-metal chelation exhibits a sustaining antioxidant effect through ligand-metal charge transfer, while the released ions and quercetin also have great self-antimicrobial, osteogenic, and angiogenic effects.
Fig. 2
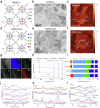
Fig. 2. Structural characterization of the nanosheets.
a The optimized structure for MON(Cu). b TEM images for MON(Cu) after probe sonication, scale bar: 200 nm, three independent experiments were repeated. c AFM image and corresponding height profiles of MON(Cu), scale bar: 500 nm, three independent experiments were repeated. d The optimized structure for MON(CuMn). e TEM image for MON(CuMn) after probe sonication, scale bar: 200 nm, three independent experiments were repeated. f AFM image and corresponding height profiles of MON(CuMn), scale bar: 500 nm, three independent experiments were repeated. g EDS mapping for MON(CuMn), scale bar: 600 nm, three independent experiments were repeated. h The total XPS spectra for MON(Mn), MON(Cu), MON(CuMn) and MON(CuMn)-Q. arb.units, arbitrary units. i The corresponding elementary composition of different nanosheets. XPS spectra for (j) N 1s, (k) Cu 2p and (l) Mn 2p. arb. units, arbitrary units; sat., satellite.
Fig. 3
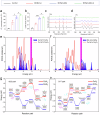
Fig. 3. Antioxidation performance and mechanism of nanosheets before degradation.
a The ·O2 scavenging ratio of MON(Cu), MON(CuMn) and MON(CuMn)-Q (p = 0.0269; p = 0.0446), n = 3 independent experiments per group, data are expressed as mean ± SD, *p < 0.05, two-tailed ANOVA. b the CAT-like activity of MON(Cu), MON(CuMn), and MON(CuMn)-Q (p = 0.0009; p = 0.1105), n = 3 independent experiments per group, data are expressed as mean ± SD, ***p < 0.001, ns not significant, two-tailed ANOVA. ESR spectra of (c) the Fenton reaction and (d) the XO + X reaction system for different nanosheets. arb.units, arbitrary units. e, f The PDOS of MON(Cu) and MON(CuMn)..PDOS, partial density of state. The theoretical calculation for (g) SOD and (h) CAT path of CuN4 and MnN4.
Fig. 4
Fig. 4. Antioxidation performance and mechanism of nanosheets after degradation.
a, b The Cu2+ release ratio curves of MON(Cu), MON(CuMn), and MON(CuMn)-Q at 37 °C in PBS for short-term release (24 h) and long-term release (28 days), respectively, n = 3 independent experiments per group, data are expressed as mean ± SD. c, d The Mn2+ release ratio curves of MON(CuMn) and MON(CuMn)-Q at 37 °C in PBS for short-term release (24 h) and long-term release (28 days), respectively, n = 3 independent experiments per group, data are expressed as mean ± SD. e the curves of fluorescence spectrophotometer for que-metal chelates in different molar ratio. ESR spectra of (f) the Fenton reaction and (g) the XO + X reaction system for que-metal chelates. arb.units, arbitrary units. h The surface charge distribution and Mulliken charge transfer for que and que-metal chelates.
Fig. 5
Fig. 5. Antibacterial performance and mechanism of nanosheets before and after degradation.
a ESR spectrum of 1O2 under US. arb.units, arbitrary units. b Bacterial growth curve after different treatments, n = 3 independent experiments per group, data are expressed as mean ± SD. CFU, colony-forming units. c The number of MRSA colonies of the Control, US, Van, MON(Cu)+US, MON(CuMn)+US, MON(CuMn)-Q + US groups (p = 0.6187; p = 0.8011; p < 0.0001; p < 0.0001; p < 0.0001), n = 3 independent experiments per group, data are expressed as mean ± SD, ****p < 0.0001, ns not significant, two-tailed ANOVA. CFU, colony-forming units. d Spread plate of MRSA colonies, three independent experiments were repeated. e SEM images of bacteria after different treatments. The morphology of bacteria is indicated by white arrows and marked in yellow colour, scale bar: 200 nm, three independent experiments were repeated. f Antibacterial mechanism.
Fig. 6
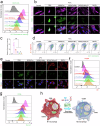
Fig. 6. In vitro ROS scavenging and immunomodulatory ability.
a FCM analysis of DCFH-DA. b Representative images of DCFH-DA staining in hBMSCs after different treatment, scale bar: 10 μm, three independent experiments were repeated. c Statistical result of DCFH-DA staining (p = 0.0009; p = 0.0009; p = 0.0004; p = 0.0004; p = 0.9208), n = 3 independent experiments per group, data are expressed as mean ± SD. ***p < 0.001, two-tailed ANOVA. d FCM result of JC-1. e IF result of polarization in THP1, scale bar: 10 μm, three independent experiments were repeated. f, g FCM analysis for polarization condition of THP1. h Graphic illustration of MON(CuMn)-Q in immunomodulatory ability.
Fig. 7
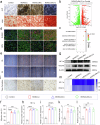
Fig. 7. In vitro osteogenesis and angiogenesis ability.
a ARS and ALP staining images of hBMSCs under different culture conditions: culture medium (denoted as Control), MON(Cu) containing medium (denoted as MON(Cu)), MON(CuMn) containing medium (denoted as MON(CuMn)) and MON(CuMn)-Q containing medium (denoted as MON(CuMn)-Q), scale bar: 200 μm, three independent experiments were repeated. b Volcano map of RNA-seq result (MON(CuMn)-Q vs Control). c GO analysis of up-regulated genes in MON(CuMn)-Q. d IF result of hBMSCs after 28 days of culture under different conditions, scale bar: 200 μm, three independent experiments were repeated. e, f Scratch test and statistic analysis of HUVECs (p < 0.0001; p = 0.0001; p = 0.0003), scale bar: 200 μm, n = 3 independent experiments per group, data are expressed as mean ± SD. ***p < 0.001, ****p < 0.0001, two-tailed ANOVA. gi WB and corresponding statistic analysis of HIF-1a (p < 0.0001; p < 0.0001; p < 0.0001) and VEGFA (p = 0.0002; p = 0.0001; p = 0.0006), n = 3 independent experiments per group, data are expressed as mean ± SD. ***p < 0.001, ****p < 0.0001, two-tailed ANOVA. jl Tube formation and statistic analysis of relative tube length (p = 0.0037; p = 0.0033; p = 0.0039) and relative junction number (p = 0.0009; p = 0.0042; p = 0.0042), scale bar: 200 μm, n = 3 independent experiments per group, data are expressed as mean ± SD. **p < 0.01, ***p < 0.001, two-tailed ANOVA. m qRT-PCR results of HIF-1a and VEGFA in HUVECs after different treatments, n = 3 independent experiments per group.
Fig. 8
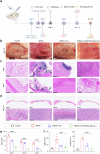
Fig. 8. In vivo antibacterial performance in infectious cranial defects.
a The flow chart of animal experiment (Created in BioRender. Zixuan, O. (2024) https://BioRender.com/z84t695). b Photographs of wound appearance in rats on day 14 after treatment, scale bar: 1 cm, five independent experiments were repeated. c Gram staining of tissue slices on day 1 and day 7 after treatment. MRSA is indicated by yellow arrows, scale bar: 100 μm, five independent experiments were repeated. d H&E result of tissue slices on 14 day after treatment. Inflammatory cells are indicated by yellow arrows, scale bar: 2.5 mm, five independent experiments were repeated. e CFU counts of MRSA in infected tissue homogenate (p < 0.0001; p < 0.0001; p < 0.0001), n = 5 independent experiments per group, data are expressed as mean ± SD. ****p < 0.0001, two-tailed ANOVA. CFU, colony-forming units. f Blood routine examination of rats after 14 days (p = 0.0009; p < 0.0001), n = 5 independent experiments per group, data are expressed as mean ± SD. ***p < 0.001, ****p < 0.0001, two-tailed ANOVA. WBC, white blood cell count. GRAN, granulocyte count.
Fig. 9
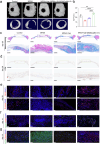
Fig. 9. In vivo osteogenic, angiogenic and immune regulation performance in infectious cranial defects.
a Micro-CT analysis and reconstruction results, scale bar: 2 cm, five independent experiments were repeated. b BV/TV analysis (p = 0.0028; p < 0.0001; p < 0.0001), n = 5 independent experiments per group, data are expressed as mean ± SD. **p < 0.01, ****p < 0.0001, two-tailed ANOVA. c Masson’s trichrome staining images. The black box shows the defective area. Scale bar: 2.5 mm (above figures); Scale bar: 500 μm (below figures), five independent experiments were repeated. d IHC results of OPN. The yellow box shows the defective area. Scale bar: 2.5 mm (above figures); Scale bar: 250 μm (below figures), five independent experiments were repeated. e IF results of OPN and RUNX2, scale bar: 50 μm, five independent experiments were repeated. f IF results of VEGFA and CD31, scale bar: 50 μm, five independent experiments were repeated. g IF results of iNOS and CD206, scale bar: 50 μm, five independent experiments were repeated.

References

    1. Pearson, J. J. et al. In vivo hydroxyapatite scaffold performance in infected bone defects. J. Biomed. Mater. Res. B Appl. Biomater.108, 1157–1166 (2020). - PubMed
    1. Luo, Z. et al. Enhanced bacterial cuproptosis-like death via reversal of hypoxia microenvironment for biofilm infection treatment. Adv. Sci.11, e2308850 (2024). - PMC - PubMed
    1. Lei, C. et al. Heterostructured piezocatalytic nanoparticles with enhanced ultrasound response for efficient repair of infectious bone defects. Acta Biomater.172, 343–354 (2023). - PubMed
    1. Lei, J. et al. Sulfur-regulated defect engineering for enhanced ultrasonic piezocatalytic therapy of bacteria-infected bone defects. Chem. Eng. J.435, 14 (2022).
    1. Feng, X. et al. Piezo-augmented sonosensitizer with strong ultrasound-propelling ability for efficient treatment of osteomyelitis. ACS Nano16, 2546–2557 (2022). - PubMed

Publication types

Associated data