. 2024 Dec;56(12):2739-2752.
doi: 10.1038/s41588-024-02019-8. Epub 2024 Dec 3.

Single-cell RNA sequencing of peripheral blood links cell-type-specific regulation of splicing to autoimmune and inflammatory diseases

Collaborators, Affiliations

Single-cell RNA sequencing of peripheral blood links cell-type-specific regulation of splicing to autoimmune and inflammatory diseases

Chi Tian et al. Nat Genet. 2024 Dec.

Abstract

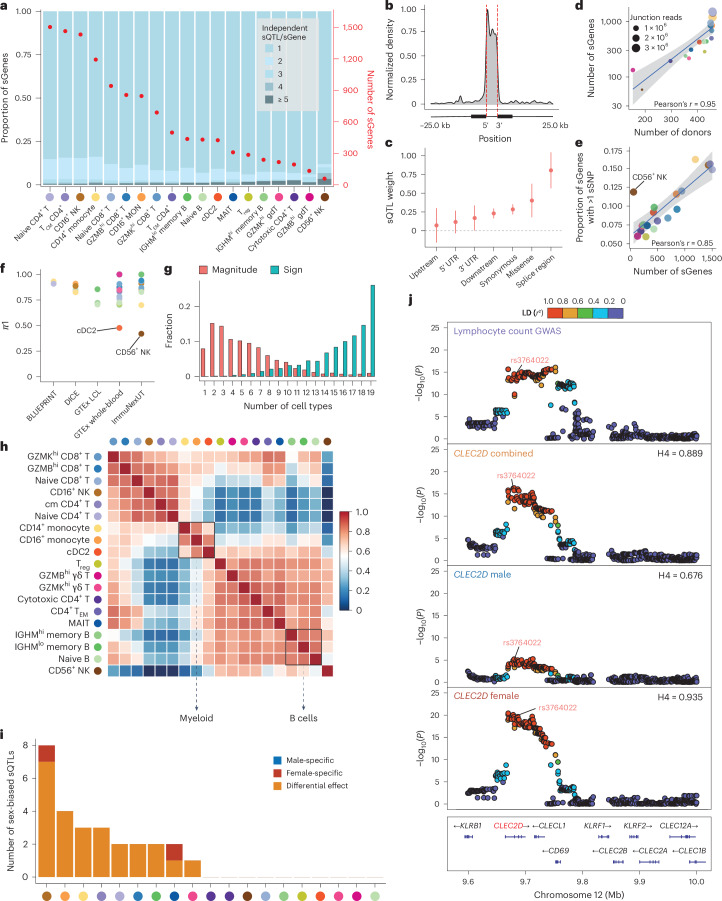
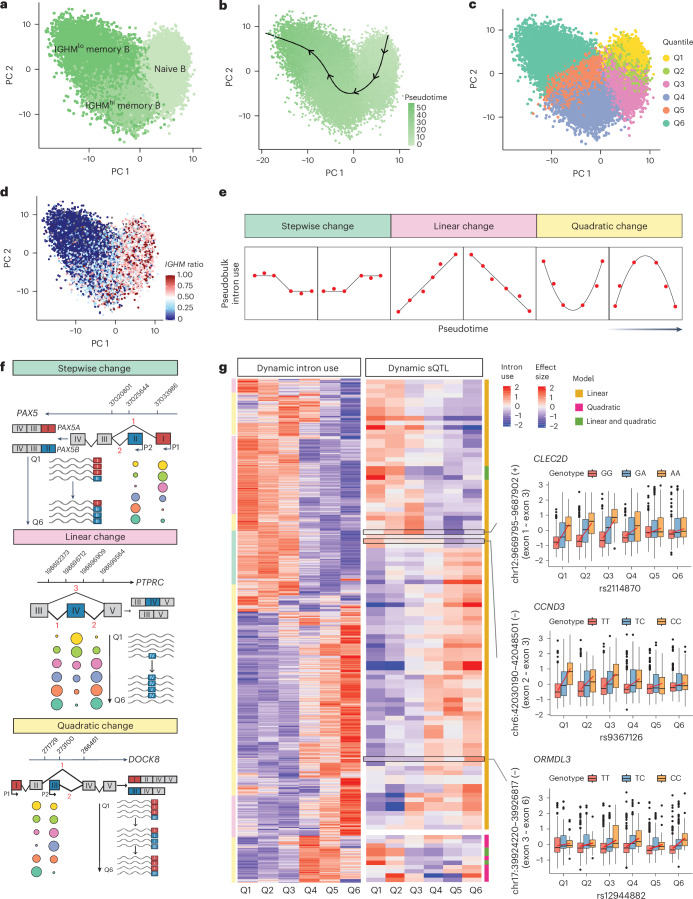
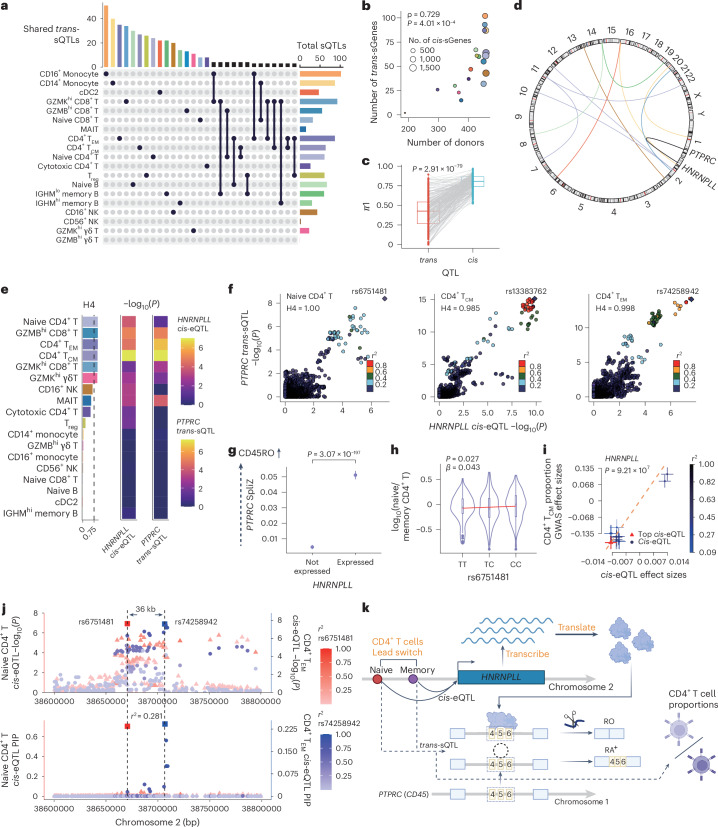
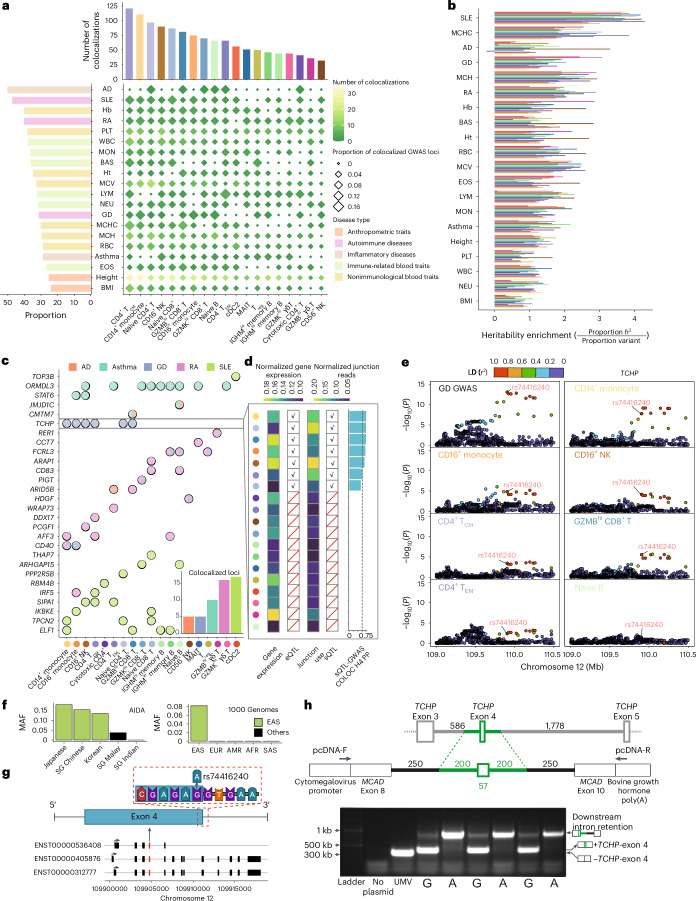
Alternative splicing contributes to complex traits, but whether this differs in trait-relevant cell types across diverse genetic ancestries is unclear. Here we describe cell-type-specific, sex-biased and ancestry-biased alternative splicing in ~1 M peripheral blood mononuclear cells from 474 healthy donors from the Asian Immune Diversity Atlas. We identify widespread sex-biased and ancestry-biased differential splicing, most of which is cell-type-specific. We identify 11,577 independent cis-splicing quantitative trait loci (sQTLs), 607 trans-sGenes and 107 dynamic sQTLs. Colocalization between cis-eQTLs and trans-sQTLs revealed a cell-type-specific regulatory relationship between HNRNPLL and PTPRC. We observed an enrichment of cis-sQTL effects in autoimmune and inflammatory disease heritability. Specifically, we functionally validated an Asian-specific sQTL disrupting the 5' splice site of TCHP exon 4 that putatively modulates the risk of Graves' disease in East Asian populations. Our work highlights the impact of ancestral diversity on splicing and provides a roadmap to dissect its role in complex diseases at single-cell resolution.


Conflict of interest statement

Competing interests: X.J. is an employee of BGI Research. Y. Tong is undertaking a PhD scholarship partially supported by BGI Research. The other authors declare no competing interests.

Figures

Fig. 1
Fig. 1. Population-scale 5′ scRNA-seq identified 21 cell types and thousands of alternatively spliced genes per cell type.
a, The AIDA cohort and study design. b, Profile plot and heatmap showing that read 1 of 5′ scRNA-seq was biased toward the transcription start site and read 2 was spread more evenly across the gene body. c, The base coverage rate per gene increased with the read count (fraction of base coverage = covered bases/all bases). Left, box plot showing the fraction of base coverage across different read count bins (n = 4,034, 4,114, 4,803, 4,883 and 491, from left to right). Outliers are not shown. Right, box plot showing that a median of 85.3% of exonic bases (red line) are covered across all expressed genes. d, Replication of LeafCutter intron discoveries in GENCODE, PacBio MAS-seq and Snaptron. Top, 59.3% of LeafCutter discoveries were annotated in GENCODE and 85.9% replicated in PacBio long-read sequencing from four individuals. Bottom, close to 93% of detected splice junctions appeared in more than 1,000 samples, 98.8% in more than 100 and 99.5% in more than ten. e, We examined 21 distinct PBMC subtypes with sufficient cell counts. Cell types are colored according to their hematopoietic lineage. The numbers below the cell type labels indicate the sample size for differential splicing analysis and sQTL calling. f, Number of alternatively spliced genes detected per cell across 21 cell types at the single-cell level (see Supplementary Table 1 for the number of cells used (n)). The red diamonds indicate the average number of detected genes (NODGs) per cell. The dashed blue line indicates the number of AS genes detected using the OneK1K dataset. g, NODGs positively correlated with the number of AS genes. Linear regression lines (black) are shown for AIDA and OneK1K, respectively. h, Number of detected AS genes per pseudobulk cell type (see Supplementary Table 1 for the number of cells used (n)). i, Number of detected AS genes scaled with the number of cells in a pseudobulk, plateauing at ~11,500 genes. A sigmoid curve was fitted to the data and plotted. cDC, conventional dendritic cell; GZMB, granzyme B; GZMK, granzyme K; IGHM, immunoglobulin heavy constant Mu; pDC, plasmacytoid dendritic cell; RPKM, reads per kilobase of transcript per million mapped reads; TES, transcription end site; TSS, transcription start site.
Fig. 2
Fig. 2. Cell-type-dependent and context-dependent AS.
a, Hierarchical clustering of single-cell and pseudobulk quantification of AS recapitulated well-known hematopoietic lineages. The heatmap shows the Spearman’s rank correlation coefficient. Within the T and NK cluster, two subclusters demarcated cytotoxic and noncytotoxic cell types. The cytotoxic cellular cluster contained CD4+ T cytotoxic, mucosal-associated invariant (MAIT), γδ T, NK and CD8+ T (GZMKhi and GZMBhi) cells, whereas CD4+ T cell (naive, TCM and TEM), regulatory T (Treg) cells and CD8+ T naive cells fell within the noncytotoxic cluster. b,c, Alternative intron use of PTPRC and CD44 reflected isoform-specific roles in T cell development. In b, the mRNA encoding the CD45RO isoform (red) was the lowest in naive T cells and was more abundant in activated and memory T cells. This trend was reversed for the mRNA encoding the CD45RA+ isoforms. log-transformed splicing ratio = log2(CD45RX/CD45RO), where RX indicates any isoforms other than RO. For CD45RO, log-transformed splicing ratio = log2(CD45RO/ΣCD45RX). In c, the standard CD44 (CD44s) isoform (red) was highest in naive T cells and was less abundant in activated and memory T cells. d, Discovery and sharing of sex-biased differentially spliced genes (DSGs) (FDR < 0.05). e, The sex-biased isoform expression of FLNA was cell-type-specific. The ENST00000498491 isoform (red boxes) exhibited strong female bias in T cells but not in B cells. f, Ancestry-biased DSGs discovered through pairwise comparisons across Eastern, Southeastern and South Asian individuals. Left, relative contributions of the three pairwise comparisons to the total number of DSGs in each cell type. Right, total number of DSGs across all cell types. g, Allele frequency difference in rs11064437 led to ancestry-biased isoform use of SPSB2 in CD8+ T GZMBhi. rs11064437 disrupted the canonical splice site, thereby promoting use of the new splice site. Black, annotated canonical intron; red, new intron missing from GENCODE. Inset, MAF of rs11064437 decreased from Eastern to Southeastern to South Asian individuals.
Fig. 3
Fig. 3. Single-cell sQTL analysis revealed cell-type-specific and sex-biased regulation of splicing.
a, Numbers of sGenes (red dots) and proportions of sGenes (stacked bars) with various numbers of independent sQTLs across 19 cell types (adjusted beta-approximated P < 0.05). b, cis-sVariants preferentially located near splice junctions and in the affected introns. c, A Bayesian hierarchical model revealed that sVariants were enriched in the splice region and as missense and synonymous variants. The dot plot shows the mean ± s.e.m. of functional annotations (n of sVariants = 11,577). d, Number of sGenes scaled with the number of donors and junction read count across 19 cell types. The shaded area on either side of the linear regression line represents the 95% CI. e, The proportion of sGenes with more than one independent sVariant increased with the power of sGene discovery across 19 cell types. The shaded area on either side of the linear regression line represents the 95% CI. f, AIDA cis-sQTLs were well replicated in BLUEPRINT, DICE, GTEx LCL, GTEx whole-blood and ImmuNexUT. Each dot represents one cell type from AIDA, colored as in a. g, Fractions of lead cis-sQTLs shared according to sign and magnitude in one or more cell types. Sharing according to sign was defined as a cis-sQTL sharing the same sign with the top cis-sQTL across 19 cell types. Sharing according to magnitude was defined as the effect size of a cis-sQTL being within a factor of two of the top cis-sQTLs across 19 cell types. h, Pairwise sQTL sharing according to magnitude across 19 cell types. A total of 2,488 sQTLs that were significant (linear feedback shift register (LFSR) < 0.05) in at least one cell type were considered to avoid random noise in association testing. i, Number of sex-biased sQTLs discovered in 19 cell types (FDR < 0.05). Cell type coloring as in a. j, CLEC2D sQTLs in CD4+ TEM cells colocalized with the GWAS of lymphocyte count. This colocalization was primarily driven by a female-biased sQTL. The sQTL lead variant rs3764022 was an exonic variant located in the splice region of CLEC2D exon 2. The unadjusted two-sided P value was calculated using QTLtools. Source data
Fig. 4
Fig. 4. Dynamic intron use and sQTLs identified through B cell development.
a, Principal component (PC) projections of single-cell gene expression for naive, IGHMhi memory and IGHMlo memory B cells. b, Pseudotime projection of 52,964 B cells. The direction of the curve and the intensity of the green color indicate the dynamic process of B cell maturation from naive to IGHMhi memory and to IGHMlo memory B cells. c, B cells were partitioned into six quantiles according to pseudotime values. d, Dynamic expression of IGHM during cellular development agreed with B cell class switch recombination from producing IgM to other isotypes. IGHM ratio: IGHM expression level/(IGHM + IGHG1 + IGHG2 + IGHG3 + IGHG4 + IGHA1 + IGHA2 + IGHD + IGHE) expression level. e, Three distinct patterns were identified for pseudotime-dependent intron use: stepwise, linear and quadratic. f, Dynamic intron use across six quantiles of B cell development. Three example genes with different dynamic intron use patterns (top, stepwise change in PAX5; middle, linear change in PTPRC; bottom, quadratic change in DOCK8). The dot color corresponds to the six quantiles in c and the dot size reflects the mean intron usage in that quantile. g, Left, heatmap of scaled mean intron use across pseudotime, with the color bar corresponding to the three dynamic intron use patterns in e. sVariant–intron pairs with significant interaction effects with B cell pseudotime are shown. Both linear (genotype × time) and quadratic (genotype × time2) models were used to assess the interaction between genetic and pseudotime quantiles. Middle, scaled effect size estimates of sVariant–intron pairs. Right, three example genes (CLEC2D, CCND3, ORMDL3) with dynamic effect sizes across pseudotime. The samples sizes for each quantile are: Q1 (n = 419), Q2 (n = 425), Q3 (n = 427), Q4 (n = 450), Q5 (n = 448) and Q6 (n = 449).
Fig. 5
Fig. 5. trans-sQTL analysis revealed a regulatory relationship between HNRNPLL and PTPRC.
a, Upset plot showing discovery and sharing of trans-sQTLs across cell types. Right, the bar plot shows the number of trans-sQTLs per cell type. Top, the bar plot shows the number of trans-sQTLs in each category. The x axis is truncated at a minimum of five sQTLs. b, The number of trans-sGenes scaled with the number of donors. The two-sided P value was calculated using Spearman’s rank correlation. c, Box plot of the π1 statistics for cis-sQTLs and trans-sQTLs. The P value was calculated using a two-sided paired t-test (n = 251 for trans-sQTLs; n = 251 for cis-sQTLs). d, Circos plot revealing the cis-regulatory effects (cis-eQTLs) underlying trans-sQTLs (links colored according to cell type as in a). A link is black if a colocalization event occurred in multiple cell types. e, Bar plot and heatmaps showing the colocalization probability (COLOC PP: H4) between HNRNPLL cis-eQTL and PTPRC trans-sQTL and QTL P values. In e,f,j, Unadjusted P values were obtained using Matrix eQTL (cis-eQTL) and QTLtools (trans-sQTL). f, LocusCompare plots showing the colocalization between HNRNPLL cis-eQTL and PTPRC trans-sQTL in CD4+ T (naive, TCM and TEM) cells. g, Higher SpliZ scores (representing more isoforms with longer intron length) were observed in single cells with greater HNRNPLL expression. The dot plot shows the mean and 95% CI. The P value was calculated using a two-sided t-test (n = 214,504 for ‘not expressed’; n = 53,064 for ‘expressed’). h, Violin and box plots showing that rs6751481 was associated with the ratio between naive and memory CD4+ T cells across AIDA donors. The P value and β were determined using linear regression (red line; n = 96 for TT; n = 217 for TC; n = 114 for CC). i, SMR revealed strong pleiotropy between HNRNPLL cis-eQTLs and GWAS on activated T cell proportion. The P value was obtained using SMR (n = 3579 for all the input variants). The SMR effect plot shows the mean ± s.e.m. of the variant effects. j, LocusZoom plot showing that naive and CD4+ TEM cells harbored two independent lead SNPs for HNRNPLL cis-eQTLs (square: lead SNPs for naive and CD4+ TEM cells; triangle: remaining SNPs for naive CD4+ T cells; circle: remaining SNPs for CD4+ TEM cells). Bottom, SuSiE posterior inclusion probability (PIP). The LD between rs6751481 and rs74258942 was modest (r2 = 0.28). k, Schematic showing the proposed regulatory relationship between HNRNPLL cis-eQTLs and PTPRC trans-sQTLs. Source data
Fig. 6
Fig. 6. Aberrant splicing mediates complex diseases.
a, Cell-type-specific colocalization between cis-sQTLs from 19 cell types and 20 complex traits. b, Heritability enrichment (proportion h2/proportion variant) for 20 traits mediated by cis-sQTLs from 19 cell types. Autoimmune and inflammatory diseases are highlighted in bold. c, Colocalization for 28 example sGenes across 19 cell types in the five disease traits. The color of each circle indicates the associated diseases. The inset shows the total number of colocalized loci across the five diseases. d, Gene expression, eQTLs, junction reads, sQTLs and H4 posterior probability (sQTL-GWAS colocalization) for TCHP across 19 cell types. High junction use between exons 4 and 5 led to sQTL and sQTL-GWAS colocalization. e, Cell-type-specific colocalization of GD GWAS and TCHP sQTLs in seven cell types. rs74416240 was the lead GWAS risk variant. The unadjusted, two-sided P value was calculated using QTLtools. f, MAF of rs74416240 in five AIDA populations and five major populations in the 1000 Genomes Project showed an East Asian bias of the rs74416240 minor allele. g, Gene model of TCHP with three isoforms. rs74416240 was located in the 5′ splice site of the intron junction between exons 4 and 5. h, Minigene experiment to validate the effect of rs74416240 on TCHP exon 4 splicing in K562 cells. The universal minigene vector (UMV) backbone alone corresponded to the band with the smallest molecular weight on the gel image. The test region, containing the 57-nt long exon 4 plus the 200-bp flanking sequences, was cloned into the UMV. Two identical minigene constructs with one nucleotide difference at rs74416240 (reference = G; alternative = A) were transfected into K562 cells. The reference allele (G) predominantly led to the normal isoform; the alternative allele (A) led to intron retention. BAS, basophil count; BMI, body mass index; EOS, eosinophil; Hb, hemoglobin; Ht, hematocrit; MCH, mean corpuscular Hb; LYM, lymphocyte; MCHC, MCH concentration; MCV, mean corpuscular volume; MON, monocyte count; NEU, neutrophil; PLT, platelet count; RBC, red blood cell; WBC, white blood cell count. Source data
Extended Data Fig. 1
Extended Data Fig. 1. Overview of the AIDA dataset.
(a) PC1 and PC2 of AIDA and 1000 Genomes individuals. East Asian individuals from AIDA (Singaporean Chinese, Japanese, Korean) overlapped with the 1000 Genomes EAS individuals. South Asian individuals from AIDA (Singaporean Indian) overlapped with the 1000 Genomes SAS individuals. Southeast (Singaporean Malay) individuals form a continuum between EAS and SAS individuals from 1000 Genomes. (b) The number of single cells across ancestry groups averaged 1,959 cells per donor. The red line shows the mean across all individuals. (c) UMAP of 21 PBMC subtypes in AIDA Data Freeze v1, colored by cell types. (d) The total number of reads per cell, grouped by cell types. The cell number (N) in (d) and (e): cDC2 (N = 197), CD16+ Monocyte (N = 508), Naive CD8 + T (N = 699), cm CD4 + T (N = 1026), IGHMhi memory B (N = 263), Naive CD4 + T (N = 1976), em CD4 + T (N = 333), atypical B (N = 143), pDC (N = 210), GZMKhi CD8 + T (N = 343), IGHMlo memory B (N = 423), Treg (N = 314), Naive B (N = 513), GZMKhi gdT (N = 199), MAIT (N = 426), GZMBhi CD8 + T (N = 809), CD16 + NK (N = 1244), cyt CD4 + T (N = 638), CD14+ Monocyte (N = 3145), CD56 + NK (N = 157), GZMBhi gdT (N = 437). The red line shows the mean across all cell types. The box plots show median and IQR, and whiskers are 1.5-fold IQR. (e) The total number of splice junction reads per cell, grouped by cell types. The red line shows the mean across all cell types. The box plots show median and IQR, and whiskers are 1.5-fold IQR. (f) We ranked and divided all donor libraries into ten quantiles according to library size and randomly selected one individual from each quantile. These donors are labeled as Q1-Q10, and the number of genes (N) for each bin and each donor is shown above each box plot. The box plots show median and IQR, and whiskers are 1.5-fold IQR. We observed base coverage across genes increased with read count for all ten quantiles. Fraction of base coverage = covered bases / all bases.
Extended Data Fig. 2
Extended Data Fig. 2. Quality control of splice junctions.
(a) Canonical introns had a significantly lower Gini index than novel introns, indicating that the expression levels of canonical introns were more homogeneous across cell types. P value was calculated using t-test (two-sided, Nnovel = 53,653, Ncanonical = 59,400). The boxes show median and IQR, and whiskers are 1.5-fold IQR. (b) Replication of LeafCutter junction discoveries in PacBio MAS-seq long-read dataset. The proportion of replicated junctions increased with the number of PacBio MAS-seq libraries. (c) Replication of LeafCutter junction discoveries in GENCODE and Snaptron. The number of replicated introns increased as we relaxed the threshold for Snaptron. (d) Position-weight matrices for canonical splice sites and novel splice sites. Both canonical and novel splice sites were highly enriched for canonical splice site motifs. JSD value refers to the Jensen-Shannon divergence value: positive JSD values imply that the given base is more prevalent in canonical splice sites’ Position Probability Matrix (PPM) compared to novel splice sites’ PPM. Canonical and novel splice sites were assigned based on whether they appeared in GENCODE.
Extended Data Fig. 3
Extended Data Fig. 3. Context-dependent differentially spliced genes.
(a) Hierarchical clustering of pseudobulk quantification of alternative splicing. Hierarchical clustering revealed four distinct clusters: myeloid cells, B cells, non-cytotoxic T cells, cytotoxic T / NK cells. The heatmap shows Spearman’s rank correlation coefficient. (b) Cell-type-specific differential splicing analysis identified female-biased expression of the isoform ENST00000498491 (highlighted in red) in GZMKhi γδ T, MAIT, GZMKhi CD8+ T, Treg, CD4+ (em and cm), and CD16+ NK cells. (c) Minor allele frequency (MAF) of rs11064437 in 1000 Genome populations. MAF of rs11064437 is higher in African and East Asians than in other populations.
Extended Data Fig. 4
Extended Data Fig. 4. sQTL power, sharing, and sex-biases.
(a) The inverse relationship between the mean absolute effect size of cis-sQTLs (y-axis) and the number of donors (x-axis) across 19 cell types (Pearson’s r = -0.95). Each black dot represents one cell type. The dark blue line represents the fitted linear regression model, and the grey shadow represents the 95% confidence interval in the linear regression. (b) The positive relationship between the number of sGenes and the total junction read counts across 19 cell types (Pearson’s r = 0.96). Each black point represents one cell type. The shaded area represents 95% confidence interval. (c) Fractions of cell-type-specific sQTLs detected by mashr using a threshold of LFSR < 0.05 shared by various numbers of cell types. LFSR = local false sign rate. (d) An example of single-sex sQTLs (rs930090 modulated TECR intron chr19:14529711-14562525; N = 459). The allelic effect in CD16+ NK was only significant in females but not males. (e) An example of sex-differential sQTLs (rs17713729 modulated SH3YL1 intron chr2: 253115-264782; N = 459). The allelic effect in cm CD4+ T was significant in both males and females but larger in males than in females. (f) An example of Malay-specific sQTLs (rs492083 modulated ATP5MPL intron chr14: 103914633-103915066; N = 456). The allelic effect in CD16+ Monocyte was significant in Malay but not significant in East Asian. (g) An example of Indian-specific sQTLs (rs6576010 modulated POLB intron chr8: 42338685-42344953; N = 458). The allelic effect in Naive CD4+ T was significant in Indian but not significant in East Asian. Note: The box plots show median and interquartile range (IQR), and whiskers are 1.5-fold IQR in (d), (e), (f) and (g). Unadjusted two-sided P value was calculated by QTLtools in (d), (e), (f) and (g). Red lines in (d), (e), (f) and (g) indicate significant linear relationship between intron usage and genotype.
Extended Data Fig. 5
Extended Data Fig. 5. sQTL replication.
The results of AIDA cis-sQTLs were replicated in BLUEPRINT (a), DICE (b), ImmuNexUT (c), GTEx whole blood (d), and GTEx lymphoblastoid cell lines (e). The proportions of replicated sQTLs were used to quantify the replication of independent cis-sQTLs in BLUEPRINT (BP), DICE, GTEx and ImmuNexUT for all matched cell types. Replicated sQTLs mean the AIDA independent cis-sQTLs with summary statistics available in BP, DICE, and GTEx and are significant with FDR < 0.05. Each bar plot represents the replicated sQTLs’ proportions in all the cis-sQTLs which have summary statistics in corresponding databases.
Extended Data Fig. 6
Extended Data Fig. 6. Examples of cell-type-specific sQTLs in known SLE risk genes.
A total of 30 cell-type-specific cis-sQTLs affecting known risk genes in Systemic Lupus Erythematosus. The alternate allele of the lead SNP rs147291617 upregulated an intron junction (chr17:36103981-36104528) of CCL4 in a cell-type-specific fashion. Dark blue blocks in the left panel indicates the existence of cis-sQTL. Red lines in violin plots in the right panel indicate the significant linear relationships between the junction ratios of chr17:36103981-36104528 and the genotype of rs147291617 in CD16+ Monocyte, CD16 + NK, cyt CD4 + T, em CD4 + T, GZMBhi CD8 + T, GZMKhi CD8 + T, MAIT, GZMKhi gdT and GZMBhi gdT. The lack of red lines in the violin plot of CD14+ Monocyte, IGHMhi memory B, and IGHMlo memory B indicates no significant relationship between the junction ratios of the intron and the genotype of rs147291617. The box plots show median and interquartile range (IQR), and whiskers and 1.5-fold IQR.
Extended Data Fig. 7
Extended Data Fig. 7. Examples of dynamic intron usage.
Boxplot of dynamic intron usage change of PAX5, PTPRC, and DOCK8. Each data point within the boxplot corresponds to the intron usage measurement of an individual, and these points are organized into six different quantiles. The box plots show median and interquartile range (IQR), and whiskers are 1.5-fold IQR. The samples sizes N for each quantile are: Q1(N = 4190), Q2(N = 4250), Q3(N = 427), Q4(N = 450), Q5(N = 448), Q6(N = 449). To enhance clarity, the bars in the boxplot are color-coded to represent various quantiles. The curve displayed within each bar plot provides insight into the three patterns (step-wise change, linear change, and quadratic change) of intron usage changes from the first quantile (Q1) to the sixth quantile (Q6), offering a visual representation of how intron usage varies across these quantiles. Red dot shows the median intron usage of each quantile.
Extended Data Fig. 8
Extended Data Fig. 8. Examples of dynamic sQTLs colocalization results.
(a) The first dynamic sQTL example involves rs6936285. rs6936285 shows a decreased effect on CD83 splicing during the B cell maturation and is highly colocalized with RA in naïve B cells. Unadjusted two-sided P value was calculated by QTLtools (right panel). Red lines in box plots indicate the effect trend of genotype on intron usage. (b) The second dynamic sQTL example of rs16971619, which inserts increased effect on BCL2A1 splicing. It is found to be colocalized with lymphocyte count. The box plots show median and interquartile range (IQR), and whiskers are 1.5-fold IQR. The samples sizes N for each quantile are: Q1(N = 419), Q2(N = 425), Q3(N = 427), Q4(N = 450), Q5(N = 448), Q6(N = 449). Unadjusted two-sided P value was calculated by QTLtools (right panel). Red lines in box plots indicate the effect trend of genotype on intron usage.
Extended Data Fig. 9
Extended Data Fig. 9. Trans-sQTL analysis revealed a regulatory relationship between hnRNPLL and PTPRC.
(a) Colocalization between hnRNPLL cis-eQTL and PTPRC trans-sQTL. We identified colocalization (H4 > 0.75) in GZMBhi CD8+ T, GZMKhi CD8+ T, and GZMKhi γδ T cells. Unadjusted two-sided P values were obtained using Matrix eQTL (eQTL) and QTLtools (sQTL). (b) Violin plot showing the cell-type-specific effect of hnRNPLL cis-eQTL and PTPRC trans-sQTL. The minor allele of rs6751481 leads to a lower expression of hnRNPLL (upper panel) and a lower expression of CD45RO isoform (lower panel). Unadjusted two-sided P values were obtained using Matrix eQTL (upper) and QTLtools (lower). The number of donors for each genotype is shown under each violin plot. The box plots show median and IQR, and whiskers are 1.5-fold IQR. Red lines indicate significant linear relationship between intron usage and genotype.
Extended Data Fig. 10
Extended Data Fig. 10. Aberrant splicing mediated complex autoimmune.
(a) Correlation between GWAS sample size (x-axis) and proportion of colocalized loci (y-axis). A low correlation (Pearson’s r = -0.17) was observed between the proportion of colocalization events and GWAS sample size across 20 traits. Each black dot in the panel represents a trait. The dark blue line indicates the linear relationship between the proportion of colocalized loci and GWAS sample size. The shaded area on either side of regression line represents 95% confidence interval. (b) H4 posterior probability of IRF5 in five cell types. H4 posterior probability measures the association level between cis-sQTLs and SLE GWAS. H4 > 0.75 was used as the threshold for the colocalization. (c) Cell-type-specific colocalization results of IRF5 in SLE GWAS. IRF5 sQTL colocalized with SLE GWAS in cm CD4+ T but not in IGHMhi memory B, Naïve CD8 + T, cyt CD4 + T and GZMBhi CD8+ T. Unadjusted two-sided P value was calculated by QTLtools. (d) Schematic to show how causal SNP rs2004640 disrupts the 5′ splice site of exon 1B, leading to nonsense-mediated decay (NMD) and downregulation of IRF5 expression. (e) Absolute heritability for 20 traits mediated by cis-sQTLs from 19 cell types. (f) The ratio between Heritability enrichment for 20 traits mediated by cis-sQTLs from 19 cell types and Heritability enrichment for 20 traits mediated by cis-sQTLs in GTEx whole blood. Red dash line represents the ratio equals to 1.

References

    1. Buniello, A. et al. The NHGRI-EBI GWAS Catalog of published genome-wide association studies, targeted arrays and summary statistics 2019. Nucleic Acids Res.47, D1005–D1012 (2019). - PMC - PubMed
    1. Aguet, F. et al. Genetic effects on gene expression across human tissues. Nature550, 204–213 (2017). - PMC - PubMed
    1. Võsa, U. et al. Large-scale cis- and trans-eQTL analyses identify thousands of genetic loci and polygenic scores that regulate blood gene expression. Nat. Genet.53, 1300–1310 (2021). - PMC - PubMed
    1. Yao, D. W., O’connor, L. J., Price, A. L. & Gusev, A. Quantifying genetic effects on disease mediated by assayed gene expression levels. Nat. Genet.52, 626–633 (2020). - PMC - PubMed
    1. Chun, S. et al. Limited statistical evidence for shared genetic effects of eQTLs and autoimmune-disease-associated loci in three major immune-cell types. Nat. Genet.49, 600–605 (2017). - PMC - PubMed

Substances