. 2024 Dec 3;14(1):30085.
doi: 10.1038/s41598-024-81687-2.

Effects of the therapeutic correction of U1 snRNP complex on Alzheimer's disease

Affiliations

Effects of the therapeutic correction of U1 snRNP complex on Alzheimer's disease

Caio Bruno Q S Leal et al. Sci Rep. .

Abstract

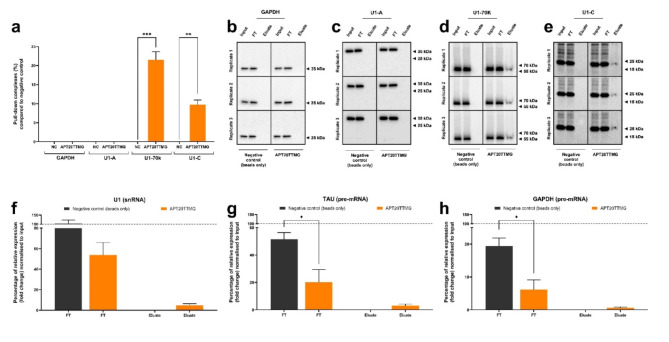
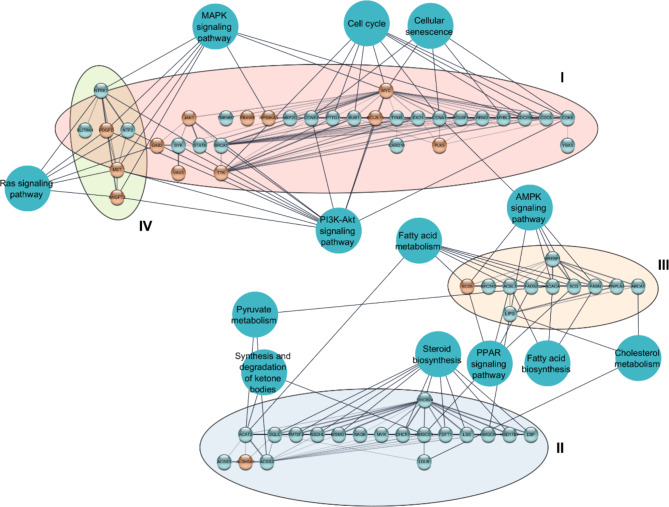
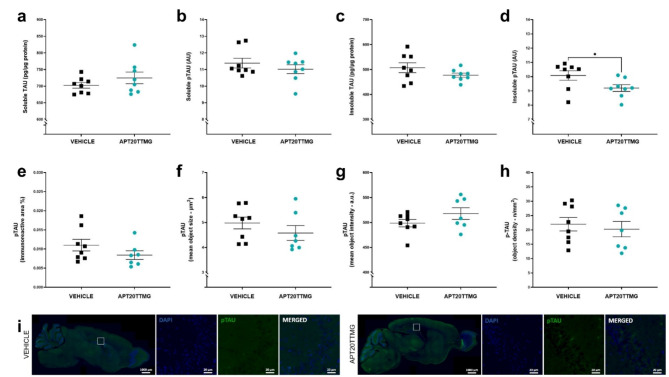
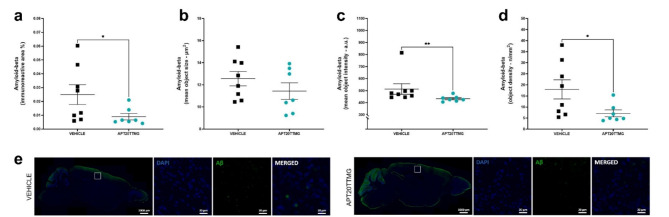
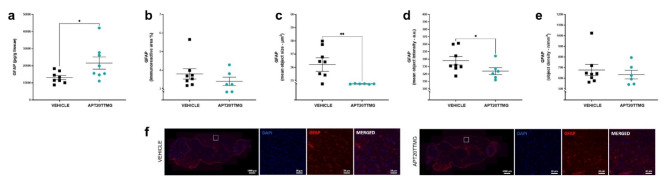
The U1 snRNP complex recognizes pre-mRNA splicing sites in the early stages of spliceosome assembly and suppresses premature cleavage and polyadenylation. Its dysfunction may precede Alzheimer's disease (AD) hallmarks. Here we evaluated the effects of a synthetic single-stranded cDNA (APT20TTMG) that interacts with U1 snRNP, in iPSC-derived neurons from a donor diagnosed with AD and in the SAMP8 mouse model. APT20TTMG effectively binds to U1 snRNP, specifically decreasing TAU in AD neurons, without changing mitochondrial activity or glutamate. Treatment enhanced neuronal electrical activity, promoted an enrichment of differentially expressed genes related to key processes affected by AD. In SAMP8 mice, APT20TTMG reduced insoluble pTAU in the hippocampus, amyloid-beta and GFAP in the cortex, and U1-70 K in both brain regions, without cognitive changes. This study highlights the correction of the U1 snRNP complex as a new target for AD.

Keywords: Alzheimer’s disease; Amyloid-beta; Astrogliosis; TAU; U1 snRNP; U1-70K.


Conflict of interest statement

Declarations. Competing interests: C.B.Q.S.L. has filed a patent related to this work (US11946050B2). C.G.M.Z., V.V.C.S., and E.S.S. are employees of Aptah Bio Inc. C.B.Q.S.L. and R.M.B. are co-founders of Aptah Bio Inc. R.M.B. is an employee of Vesper Biotechnologies. B.P., A.C.W., X.Y.C., and R.V.S. are employees of Ananda Devices Inc. M.H.M. is a founder of Ananda Devices Inc. M.S.R. and L.B. are members of the scientific advisory board of Aptah Bio Inc.

Figures

Fig. 1
Fig. 1
APT20TTMG selectively binds to U1 snRNP complex, U1 snRNA, and pre-mRNAS. Human neuroblastoma SK-N-SH cells were lysed and prepared for protein immunoprecipitation, with quantifications normalized in relation to input (100%), and pull-down assays, performed with RNA isolated from input (50%), flow-through - FT (50%), and eluate (100%) samples. Percentage of assembly to GAPDH, U1-A, U1-70 K, and U1-C (a). Western blot representative images of GAPDH, U1-A, U1-70 K, and U1-C (be). Relative expression of U1 snRNA, TAU, and GAPDH pre-mRNAs (fh). Data are represented as mean ± SEM. Graphs show data from three independent experiments, analyzed using ANOVA, followed by Tukey’s post hoc test, or t-test. *P < 0.05, **P < 0.01, and ***P < 0.001.
Fig. 2
Fig. 2
APT20TTMG does not affect mitochondrial activity in iPSC-derived neurons and microglia, or glutamate in neurons, while enhances spontaneous neuronal electrical activity and specifically decreases TAU levels in iPSC-derived AD neurons. iPSC-derived healthy and AD neurons and microglia, cultured for 6 days, were treated with different concentrations of APT20TTMG (neurons: 6.17, 18.52, 55.56, 166.67, or 500 nM; microglia:18.52 or 500 nM), for 7 days. Mitochondrial activity of neurons (a) and microglia (b), measured by the MTT assay. Glutamate levels in iPSC-derived neurons (c), measured by the Glutamate-Glo™ Assay. For the analysis of neuronal electrical activity, iPSC-derived neurons cultured for 6 days were treated with two concentrations of APT20TTMG (18.52 nM or 500 nM), three times per week, and the electrophysiological measurements were performed 4 h before treatments, with a total recording time of 5 min. The spontaneous firing was performed 2 min before and after stimulation, and the spontaneous activity was recorded from days six to 108. Mean firing rate of healthy neurons (upper: dotted, orange, and red lines represent medium (negative control), 18.52 nM APT20TTMG, and 500 nM APT20TTMG, respectively) and AD neurons (lower: dotted, light blue, and dark blue lines represent medium (negative control), 18.52 nM APT20TTMG, and 500 nM APT20TTMG, respectively) (d). TAU protein levels were evaluated by the Human Tau SimpleStep ELISA (e). Data are represented as mean ± SEM or mean firing rate (Hz). Graphs show data from three independent experiments performed in three technical replicates, for mitochondrial activity and TAU levels in neurons, two independent experiments performed in three technical replicates for mitochondrial activity in microglia, three independent experiments performed in six technical replicates for glutamate release, and one biological replicate performed in six technical replicates for electrophysiology, analyzed using ANOVA, followed by Tukey’s post hoc test (graphs a-d) or Dunnett’s post hoc test (graph e). *P < 0.05 and **P < 0.01.
Fig. 3
Fig. 3
APT20TTMG induces beneficial changes in gene expression profile in iPSC-derived neurons. Protein-protein interaction network and clustering obtained from enrichment analysis of metabolic pathways of differentially expressed genes (DEGs) in AD neurons treated with 18.52 nM APT20TTMG using STRING and AutoAnnotate apps from Cytoscape. Inside each cluster, the nodes represent protein products of the investigated DEGs and the edges denote protein-protein interactions. The blue nodes represent the main enriched metabolic pathways related to the protein clusters. Blue and red circles represent upregulated and downregulated genes, respectively. Cluster I: cell cycle (FDR value 2.95E-7, 12 DEGs), PI3K-Akt signaling (FDR value 3.43E-6, 17 DEGs), and cellular senescence (FDR value 5.65E-5, 10 DEGs) pathways. Cluster II: steroid biosynthesis (FDR value 3.64E-11, 10 DEGs), synthesis and degradation of ketone bodies (FDR value 0.0171, two DEGs), and pyruvate metabolism (FDR value 0.018, three DEGs) pathways. Cluster III: fatty acid metabolism (FDR value 3.7E-5, seven DEGs) and biosynthesis (FDR value 0.004, three DEGs), cholesterol metabolism (FDR value 0.0063, four DEGs), AMPK (FDR value 3.71E-9, 14 DEGs), and PPAR (FDR value 9.2E-4, six DEGs) signaling pathways. Cluster IV: MAPK (FDR value 7.45E-9, 19 DEGs) and Ras (FDR value 5.54E-5, 12 DEGs) signaling pathways.
Fig. 4
Fig. 4
APT20TTMG decreases U1-70 K immunofluorescence in the cerebral cortex and hippocampus of SAMP8 mice. Following a 42-day treatment with 0.3 µg/day APT20TTMG or vehicle, female SAMP8 mice brains were collected and the cortex and hippocampus were processed for U1-70 K immunohistochemistry. Immunoreactive area (a), mean object size (b), mean object intensity (c), mean object density (d) in cortex, and representative image of cortex, double-labeled with U1-70 K (cytoplasm) and DAPI (nucleus) (e). Immunoreactive area (f), mean object size (g), mean object intensity (h), mean object density (i) in hippocampus, and representative image of hippocampus, double-labeled with U1-70 K (cytoplasm) and DAPI (nucleus) (j). The means of immunofluorescent signal were measured within the regions of interest (ROI) on 5 brain sections per mouse and data are represented as mean ± SEM (n = 7–8). Graphs were analyzed using T-test (a, b, c, f, g, h, and i) or Mann-Whitney test (d), comparing all groups to vehicle-treated control animals. *P < 0.05 and **P < 0.01.
Fig. 5
Fig. 5
APT20TTMG specifically decreases levels of insoluble pTAU in the hippocampus of SAMP8 mice. Following a 42-day treatment with 0.3 µg/day APT20TTMG or vehicle, female SAMP8 mice brains were collected and the hippocampus processed for ELISA and immunohistochemistry analysis. Levels of soluble TAU (a), soluble pTAU (T231) (b), insoluble TAU (c), and insoluble pTAU (T231) (d) in the hippocampus were measured by ELISA. Immunoreactive area (e), mean object size (f), mean object intensity (g), mean object density (h) for pSer202/pThr205-TAU in the hippocampus, and representative image of hippocampus, double-labeled with pTAU (cytoplasm) and DAPI (nucleus) (i). For ELISA, data are represented as mean ± SEM (n = 8). The means of immunofluorescent signal were measured within the regions of interest (ROI) on 5 brain sections per mouse and data are represented as mean ± SEM (n = 7–8). Graphs were analyzed using t-test (a, c, d-h) or Mann-Whitney test (b), comparing all groups to vehicle-treated control animals. *P < 0.05.
Fig. 6
Fig. 6
APT20TTMG decreases Aβ immunofluorescence in the cerebral cortex of SAMP8 mice. Following a 42-day treatment with 0.3 µg/day APT20TTMG or vehicle, female SAMP8 mice brains were collected and the cortex processed for immunohistochemistry analysis. Immunoreactive area (a), mean object size (b), mean object intensity (c), mean object density (d) in the cerebral cortex, and representative image of cortex, double-labeled with Aβ (cytoplasm) and DAPI (nucleus) (e). The means of immunofluorescent signal were measured within the regions of interest (ROI) on 5 brain sections per mouse and data are represented as mean ± SEM (n = 7–8). Graphs were analyzed using Mann-Whitney test (a and c) or T-test (b and d), comparing all groups to vehicle-treated control animals. *P < 0.05 and **P < 0.01.
Fig. 7
Fig. 7
APT20TTMG increases soluble GFAP levels and decreases GFAP immunofluorescence in the cerebral cortex of SAMP8 mice. Following a 42-day treatment with 0.3 µg/day APT20TTMG or vehicle, female SAMP8 mice brains were collected. Levels of GFAP were measured by ELISA, in the soluble fraction of the cortex, and by immunohistochemistry. GFAP levels in the soluble fraction (a), immunoreactive area (b), mean object size (c), mean object intensity (d), mean object density (e) of GFAP immunofluorescence in the cortex, and representative image of cortex, double-labeled with GFAP (cytoplasm) and DAPI (nucleus) (f). Samples for ELISA were collected from 8 animals per treatment, and the means of immunofluorescent signal were measured within the regions of interest (ROI) on 5 brain sections per mouse. Data are represented as mean ± SEM (n = 6–8). Graphs were analyzed using T-test (a-c, e) or Mann-Whitney test (d), comparing all groups to vehicle-treated control animals. *P < 0.05 and **P < 0.01.

References

    1. Ran, Y., Deng, Y. & Yao, C. U1 snRNP telescripting: molecular mechanisms and beyond. RNA Biol.18, 1512–1523 (2021). - PMC - PubMed
    1. So, B. R. et al. A complex of U1 snRNP with cleavage and polyadenylation factors controls telescripting, regulating mRNA transcription in human cells. Mol. Cell.76, 590–599.e4 (2019). - PMC - PubMed
    1. Liu, J., Lu, X., Zhang, S., Yuan, L. & Sun, Y. Molecular insights into mRNA polyadenylation and deadenylation. Int. J. Mol. Sci.23, 10985 (2022). - PMC - PubMed
    1. Chen, P. C. et al. Alzheimer’s disease-associated U1 snRNP splicing dysfunction causes neuronal hyperexcitability and cognitive impairment. Nat. Aging. 2, 923–940 (2022). - PMC - PubMed
    1. Cheng, Z., Shang, Y., Gao, S. & Zhang, T. Overexpression of U1 snRNA induces decrease of U1 spliceosome function associated with Alzheimer’s disease. J. Neurogenet.31, 337–343 (2017). - PubMed

Substances