. 2024 Dec 3;7(1):1609.
doi: 10.1038/s42003-024-07307-x.

SARS-CoV-2 Nsp6-Omicron causes less damage to the Drosophila heart and mouse cardiomyocytes than ancestral Nsp6

Affiliations

SARS-CoV-2 Nsp6-Omicron causes less damage to the Drosophila heart and mouse cardiomyocytes than ancestral Nsp6

Jun-Yi Zhu et al. Commun Biol. .

Abstract

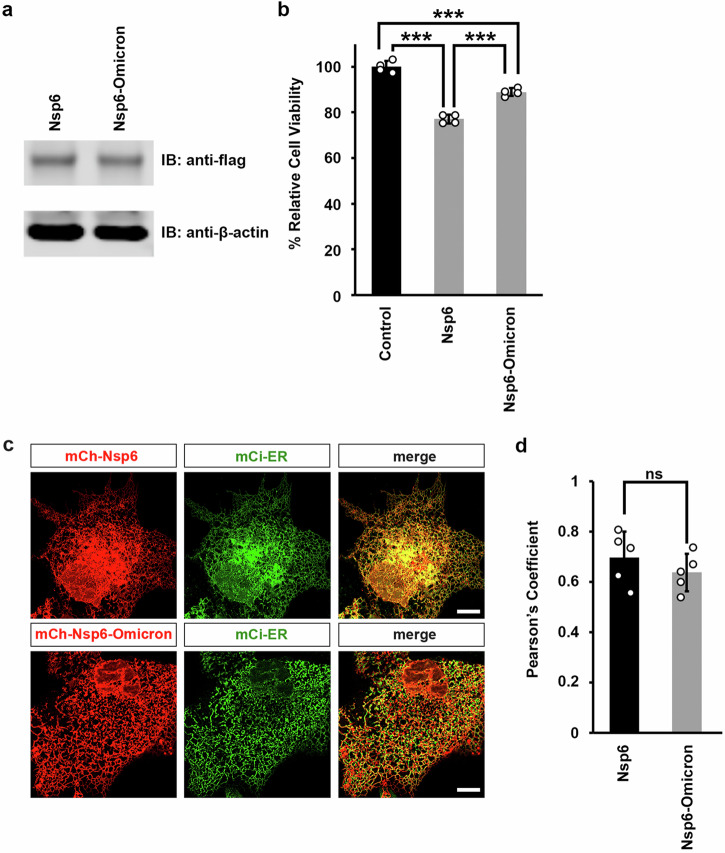
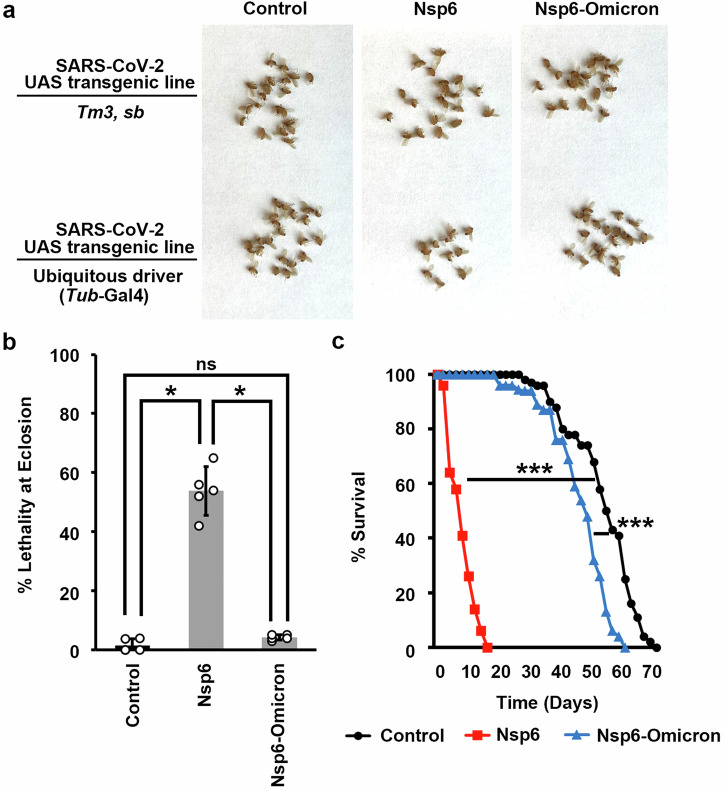
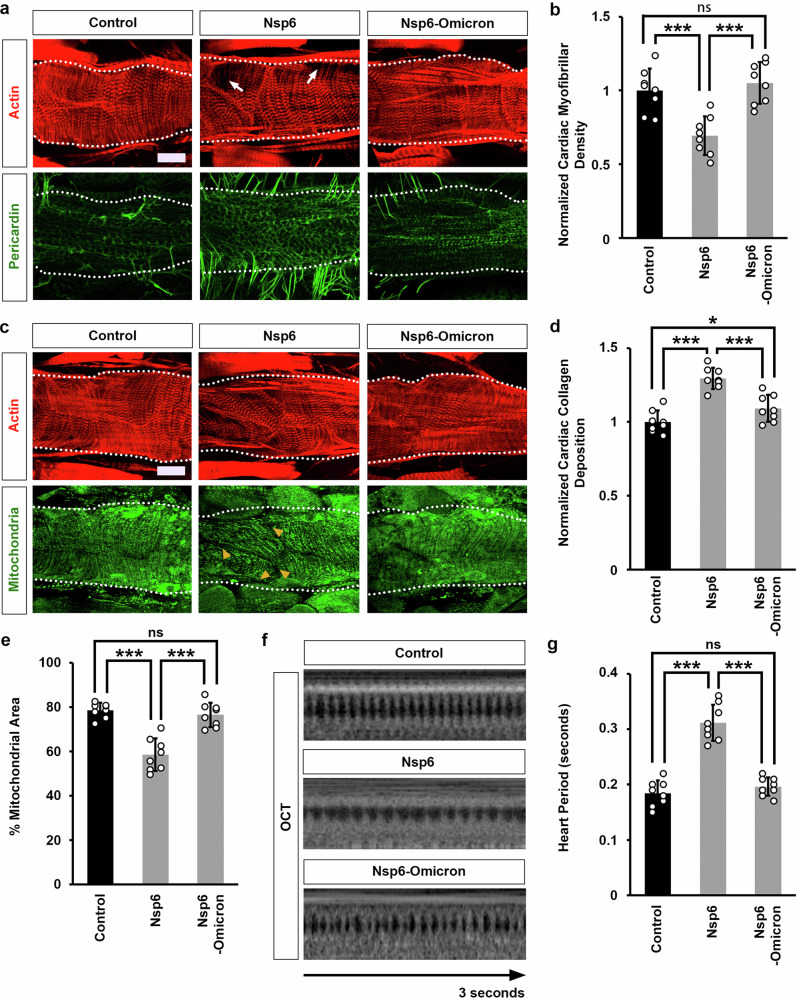
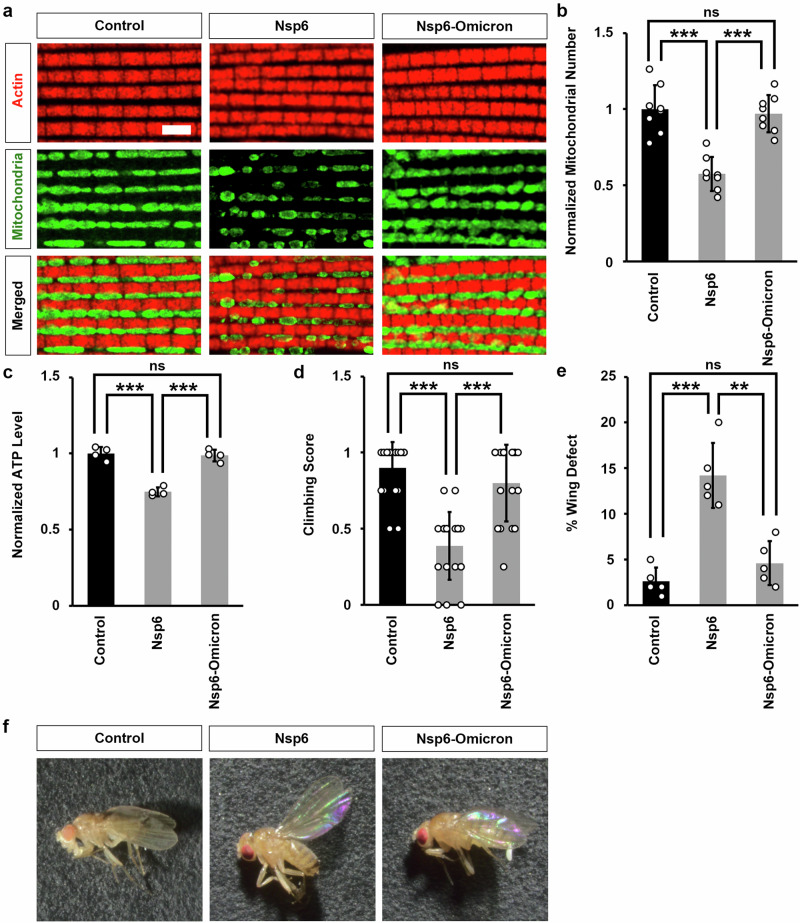
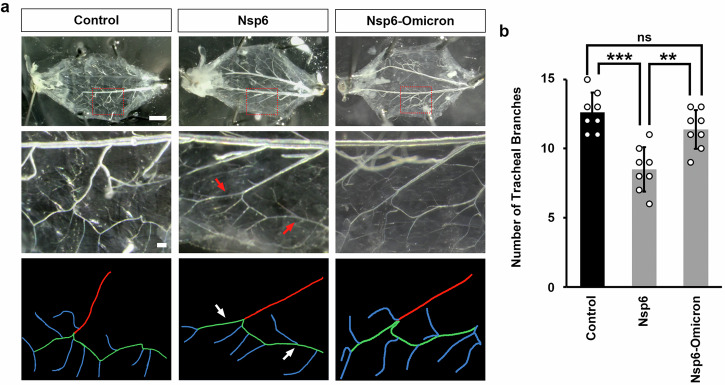
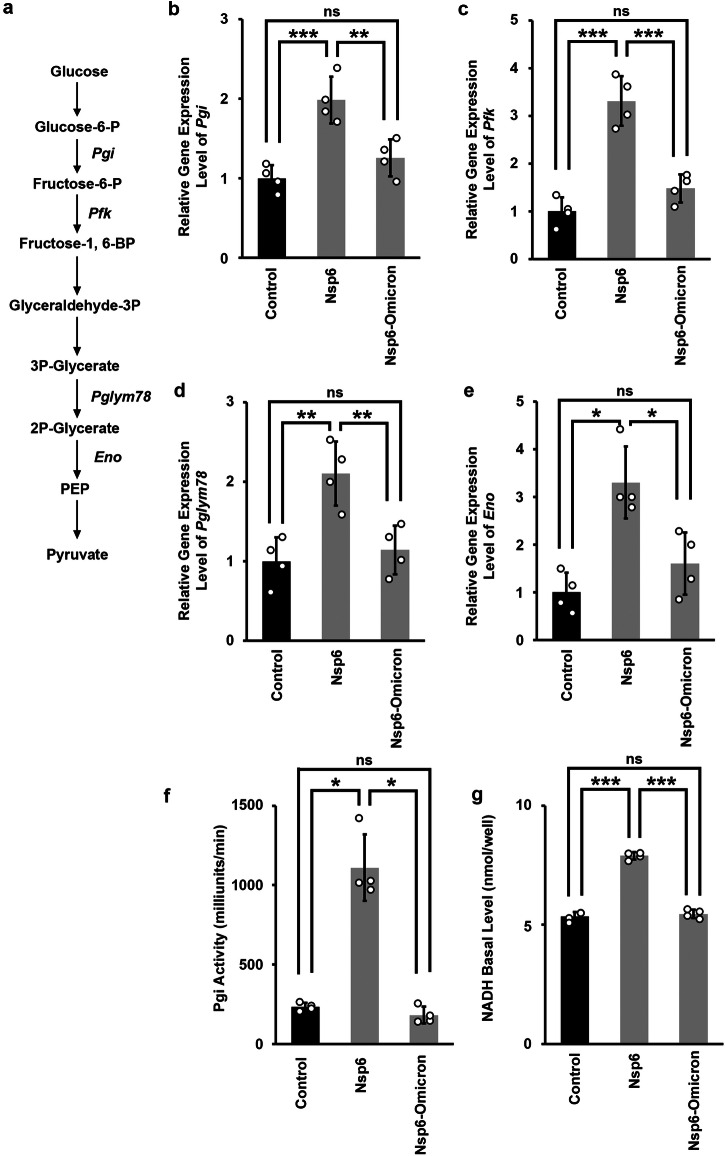
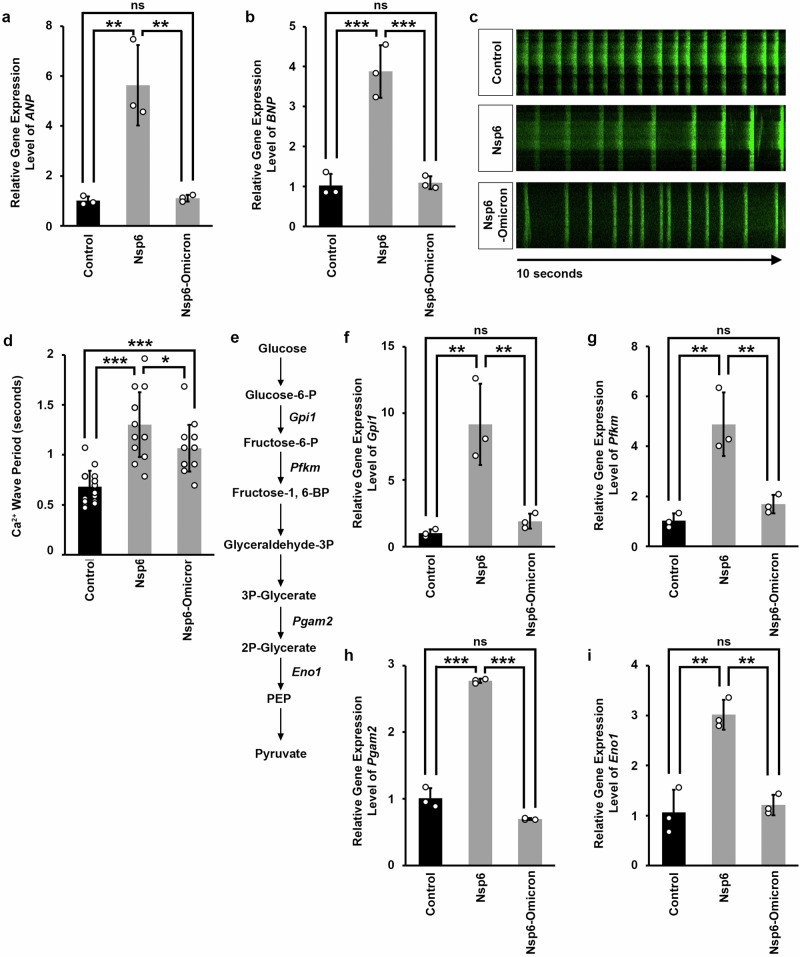
A few years into the COVID-19 pandemic, the SARS-CoV-2 Omicron strain rapidly becomes and has remained the predominant strain. To date, Omicron and its subvariants, while more transmittable, appear to cause less severe disease than prior strains. To study the cause of this reduced pathogenicity we compare SARS-CoV-2 ancestral Nsp6 with Nsp6-Omicron, which we have previously identified as one of the most pathogenic viral proteins. Here, through ubiquitous expression in Drosophila, we show that ancestral Nsp6 causes both structural and functional damage to cardiac, muscular, and tracheal (lung) tissue, whereas Nsp6-Omicron has minimal effects. Moreover, we show that ancestral Nsp6 dysregulates the glycolysis pathway and disrupts mitochondrial function, whereas Nsp6-Omicron does not. Through validation in mouse primary cardiomyocytes, we find that Nsp6-induced dysregulated glycolysis underlies the cardiac dysfunction. Together, the results indicate that the amino acid changes in Omicron might hinder its interaction with host proteins thereby minimizing its pathogenicity.


Conflict of interest statement

Competing interests: The authors declare no competing interests.

Figures

Fig. 1
Fig. 1. SARS-CoV-2 ancestral Nsp6 vs. Nsp6-Omicron, cellular toxicity and localization.
a Western blot analysis of Nsp6 protein in HEK 293T cells after ancestral Nsp6 and Nsp6-Omicron transgene expression. b Quantitation of the cell viability in the HEK 293T cells after ancestral Nsp6 and Nsp6-Omicron transgene expression. Control is pCMV6-mCh plasmid. n = 4 independent experimental replicates. Results have been presented as mean ± SD. One-way analysis of variance followed by a Tukey–Kramer posttest (P value: control vs. Nsp6 0.0001832, vs. Nsp6-Omicreon 0.0002862; Nsp6 vs. Nsp6-Omicron 0.0002398); statistical significance: ***P < 0.001. c Cellular localization of ancestral Nsp6 and Nsp6-Omicron. COS-7 cells co-transfected with mCherry (mCh)-tagged Nsp6 or Nsp6-Omicron and the monomeric Citrine (mCi)-tagged ER marker. Scale bar (both): 10 μM. d Quantitation of colocalization of ancestral Nsp6 and Nsp6-Omicron and ER. n = 5 cells per genotype. Results have been presented as mean ± SD. Student’s t test (P value: 0.328439); statistical significance: ns not significant.
Fig. 2
Fig. 2. SARS-CoV-2 ancestral Nsp6 vs. Nsp6-Omicron developmental lethality.
a Images of adult progeny from crosses of the UAS transgene flies with flies carrying the enhancer Tub-Gal4. Progeny can be visually distinguished as carrying the balancer (TM3, Sb; orange eyes and short/stubbly hair on the back; no viral transgene expression) or with the expression of the SARS-CoV-2 ancestral Nsp6 or Nsp6-Omicron transgene driven by the ubiquitous Tubulin (Tub) enhancer (red eyes and long hair). Control, w1118 flies. b Quantitation of lethality rate before eclosion for flies that expressed either the ancestral Nsp6 or the Nsp6-Omicron transgene. Lethality (%) at eclosion calculated as ((long hair − short hair)/short hair) × 100%. n = 6 repeats per genotype, each replicate n = 50 4-day-old flies (females and males). Results have been presented as mean ± SD. Kruskal–Wallis H-test followed by Dunn’s test (P value: control vs. Nsp6 0.01091, vs. Nsp6-Omicreon 0.07965; Nsp6 vs. Nsp6-Omicron 0.01167); statistical significance: *P < 0.05; ***P < 0.001. c Graph displaying lifespan data for adult flies carrying the ancestral Nsp6 or the Nsp6-Omicron transgene. Control, w1118 flies. n = 100 flies (male, 4-day-old) per genotype. Fisher’s Exact test at 50% lethality (P value: control vs. Nsp6 2.0E-12, vs. Nsp6-Omicreon 2.2E−12; Nsp6 vs. Nsp6-Omicron 2.5E−12); statistical significance: ***P < 0.001.
Fig. 3
Fig. 3. SARS-CoV-2 ancestral Nsp6 vs. Nsp6-Omicron effect on cardiac morphology, function, and mitochondria.
a Representative images of cardiac actin myofibers visualized by phalloidin staining (red) and collagen deposition (Pericardin; green). Images were taken in segment A2 of the heart of flies that expressed the SARS-CoV-2 ancestral Nsp6 or Nsp6-Omicron transgene induced by Tub-Gal4. Dotted lines delineate the outline of the heart tube. Arrows point to missing cardiac myofibers. Control, w1118 flies. Scale bar: 40 μM. b Quantitation of adult heart cardiac myofibrillar density (in a). Data normalized to values in control (w1118) flies (P value: control vs. Nsp6 0.0008095, vs. Nsp6-Omicreon 0.7487; Nsp6 vs. Nsp6-Omicron 0.0002496). n = 8 flies (female, 4-day-old) per genotype. c Representative images of cardiac actin myofibers visualized by phalloidin staining (red) and mitochondria (labeled with ATP5A; green). Images were taken in segment A2 of the heart of flies that expressed the SARS-CoV-2 ancestral Nsp6 or Nsp6-Omicron transgene. Dotted lines delineate the outline of the heart tube. Arrowhead points to missing mitochondria. Control, w1118 flies. Scale bar: 40 μM. d Quantitation of adult heart cardiac collagen (Pericardin) deposition (in a). Data normalized to values in control (w1118) flies (P value: control vs. Nsp6 0.0001404, vs. Nsp6-Omicreon 0.08158; Nsp6 vs. Nsp6-Omicron 0.0001577). n = 8 flies (female, 4-day-old) per genotype. e Quantitation of adult heart mitochondrial area (in c) (P value: control vs. Nsp6 0.0009391, vs. Nsp6-Omicreon 0.372; Nsp6 vs. Nsp6-Omicron 0.001948). n = 8 flies (female, 4-day-old) per genotype. f Images of Drosophila heartbeat from movie obtained by optical coherence tomography (OCT) from flies that expressed the ancestral Nsp6 or Nsp6-Omicron transgene induced by Tub-Gal4 (P value: control vs. Nsp6 0.0001404, vs. Nsp6-Omicreon 0.5882; Nsp6 vs. Nsp6-Omicron 0.0001404). Control, w1118 flies. g Quantitation of heart period (in f). n = 8 flies (female, 4-day-old) per genotype. b, d, e, g Results have been presented as mean ± SD. One-way analysis of variance followed by a Tukey–Kramer posttest; statistical significance: *P < 0.05; ***P < 0.001; ns not significant.
Fig. 4
Fig. 4. SARS-CoV-2 ancestral Nsp6 vs. Nsp6-Omicron effect on muscular mitochondria and locomotion defects.
a Representative images of actin in the indirect flight muscle (labeled with Phalloidin; red) and mitochondria (labeled with ATP5A; green) morphology in flies that expressed the ancestral Nsp6 or Nsp6-Omicron SARS-CoV-2 transgene induced by Tub-Gal4. Control, w1118 flies. Scale bar: 5 μM. b Quantitation of the number of mitochondria in the fly indirect flight muscle (in a) of both wings normalized by control (w1118) counts (P value: control vs. Nsp6 0.0001441, vs. Nsp6-Omicreon 0.8919; Nsp6 vs. Nsp6-Omicron 0.0001531). n = 8 flies (female, 4-day-old) per genotype. c Quantitation of ATP levels in the fly indirect flight muscle normalized by control (w1118) counts (P value: control vs. Nsp6 0.0001879, vs. Nsp6-Omicreon 0.8875; Nsp6 vs. Nsp6-Omicron 0.0001919). n = 8 flies (female, 4-day-old) per genotype. d Quantitation of climbing ability of flies that expressed the SARS-CoV-2 ancestral Nsp6 or Nsp6-Omicron transgene. Data normalized to values in control (w1118) flies (P value: control vs. Nsp6 3.31e−6, vs. Nsp6-Omicreon 0.2159; Nsp6 vs. Nsp6-Omicron 3.432e−4). n = 20 flies (female, 4-day-old) per genotype. e Quantitation of flies with held-up wing phenotype (i.e., % wing defect). Control, w1118 flies. n = 6 repeats per genotype, each replicate n = 50 flies (female, 4-day-old) (P value: control vs. Nsp6 0.0002255, vs. Nsp6-Omicreon 0.4751; Nsp6 vs. Nsp6-Omicron 0.0004056). f Representative images of typical (control, w1118 flies) and “held-up” wing phenotype in flies that expressed the ancestral Nsp6 or Nsp6-Omicron SARS-CoV-2 transgene induced by Tub-Gal4. be Results have been presented as mean ± SD. One-way analysis of variance followed by a Tukey–Kramer posttest: **P < 0.01; ***P < 0.001; ns not significant.
Fig. 5
Fig. 5. SARS-CoV-2 ancestral Nsp6 vs. Nsp6-Omicron effect on tracheal branching.
a Representative images of tracheal branches in SARS-CoV-2 ancestral Nsp6 or Nsp6-Omicron transgene expressing flies induced by Tub-Gal4. Control, w1118 flies. Scale bar: 0.5 mm. Red box denotes the area shown at higher magnification (Scale bar: 0.05 mm) below the image. At the bottom, tracheal branches are labeled to indicate the central branch (red), class I terminal branch (green), and class II terminal branch (blue). Arrow (red/ corresponding white) indicates a missing class II terminal branch. b Quantitation of the average tracheal branch number in one segment (averaged over larval segments A3-A5 for each larva) (see a) (P value: control vs. Nsp6 0.000174, vs. Nsp6-Omicreon 0.231; Nsp6 vs. Nsp6-Omicron 0.00241). n = 8 larvae (3rd instar) per genotype. Results have been presented as mean ± SD. Kruskal–Wallis H-test followed by Dunn’s test; statistical significance: **P < 0.01; ***P < 0.001; ns not significant.
Fig. 6
Fig. 6. SARS-CoV-2 ancestral Nsp6 vs. Nsp6-Omicron effect on glycolysis.
a Key metabolites in the Drosophila glycolysis pathway. be Quantitation of the expression levels of the indicated glycolysis genes (Pgi, in b; Pfk, in c; Pglym78, in d; Eno, in e) in flies that expressed the SARS-CoV-2 ancestral Nsp6 or Nsp6-Omicron transgene induced by Tub-Gal4, with data normalized to expression values in the control (w1118) flies (b P value: control vs. Nsp6 0.0007509, vs. Nsp6-Omicreon 0.3162; Nsp6 vs. Nsp6-Omicron 0.004821, c P value: control vs. Nsp6 0.0002117, vs. Nsp6-Omicreon 0.2319; Nsp6 vs. Nsp6-Omicron 0.0003961, d P value: control vs. Nsp6 0.003504, vs. Nsp6-Omicreon 0.8268; Nsp6 vs. Nsp6-Omicron 0.008067, e P value: control vs. Nsp6 0.0294, vs. Nsp6-Omicreon 0.1939; Nsp6 vs. Nsp6-Omicron 0.0294). n = 4 flies (female, 4-day-old) per genotype. f Quantitation of the enzymatic activity of Phosphoglucose isomerase (Pgi) in control flies (w1118), or those that expressed the SARS-CoV-2 ancestral Nsp6 or Nsp6-Omicron transgene induced by Tub-Gal4 (P value: control vs. Nsp6 0.03038, vs. Nsp6-Omicreon 0.1939; Nsp6 vs. Nsp6-Omicron 0.03038). n = 4 flies (female, 4-day-old) per genotype. g Quantitation of the NADH level in control flies (w1118), or those that expressed the SARS-CoV-2 ancestral Nsp6 or Nsp6-Omicron transgene induced by Tub-Gal4 (P value: control vs. Nsp6 0.0001832, vs. Nsp6-Omicreon 0.6515; Nsp6 vs. Nsp6-Omicron 0.0001832). n = 4 flies (female, 4-day-old) per genotype. be Results have been presented as mean ± SD. Kruskal–Wallis H-test followed by Dunn’s test; statistical significance: *P < 0.05; ***P < 0.001; ns not significant.
Fig. 7
Fig. 7. SARS-CoV-2 ancestral Nsp6 vs. Nsp6-Omicron cardiac hypertrophy, functional defects, and effect on glycolysis in mouse primary cardiomyocytes.
a Quantitation of hypertrophy marker ANP relative to control. ANP, Atrial natriuretic peptide. Data normalized to values in control (empty pcDNA3 plasmid) cardiomyocytes (P value: control vs. Nsp6 0.00155, vs. Nsp6-Omicreon 0.9905; Nsp6 vs. Nsp6-Omicron 0.001705). n = primary cardiomyocytes from 8 embryonic mice (E12.5) per condition. b Quantitation of hypertrophy marker BNP relative to control. BNP, type B natriuretic peptide. Data normalized to values in control (pcDNA3 plasmid) (P value: control vs. Nsp6 0.0006162, vs. Nsp6-Omicreon 0.9774; Nsp6 vs. Nsp6-Omicron 0.0006767). n = primary cardiomyocytes from 8 embryonic mice (E12.5) per condition. c Mouse primary cardiomyocyte Ca2+ wave video images from mouse primary cardiomyocytes transfected with the UAS-SARS-CoV-2 ancestral Nsp6 or Nsp6-Omicron transgene. Control, cardiomyocytes transfected with the empty pcDNA3 plasmid. d Quantitation of the Ca2+ wave rate (in c) (P value: control vs. Nsp6 0.0001292, vs. Nsp6-Omicreon 0.0002432; Nsp6 vs. Nsp6-Omicron 0.01545). n = 15 primary embryonic mouse (E12.5) cardiomyocytes per condition. e Key metabolites in the mammalian glycolysis pathway. fi Quantitation of the expression levels of the indicated glycolysis genes in mouse primary cardiomyocytes transfected with the SARS-CoV-2 ancestral Nsp6 or Nsp6-Omicron transgene, normalized to control (empty pcDNA3 plasmid) mouse primary cardiomyocytes (f P value: control vs. Nsp6 0.003609, vs. Nsp6-Omicreon 0.8226; Nsp6 vs. Nsp6-Omicron 0.006295; g P value: control vs. Nsp6 0.002482, vs. Nsp6-Omicreon 0.5898; Nsp6 vs. Nsp6-Omicron 0.006094; h P value: control vs. Nsp6 0.0002269, vs. Nsp6-Omicreon 0.01409; Nsp6 vs. Nsp6-Omicron 0.0002269; i P value: control vs. Nsp6 0.001104, vs. Nsp6-Omicreon 0.8559; Nsp6 vs. Nsp6-Omicron 0.001588). n = primary cardiomyocytes from 8 embryonic mice (E12.5) per condition. a, b, d, fi Results have been presented as mean ± SD. Kruskal–Wallis H-test followed by Dunn’s test; statistical significance: *P < 0.05; **P < 0.01; ***P < 0.001; ns not significant.

Similar articles

References

    1. Centers for Disease Control and Prevention. COVID Data Tracker. CDC,https://covid.cdc.gov/covid-data-tracker/#variant-summary (2024).
    1. European Centre for Disease Prevention and Control-An agency of the European Union. SARS-CoV-2 variants of concern as of 16 February 2024. ECDC,https://www.ecdc.europa.eu/en/covid-19/variants-concern (2024).
    1. Lin, L., Liu, Y., Tang, X. & He, D. The Disease Severity and Clinical Outcomes of the SARS-CoV-2 Variants of Concern. Front Public Health9, 775224 (2021). - PMC - PubMed
    1. Moolla, M. S. et al. A tale of two waves: Characteristics and outcomes of COVID-19 admissions during the omicron-driven 4th wave in Cape Town, South Africa and implications for the future. IJID Reg.10.1016/j.ijregi.2022.11.008 (2022). - PMC - PubMed
    1. Davies, M.-A. et al. Outcomes of laboratory-confirmed SARS-CoV-2 infection during resurgence driven by Omicron lineages BA.4 and BA.5 compared with previous waves in the Western Cape Province, South Africa. Int. J. Infect. Dis. 10.1016/j.ijid.2022.11.024 (2022). - PMC - PubMed

MeSH terms

Substances

LinkOut - more resources